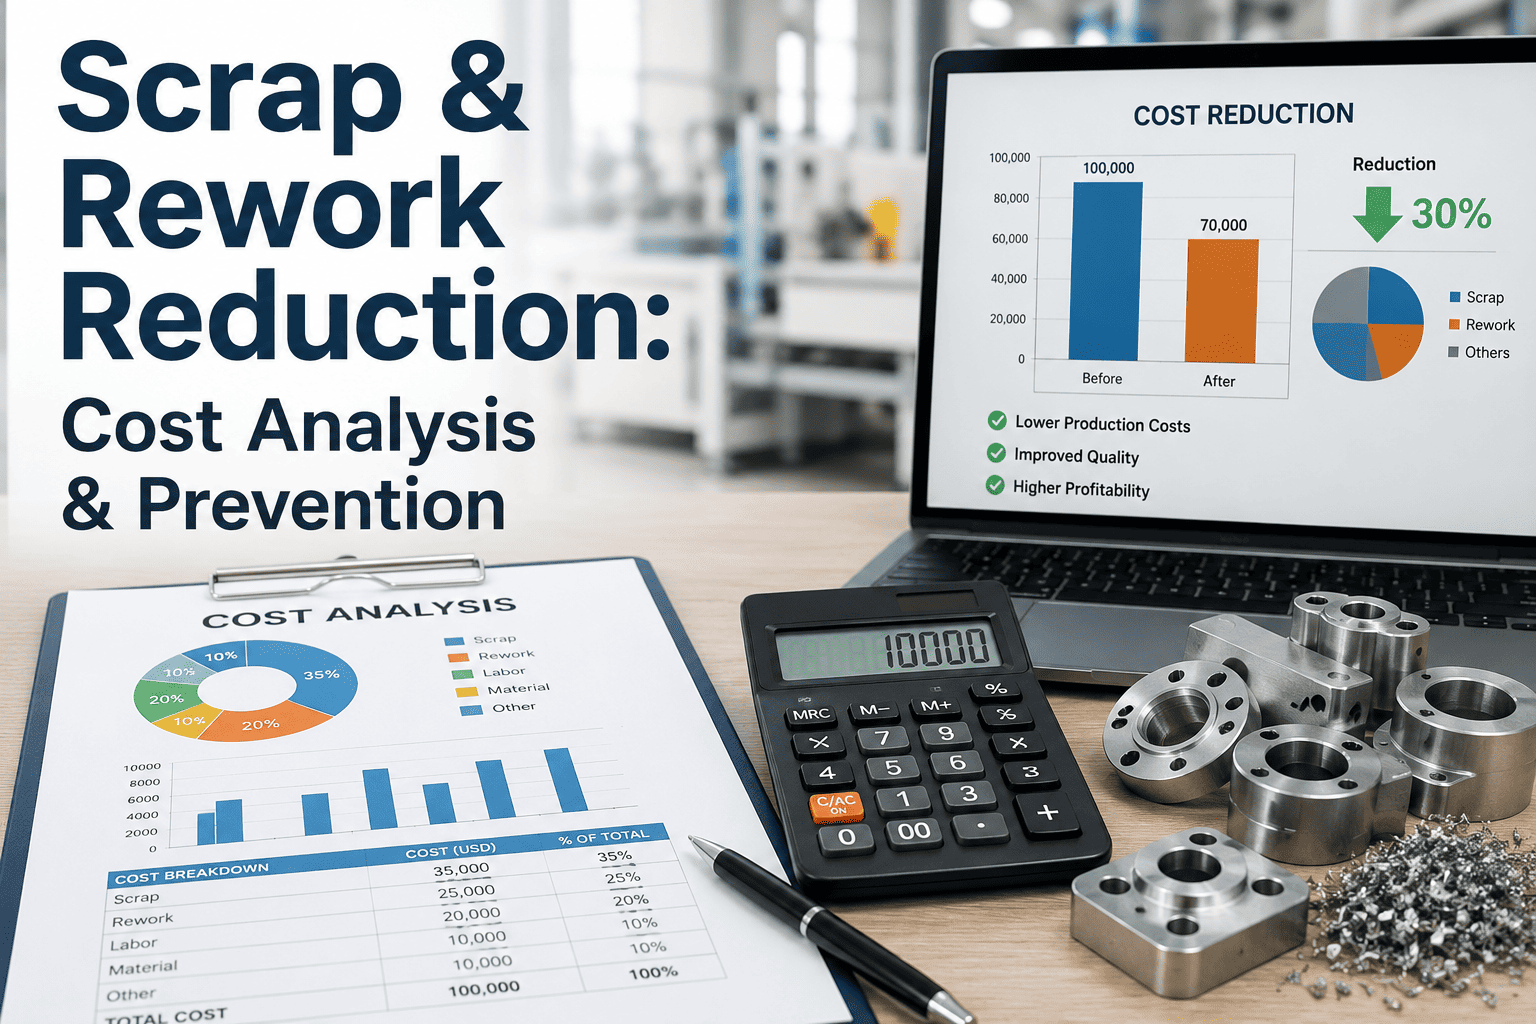
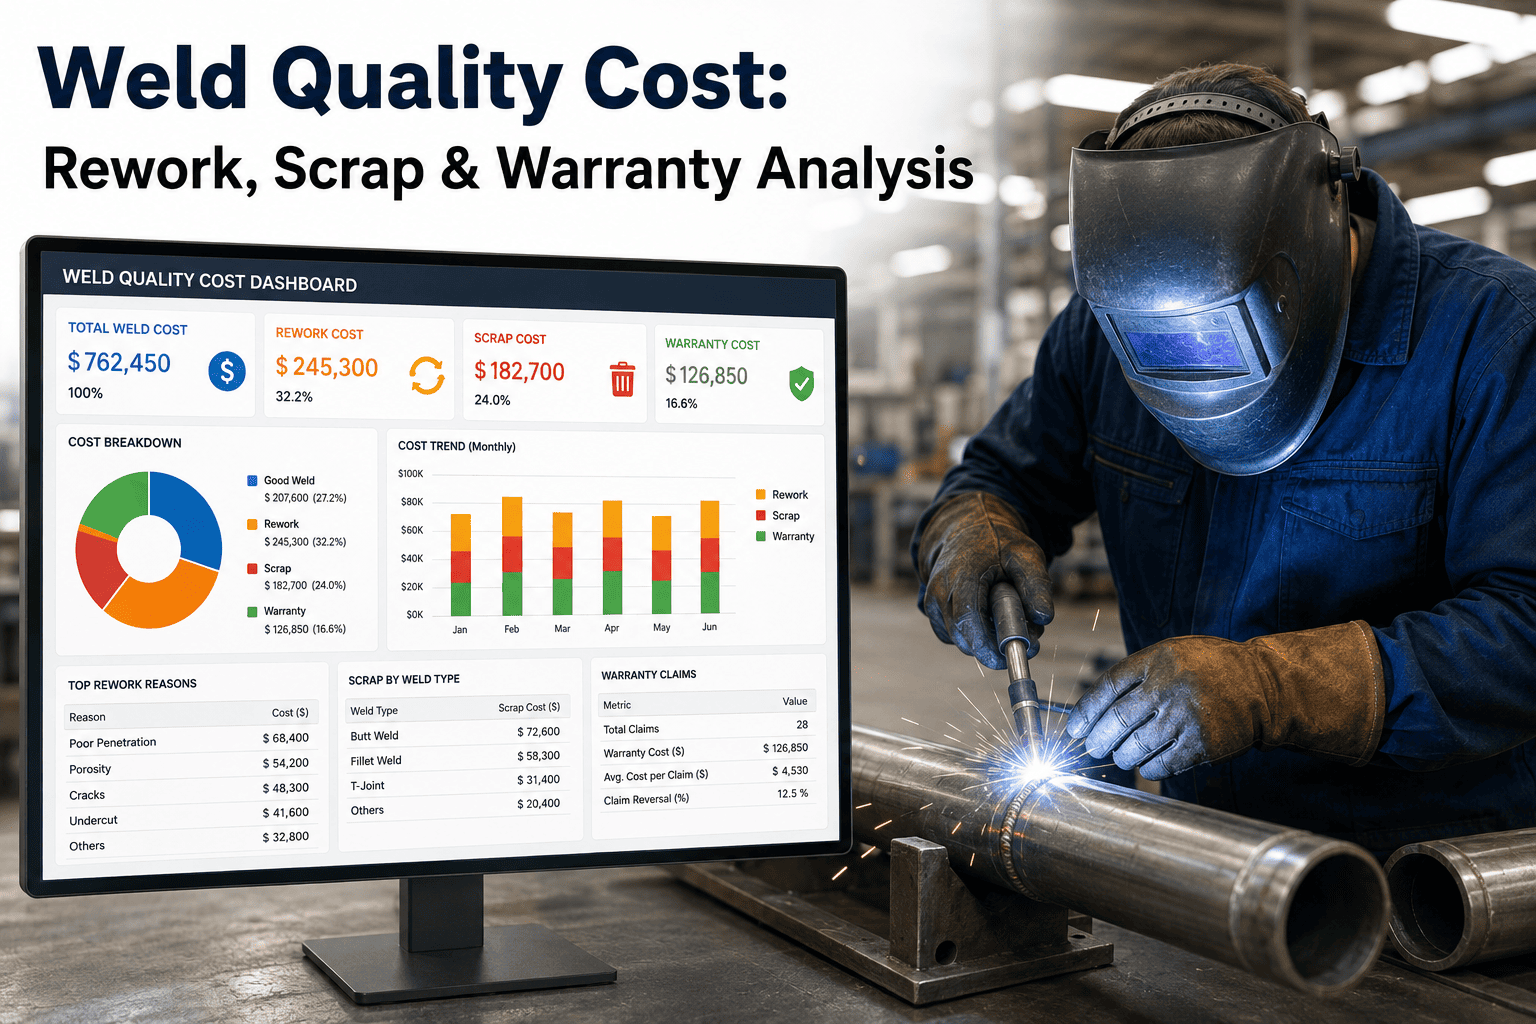
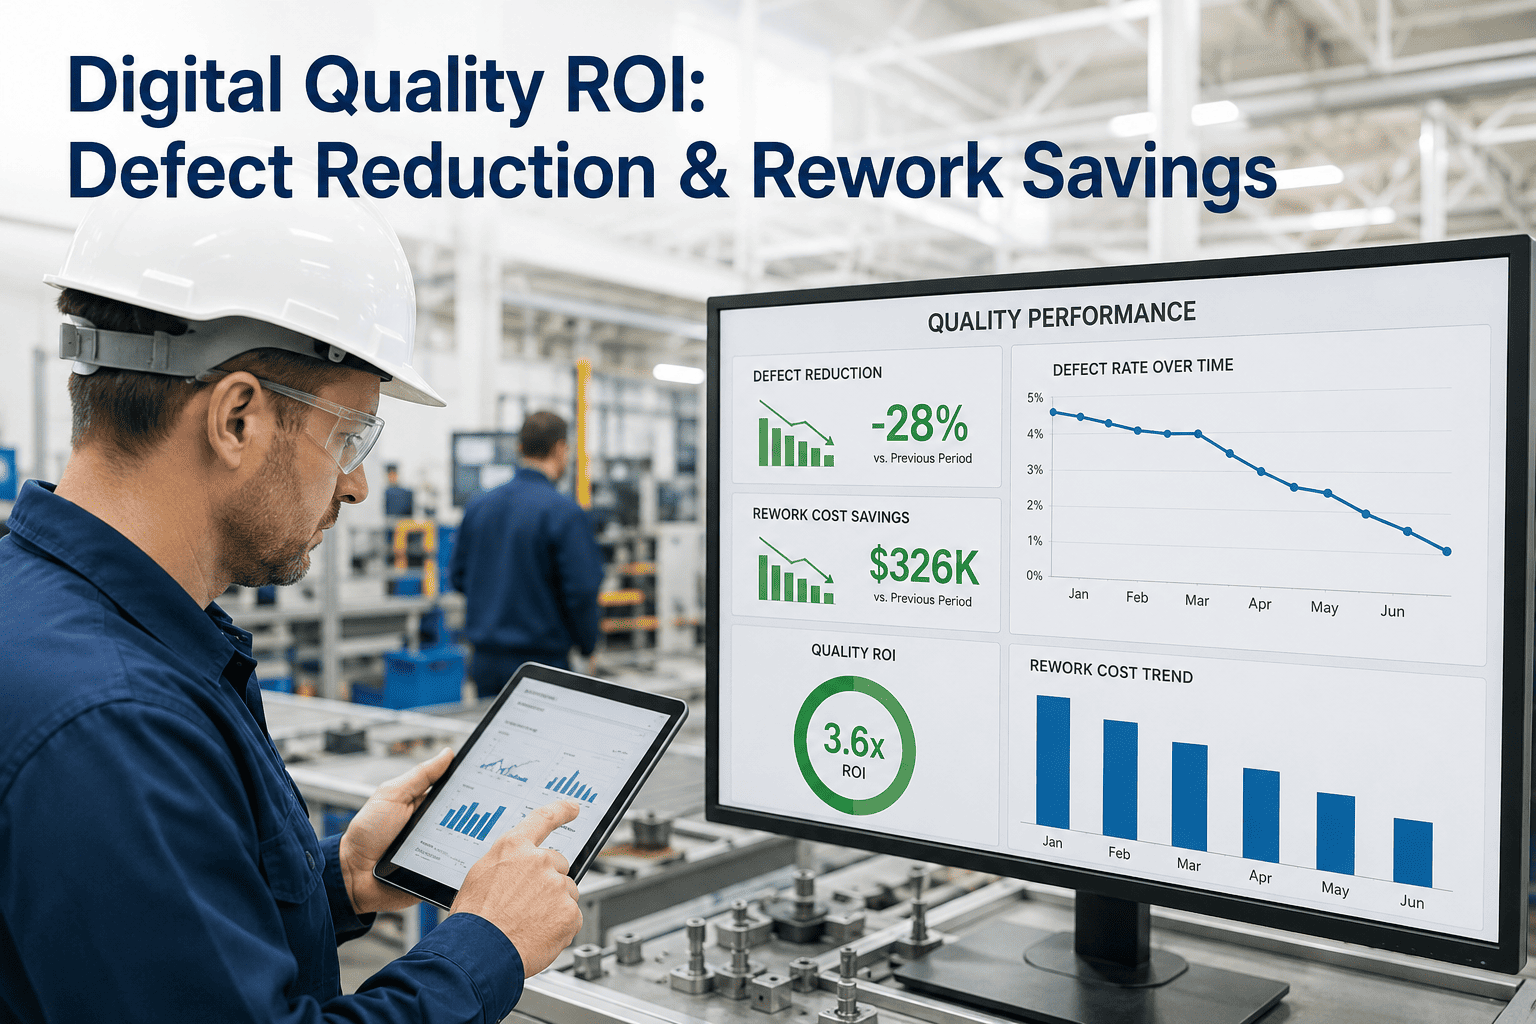
Ask a plant controller what scrap and rework cost the business and most will quote a number pulled straight from the material write-off line — often somewhere around 2% of revenue. Ask a quality engineer who has actually traced a defect through re-inspection labor, tied-up machine capacity, expedited replacement shipping, and the engineering hours spent investigating it, and the real number is frequently three to five times higher than what finance reported. Scrap and rework reduction only works when the analysis captures the full cost, not just the visible material write-off, and when root cause identification replaces the reflexive response of simply tightening final inspection. Book a demo with iFactory's quality analytics team to see your true scrap and rework cost quantified against real production data.
Operations Management · Scrap & Rework Reduction
Scrap and Rework Reduction: Finding the Cost Hiding Below the Waterline
Full cost quantification, root cause identification by category, first-time-through tracking, and a prevention-focused reduction roadmap — because the visible scrap bin is rarely more than a third of what poor quality actually costs.
The Real Cost Structure
The Visible Scrap Bin Is the Tip of the Iceberg
Most plants calculate scrap cost as material and labor consumed in the defective unit itself — the number that shows up on a material write-off report. That number is real, but it typically represents only the visible fraction of the total cost of poor quality. Below the waterline sits re-inspection labor, lost machine capacity, engineering investigation time, expedited replacement freight, and the discount applied when a marginal batch gets sold as a downgrade rather than scrapped outright.
Visible — What Finance Typically Reports
Direct material + labor in the defective unit
Hidden — What the Full Analysis Reveals
Re-inspection and sorting labor
Lost machine and line capacity
Engineering investigation time
Expedited freight to replace scrapped units
Discounted sale of downgraded product
Published benchmarks put visible scrap and rework at roughly 1.4% to 2.2% of revenue for the average manufacturer — but the fully loaded cost of poor quality, once every hidden component is added, commonly reaches 10% to 20% of revenue for plants that haven't done this analysis before.
First-Time-Through Rate
Why Scrap Rate Alone Hides the Real Quality Picture
A plant proud of a 2% scrap rate can still be losing far more to quality than the number suggests, because scrap rate alone ignores rework entirely. First-time-through (FTT) — the percentage of units that complete production with no defect and no rework — captures both failure modes in a single metric, and the gap between what a scrap rate implies and what FTT reveals is often the first genuine surprise in a scrap reduction program.
2%
Scrap Rate
The number most plants track and report upward
+
15%
Hidden Rework Rate
Units that pass eventually, but only after being touched twice
=
83%
Actual First-Time-Through
The real measure of how often the process works right the first time
Find Out What Your FTT Rate Actually Is
iFactory Traces Every Reworked Unit Back to Its Root Cause
Instead of a monthly scrap total pulled from a material write-off report, iFactory tracks every unit that gets touched twice, tags it to a specific cause, and rolls it into a true first-time-through rate by line and shift.
The PAF Framework
Prevention, Appraisal, and Failure — Where the Money Is Actually Going
The standard cost-of-quality framework splits spending into four categories. Most plants unconsciously overweight the two most expensive ones — appraisal and internal failure — while underinvesting in the one category proven to reduce total cost the most: prevention.
Prevention
Training, Preventive Maintenance, Process Control
Spending here reduces defects before they occur. Consistently the highest-return category, yet usually the smallest line item in the quality budget.
Appraisal
Inspection, Testing, In-Process Checks
Catches defects before they leave the plant, but doesn't reduce how many occur — it only controls where they're caught.
Internal Failure
Scrap, Rework, Re-Inspection
The direct cost of defects caught before shipment. Usually the largest visible category and the first place plants look.
External Failure
Warranty, Returns, Field Complaints
The most expensive category per incident once customer relationship damage and lost future orders are counted, but frequently the least tracked.
Root Cause Categories
Where Scrap and Rework Actually Come From
Reducing scrap starts with correctly attributing each defect to its actual source rather than defaulting to "operator error" — the easiest explanation and, in most root cause analyses, one of the least common genuine causes.
| Root Cause Category | Typical Share of Defects | Primary Fix |
|---|
| Process / Parameter Drift | 30-40% | Statistical process control, real-time monitoring |
| Incoming Material Variation | 15-25% | Supplier quality agreements, incoming inspection |
| Equipment / Tooling Wear | 15-20% | Condition-based maintenance, tooling replacement schedule |
| Operator Error | 10-15% | Training, poka-yoke error-proofing, standard work |
| Design / Specification Gap | 10-15% | Design for manufacturability review, tolerance analysis |
The consistent finding across root cause studies: process drift and incoming material variation together account for the largest share of defects in most discrete manufacturing environments — categories that respond to monitoring and prevention, not to blaming the operator on the line.
Reduction Roadmap
Shifting Spend From Failure to Prevention Over 12 Months
Months 1-2
Baseline and True Cost
Establish an honest, machine-measured FTT baseline and calculate the fully loaded cost of poor quality across all four PAF categories.
Months 3-5
Root Cause by Category
Attribute the top defect types to their actual root cause category rather than defaulting to operator error, using real-time process data.
Months 6-9
Prevention Investment
Shift budget toward the highest-leverage prevention fixes identified in root cause analysis — typically process control and maintenance first.
Months 10-12
Sustain and Re-Baseline
Re-measure FTT against the original baseline, targeting the 30-50% reduction typically achievable in a first-year program, and lock in gains with standard work updates.
Every scrap reduction program I've run starts the same way — someone in the room is certain the number they've been reporting is close to the real cost, and they're always wrong, always low. The material write-off is the easiest number to pull from an ERP system, so it's the one that gets reported, but it's rarely more than a third of the actual damage once you count the machine time, the re-inspection, and the engineering hours spent chasing the same recurring defect quarter after quarter. The second consistent surprise is where the root cause actually sits. Plants walk in assuming it's mostly operator error, and it almost never is — process drift and incoming material variation dominate in nearly every root cause study I've run, and both of those point toward monitoring investment, not a training program.
Desmond Vaccaro-Ihejirika
Quality Systems Director · Six Sigma Master Black Belt · 20 years leading scrap and cost-of-quality reduction programs across automotive and industrial manufacturing
Quality Team Questions
Scrap and Rework Reduction — Frequently Asked
Why does the visible scrap cost understate the true cost so consistently?
Visible scrap cost, typically pulled from an ERP material write-off report, only captures the material and direct labor embedded in the defective unit itself. It excludes the labor spent sorting and re-inspecting output to find the defect, the machine and line capacity consumed producing a unit that never shipped, the engineering time spent investigating a recurring problem, and any expedited freight needed to replace the lost production on schedule. Once all of these are added, published research and field audits consistently find the real cost lands at three to five times the visible figure, and sometimes considerably higher in plants that haven't done a full cost-of-quality analysis before.
How is first-time-through rate different from a standard scrap rate?
Scrap rate only counts units that were discarded entirely, missing every unit that passed only after being reworked — touched a second time to fix a defect before it could ship. First-time-through rate counts both, giving a more complete picture of process capability: a line reporting a modest 2% scrap rate can still have a substantial hidden rework rate, producing an actual first-time-through figure well below what the scrap number alone implies. Tracking FTT instead of scrap rate alone is usually the fastest way to reveal how much quality cost has been hiding in the rework queue rather than the scrap bin.
Should we spend more on final inspection to catch more defects before shipment?
More inspection catches more defects before they reach the customer, which matters, but it does nothing to reduce how many defects occur in the first place — it only shifts where they're caught, at an ongoing appraisal cost that recurs indefinitely. Prevention spending, by contrast, reduces the defect rate itself, which lowers appraisal cost, internal failure cost, and external failure cost simultaneously. The strongest reduction programs shift budget toward prevention over time rather than permanently scaling up inspection headcount to compensate for a process that keeps generating the same defects.
Is operator error really as small a factor as root cause studies suggest?
In most root cause analyses across discrete manufacturing, operator error accounts for a meaningful but secondary share of total defects, typically well behind process parameter drift and incoming material variation combined. This doesn't mean operator error never matters — it does, and training and error-proofing remain part of a complete program — but defaulting to it as the primary explanation, without measuring the actual distribution, tends to direct improvement resources toward training programs when the bigger opportunity sits in process monitoring or supplier quality.
Contact our support team for guidance on structuring a root cause study specific to your defect types.
What reduction in scrap and rework is realistic in the first year of a structured program?
Plants running a structured, prevention-focused reduction program against an honest, machine-measured baseline typically achieve a 30% to 50% reduction in scrap and rework cost within the first 12 months, with the fastest gains usually coming from the top two or three root cause categories identified in the baseline analysis. The size of the achievable reduction depends heavily on how far the current process sits from its capability ceiling — a process with significant uncontrolled drift has more room to improve quickly than one already running close to its statistical limits.
Book a demo to see a realistic reduction estimate built from your own defect data.
Stop Measuring Only the Visible Third of the Problem
Get the Full Cost of Poor Quality Quantified and Traced to Root Cause
iFactory calculates your fully loaded scrap and rework cost, tracks true first-time-through rate by line and shift, and attributes defects to their real root cause category — turning an annual write-off number into a prioritized, prevention-focused reduction plan.