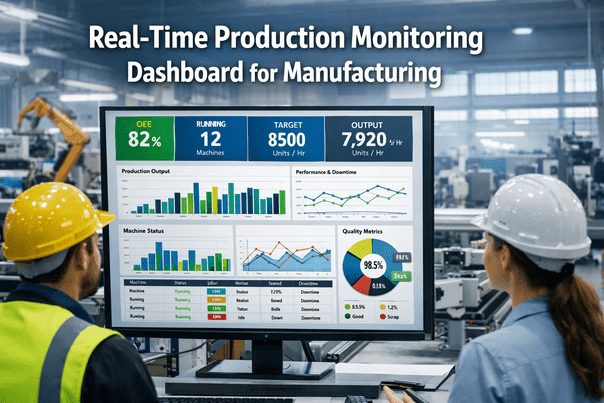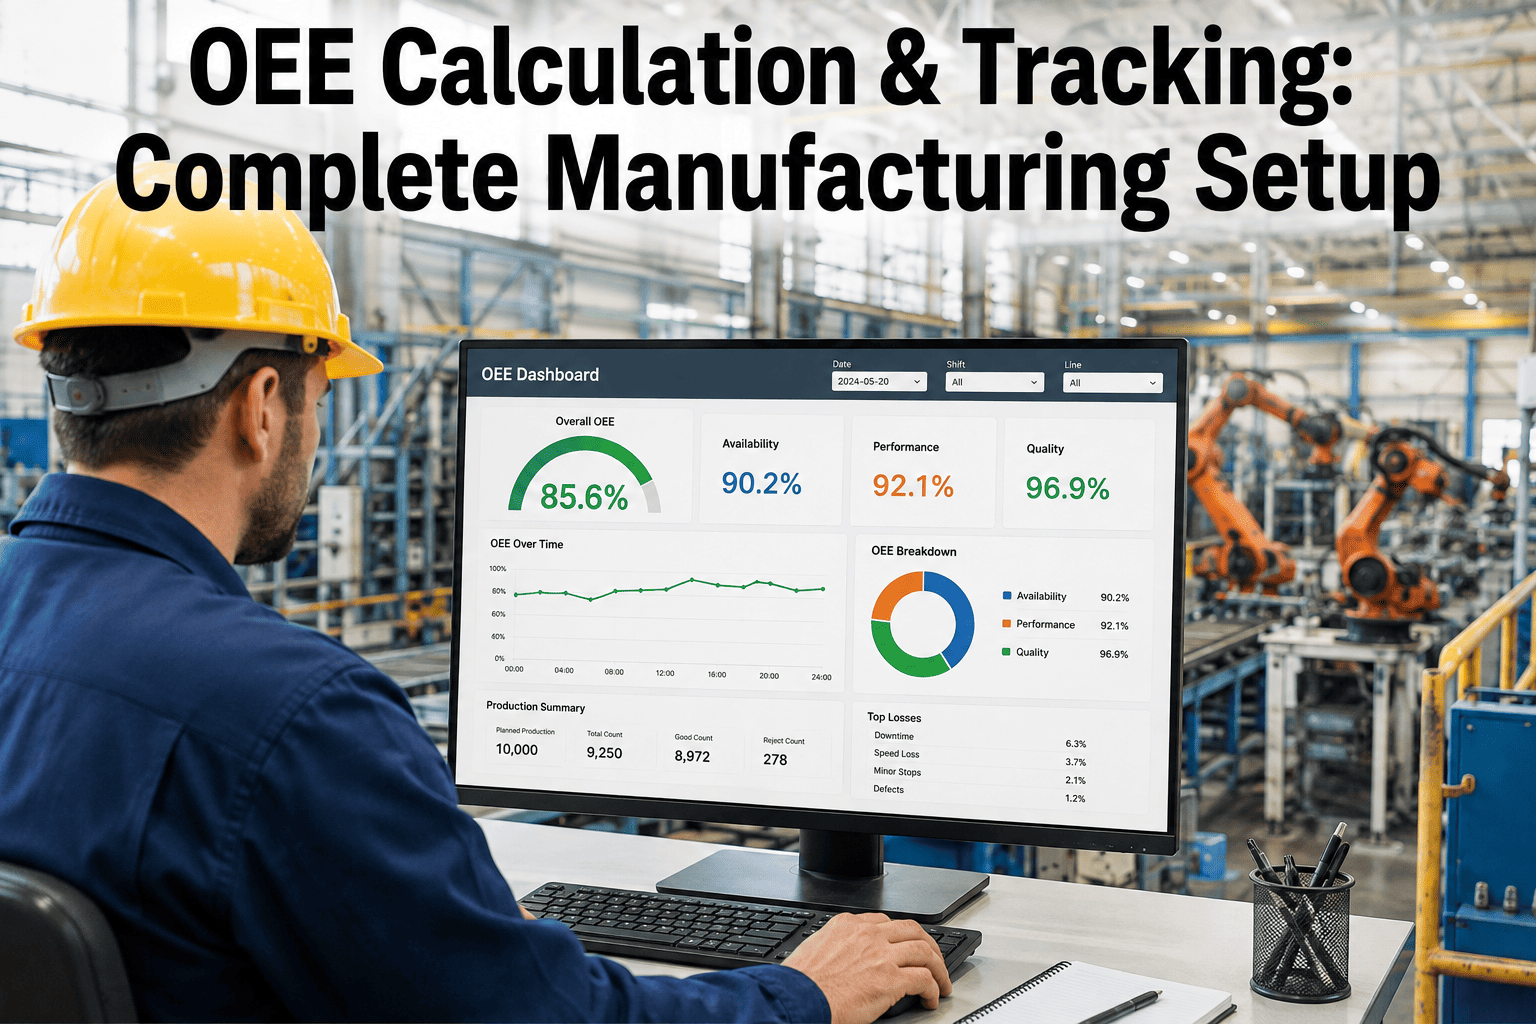
Ask five plant managers what their OEE is and you'll often get five numbers calculated five different ways — some counting planned breaks in the denominator, some rounding micro-stops under five minutes because nobody logged them, some blending three shifts into one average that hides which shift is actually losing the capacity. The formula itself is simple math. The reason most plants still can't trust their own number isn't the calculation, it's the data collection underneath it. This page walks through how to set up OEE tracking that actually holds up — the right formula, the right data source, and the six loss categories worth chasing — and where you can see automated OEE tracking running against your own line data.
Production Planning · OEE
Set Up OEE Tracking That Actually Matches What's Happening on the Floor
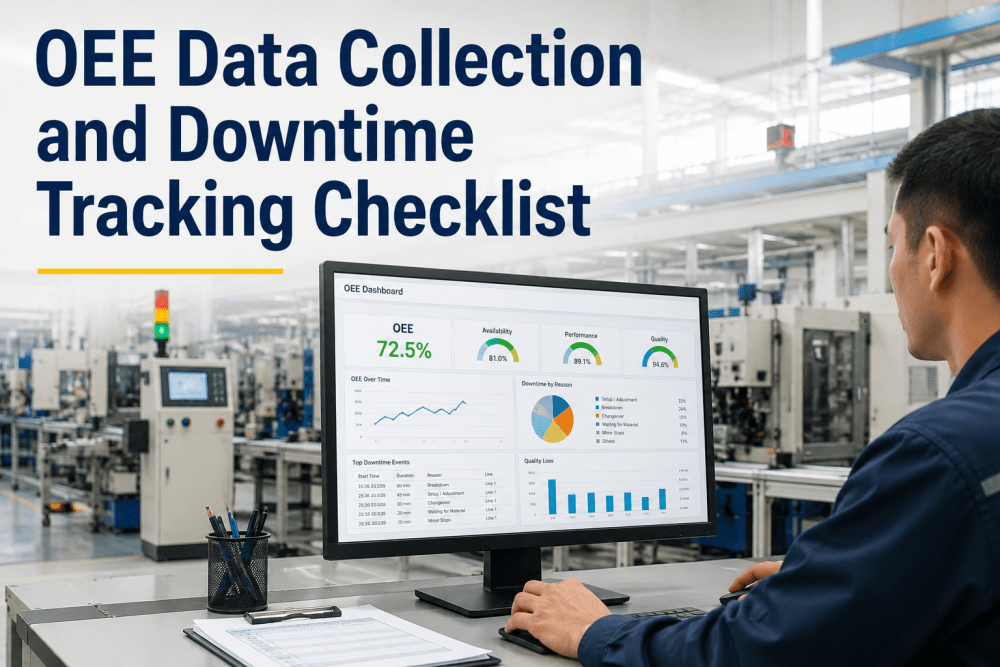
Automated Availability, Performance, and Quality data collection with every loss event categorized in real time — no manual log sheets, no rounded micro-stops, no guessing which shift is losing the capacity.
The Foundation
The Formula Is Simple — Getting Honest Inputs Isn't
OEE is Availability multiplied by Performance multiplied by Quality, and each factor is trivial to calculate once you have accurate inputs. Availability is run time divided by planned production time. Performance is theoretical cycle time multiplied by total count, divided by run time. Quality is good units divided by total units produced. None of that math is the hard part. The hard part is that manual data collection systematically understates losses — operators logging downtime on a clipboard rarely capture stoppages under five minutes, speed loss gets rounded away because nobody's watching a stopwatch against a cycle time sheet, and the resulting OEE number ends up flattering the line by a wide margin. Plants that switch from manual to automated PLC-based capture typically see their reported OEE drop several points in the first month — not because performance got worse, but because the number finally reflects reality.
Data Collection Approach
Three Ways Plants Collect OEE Data — and What Each One Misses
Manual Log Sheets
Operators record stops and counts by hand on paper or a spreadsheet at shift end. Cheapest to start, but understates downtime significantly since micro-stops under five minutes rarely get written down at all.
Semi-Automated Entry
A tablet or HMI prompts operators to log a stop reason when the line halts. Better than paper, but still depends on someone noticing and categorizing every event in real time under production pressure.
Automated PLC Data Capture
Fault signals, encoder speed data, and production counters are read directly from the equipment in real time. Every stop, no matter how short, is timestamped and categorized without relying on a human to catch it.
The Six Big Losses
Every OEE Point Lost Traces Back to One of Six Causes
Availability
Equipment Breakdowns
Unplanned stops from mechanical or electrical failure. Usually the single most expensive loss category since the line is fully stopped, not just slowed.
Availability
Setup and Changeover Time
Time lost switching between products or reconfiguring a line between runs, often the largest recoverable loss on lines running frequent product mix changes.
Performance
Idling and Minor Stops
Brief stoppages under ten minutes — jams, sensor faults, material gaps. Individually invisible, but the cumulative total is frequently the largest hidden loss on the line.
Performance
Reduced Speed
Equipment running below its rated cycle time due to wear, operator caution, or habit built up over years of running "safe" rather than at true rated speed.
Quality
Startup and Yield Loss
Defective parts produced while the process stabilizes after a startup or changeover, before it reaches full specification consistency.
Quality
Process Defects and Rework
Scrap and rework generated during steady-state running, distinct from startup loss and usually traceable to a specific process parameter drifting out of range.
Getting Live
Five Steps to Set Up Automated OEE Tracking
1
Define Planned Production Time
Confirm exactly which time counts as planned production versus scheduled breaks or maintenance windows, since this denominator decision alone can shift a reported OEE by several points.
2
Connect to PLC Signals and Counters
Tap into existing fault signals, encoder speed data, and production counters rather than adding new sensors where the equipment is already reporting the data you need.
3
Set Theoretical Cycle Time Per Product
Performance calculations depend on an accurate rated cycle time for each product run on the line, so this needs validating against engineering specs, not assumed from historical averages.
4
Categorize Every Stop Automatically
Every downtime event gets mapped to one of the six loss categories the moment it happens, building a live Pareto instead of a manually reconstructed report at week's end.
5
Put the Dashboard in Front of the Line
A live OEE number visible on the floor, not buried in a weekly report, is what actually drives operators and supervisors to react to a developing loss in real time.
See the Gap in Your Own Numbers
Compare Your Manual OEE Against What Automated Tracking Actually Shows
iFactory reads PLC fault signals, speed data, and counters directly from your equipment and shows you exactly how much downtime your current manual tracking is missing.
Where You Actually Stand
2026 OEE Benchmarks by Manufacturing Sector
| Sector | Typical Range | Top Quartile |
|---|---|---|
| Discrete manufacturing | 65% – 75% | 78% and above |
| Automotive Tier 1 | 75% – 85% | 88% and above |
| Pharmaceutical (GMP) | 62% – 72% | 76% and above |
| Paper and packaging | 78% – 86% | 89% and above |
| Semiconductor back-end | 76% – 84% | 87% and above |
Applied Example
What Changed When Manual Tracking Went Automated
A Tier 1 automotive supplier had reported OEE hovering around 68 percent for years using shift-end manual log sheets, and the number rarely moved despite repeated improvement pushes. After connecting the line's existing PLC fault signals and encoder data to an automated tracking system, the first month's reported OEE actually dropped to 54 percent — not because the line got worse, but because minor stops and speed loss that manual logging had never captured were now visible for the first time. With the six loss categories ranked by actual lost time instead of anecdote, the plant focused first on minor stops, which turned out to be the single largest category, cumulatively larger than the breakdowns everyone had assumed were the main problem. Within four months of targeted fixes on that one category, OEE climbed past the original 68 percent baseline and kept climbing, this time on numbers the team could actually defend in a capital planning meeting.
"
Almost every plant I've walked into thinks their biggest loss is breakdowns, because a breakdown is dramatic and everyone remembers it. Then we connect real data capture and minor stops turn out to be double the lost time, just spread across two hundred invisible five-minute gaps a shift. You can't fix what you can't see, and a clipboard genuinely cannot see a four-minute jam.
Daniel Osei
Manufacturing Analytics Consultant · 13 years implementing OEE and MES systems across automotive and food manufacturing
Common Setup Errors
Four Mistakes That Quietly Corrupt an OEE Number
Inconsistent Planned Production Time
Different shifts or lines defining planned time differently makes cross-line comparisons meaningless, even when each individual number looks internally consistent.
Outdated Theoretical Cycle Times
Using an old rated cycle time after an equipment upgrade or process change silently distorts every Performance calculation that follows.
Blending Shifts Into One Average
A single daily OEE number hides which shift is actually driving the loss, making it impossible to target the right team or root cause.
No Owner for Loss Categorization
Automated capture still needs someone reviewing and validating the loss category tags periodically, or misclassified events quietly skew the Pareto over time.
OEE Setup Questions
Frequently Asked
What is the correct formula for calculating OEE?
OEE is calculated as Availability multiplied by Performance multiplied by Quality. Availability is run time divided by planned production time, Performance is theoretical cycle time multiplied by total count divided by run time, and Quality is good units divided by total units produced. Each factor is expressed as a percentage before multiplying, and the calculation is standardized under ISO 22400-2. Book a demo to see this calculated automatically against live line data.
Why does manual OEE tracking show a higher number than automated tracking?
Manual log sheets depend on an operator noticing, remembering, and writing down every stoppage, and short stops under five minutes are the ones most likely to be missed entirely during a busy shift. Automated PLC-based capture timestamps every stop regardless of duration, which is why plants switching methods often see their reported OEE drop several points in the first month even though nothing on the floor actually changed. Talk to support about connecting your existing PLC data.
What is a good OEE score for a manufacturing plant?
World-class OEE is widely cited as 85 percent, though the realistic range varies by sector — discrete manufacturing typically runs 65 to 75 percent, automotive Tier 1 suppliers run 75 to 85 percent, and pharmaceutical GMP environments often run lower at 62 to 72 percent due to stricter quality and changeover requirements. The more useful comparison is against your own historical baseline rather than a single universal number. Book a call to benchmark your current OEE against your sector.
How long does it take to set up automated OEE tracking on a line?
A single line can often start producing real-time OEE data within days once existing PLC fault signals and counters are connected, since most equipment is already generating this data internally without needing new sensors. Full rollout across multiple lines and shifts, including validating theoretical cycle times and setting up dashboards, typically takes a few weeks depending on how many product variants need cycle time mapping. Contact our team to scope a timeline for your specific line count.
Which of the Six Big Losses should I fix first?
The right answer depends entirely on which loss category is actually costing you the most time, which is only knowable once you have accurate, automatically categorized loss data rather than assumption or anecdote. Minor stops are the most commonly underestimated category since each individual event feels too small to matter, but the cumulative total across a shift is frequently larger than dramatic, memorable breakdowns. Book a scoping session to see your own loss category ranking.
Stop Guessing at Your Real OEE
Get Availability, Performance, and Quality Tracked Automatically, Line by Line
iFactory reads PLC fault signals, speed data, and counters in real time, categorizes every loss into the Six Big Losses, and puts a live dashboard in front of the people who can actually act on it.