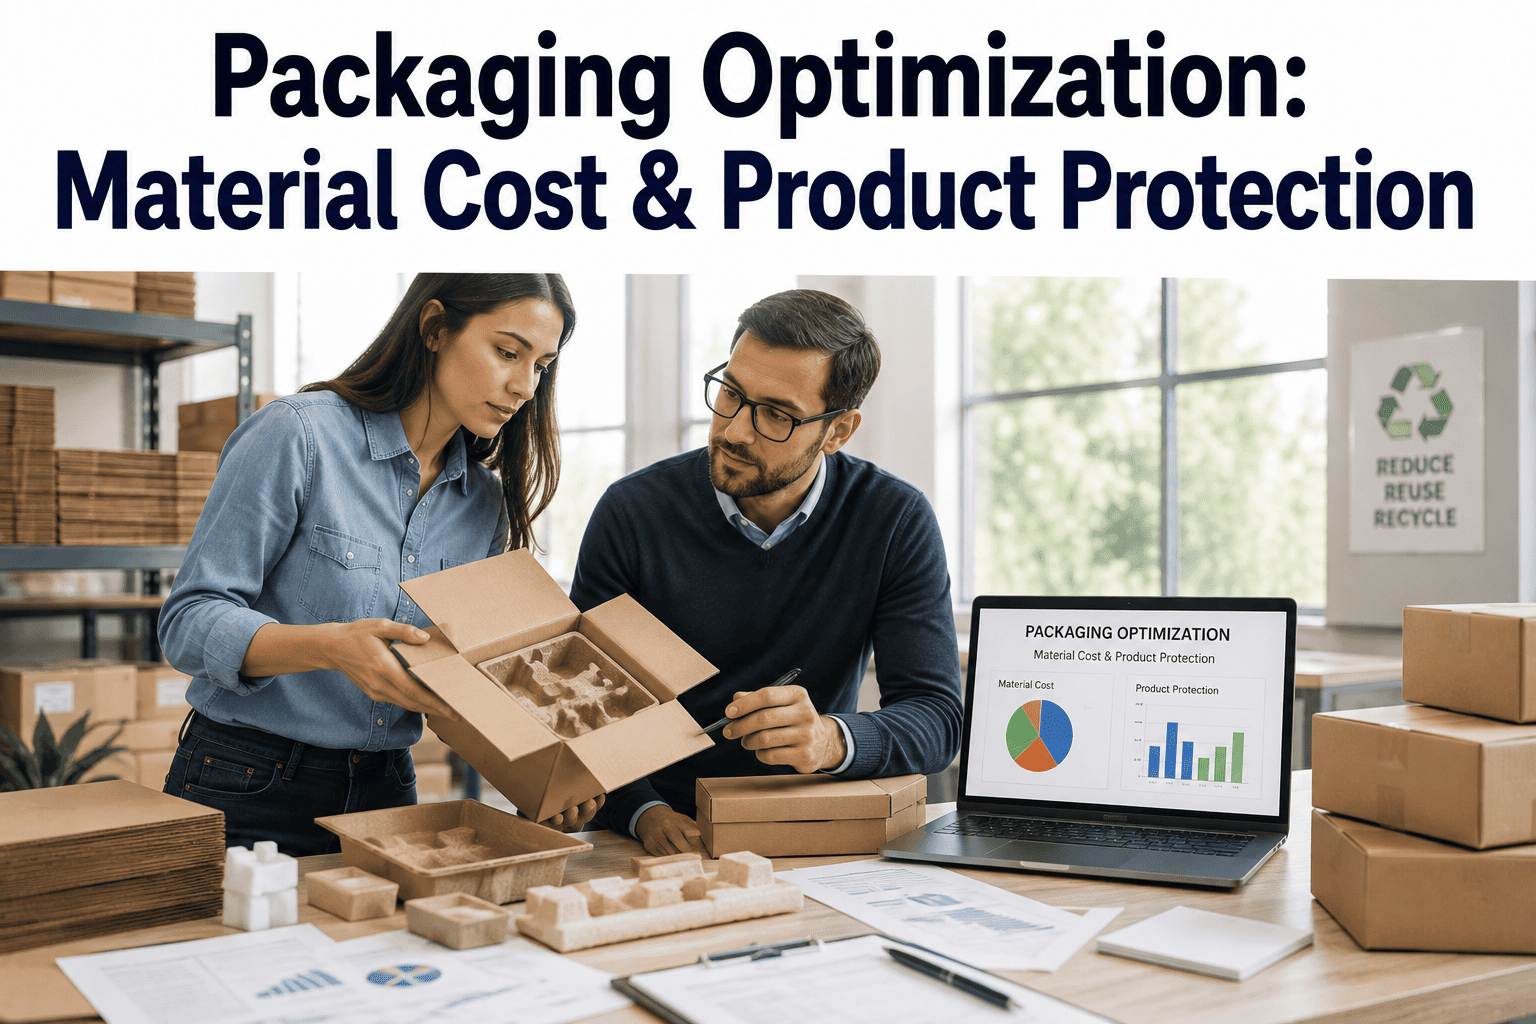
Manufacturers waste an estimated 150 billion dollars a year on inefficient packaging, and almost none of that waste shows up as a single obvious line item — it hides inside oversized boxes, void fill nobody measured against actual damage rates, and a material specification that was set once years ago and never revisited as products or shipping lanes changed. The manufacturers who close this gap are not the ones spending more on packaging, they are the ones who treat packaging as an engineering problem with a right-sized answer rather than a default nobody questions. Our packaging optimization team can review your current specifications against the same audit framework described below.
Cut Packaging Cost Without Cutting Product Protection
Right-sizing, material selection, and dimensional optimization that lower material and freight cost together, backed by damage-rate data instead of a guess about how much cushioning is enough.
Why Packaging Cost Overruns Follow the Same Predictable Pattern
Packaging specifications tend to get set once, during initial product launch, under time pressure, with a wide safety margin built in because nobody wants to be the person whose packaging choice caused a damage claim. That safety margin rarely gets revisited afterward, even as real damage-rate data accumulates showing the product is over-protected, over-boxed, or shipped in a container sized for a product variant that no longer exists. The result is a slow accumulation of unnecessary material cost, wasted cube space on trucks, and freight spend that scales with box dimensions rather than actual product volume.
The five most common root causes are consistent across industries: overspecification of protective material relative to actual fragility, lack of supplier consolidation driving inconsistent material choices across product lines, ignoring dimensional weight in favor of a single standard box size, treating sustainability improvements as a cost rather than a design lever, and inventory management practices that let obsolete packaging stock accumulate rather than being phased out on schedule.
The Three Layers of Packaging, and Where Each One Wastes Money
An optimization audit examines primary, secondary, and tertiary packaging separately, because each layer has a different function and a different cost driver, and treating them as one undifferentiated packaging budget makes it hard to tell which layer is actually generating the waste.
Auditing all three layers together, rather than optimizing one in isolation, matters because a change in one layer often shifts the requirements in another. Reducing primary packaging cushioning, for example, can increase the protective load the secondary box needs to absorb, and a smaller secondary box changes how efficiently units stack on a pallet at the tertiary layer. Teams that optimize a single layer without checking the downstream effect on the others sometimes find that a saving in one place quietly creates a new cost or damage risk in another, which is why a coordinated audit across all three layers, even if the changes are implemented in phases, tends to produce a more durable result than a series of disconnected single-layer projects.
Before and After: What a Right-Sizing Project Actually Looks Like
The clearest way to see the value of an optimization pass is to compare a typical unoptimized specification against the same product after a structured right-sizing and material review.
| Specification Area | Before Optimization | After Optimization |
|---|---|---|
| Box dimensions | Standard size covering the largest product variant | Sized per variant, reducing void fill and dimensional weight |
| Cushioning material | Fixed thickness applied uniformly regardless of fragility | Matched to actual fragility rating and transit damage data |
| Material type | Single heavier-grade substrate used across all product lines | Substrate selected per product weight and handling profile |
| Pallet configuration | Standard stacking pattern with unused vertical space | Optimized stacking pattern maximizing usable cube per pallet |
The gap between these two states rarely closes in a single project phase. Most teams find it more practical to sequence the work, starting with the highest-volume products where the dimensional and material changes are easiest to validate quickly, then extending the same methodology to lower-volume product lines once the process and testing protocol have been proven out. This sequencing also builds internal confidence in the approach, since early wins on high-volume products create a track record that makes it easier to get sign-off on further changes across the rest of the catalog, rather than asking leadership to approve a company-wide packaging overhaul before any results have been demonstrated.
Sustainability and Cost Are Usually the Same Lever
Sustainability improvements in packaging are often framed as a tradeoff against cost, but in practice, the same design changes that reduce material usage — lightweighting, right-sizing, substrate substitution — tend to reduce both environmental footprint and material spend at the same time, since less material used generally means less material purchased and less weight shipped.
It is worth being explicit about the exception to this pattern, since not every sustainability initiative reduces cost automatically. Some substrate substitutions, particularly newer bio-based or compostable materials, currently carry a price premium over conventional plastics or standard corrugate, even though they reduce environmental impact. In those cases, the business justification shifts from a pure cost-reduction argument to one that weighs the premium against brand positioning, customer expectations in a given market, and any regulatory requirements around recyclability that may apply to specific product categories or regions. Being clear about which sustainability levers pay for themselves through material reduction and which carry a genuine premium helps a packaging team build an honest, defensible business case rather than overpromising savings that a particular material choice will not actually deliver.
Automation and Real-Time Monitoring in Packaging Operations
Beyond the specification itself, how packaging is applied on the line has its own cost impact. Automated packaging systems that apply material with precise, repeatable application reduce both labor cost and material waste from over-application, while real-time monitoring of damage rates and material consumption gives the optimization team live data to validate whether a specification change is actually holding up in production rather than waiting for a quarterly review to find out.
The value of real-time monitoring compounds over time in a way a one-time audit cannot match, because packaging performance is not static. Product mixes shift, carriers change their rate structures, and material suppliers periodically adjust the specifications of the substrates being purchased, all of which can quietly erode the benefit of a specification that was optimal when it was set. A monitoring layer that tracks damage rate, material consumption, and freight cost per shipment on an ongoing basis catches this drift early, giving the packaging team a chance to make a small correction before the gap between optimal and actual specification grows large enough to require another full audit cycle to fix.
Common Packaging Mistakes and Their Direct Fix
A handful of recurring mistakes account for most of the avoidable packaging cost across manufacturers, and each one has a specific, well-understood fix once it is identified.
| Common Mistake | Why It Happens | Direct Fix |
|---|---|---|
| One box size for all variants | Simplifies purchasing and inventory of packaging stock | Right-size per variant using a small set of standardized sizes |
| Cushioning set once, never revisited | No feedback loop between damage data and specification owners | Quarterly review of damage rate against current cushioning spec |
| Ignoring dimensional weight | Freight cost historically tracked by weight, not cube | Model total landed freight cost per shipment, not per pound |
| Obsolete packaging stock retained | No formal phase-out process tied to product lifecycle | Link packaging inventory review to product lifecycle milestones |
Frequently Asked Questions
Turn Your Packaging Spec Into a Right-Sized, Data-Backed Design
Share your current packaging specifications and damage rate data and we will show you where material, freight, and labor savings are available without compromising product protection.