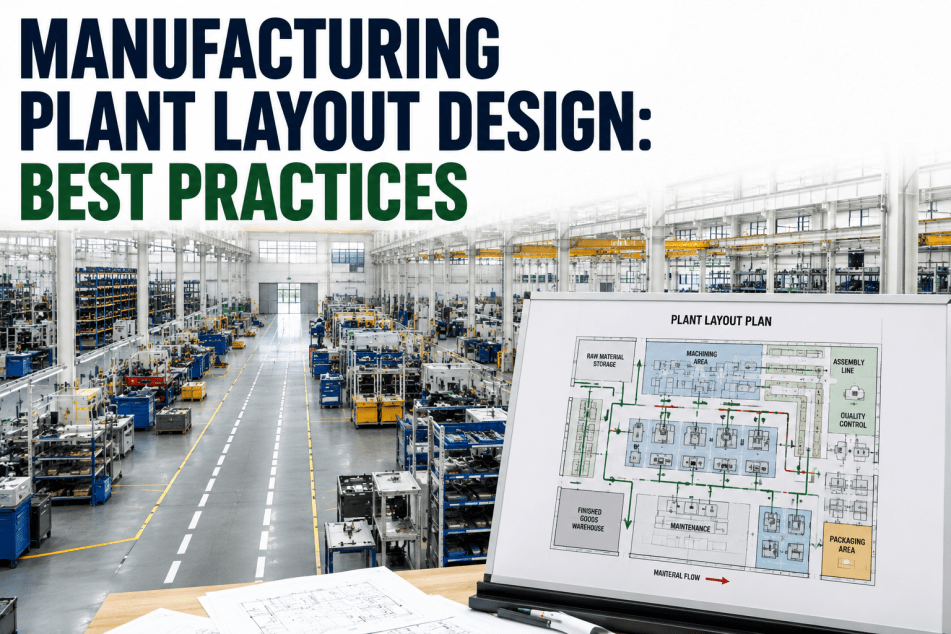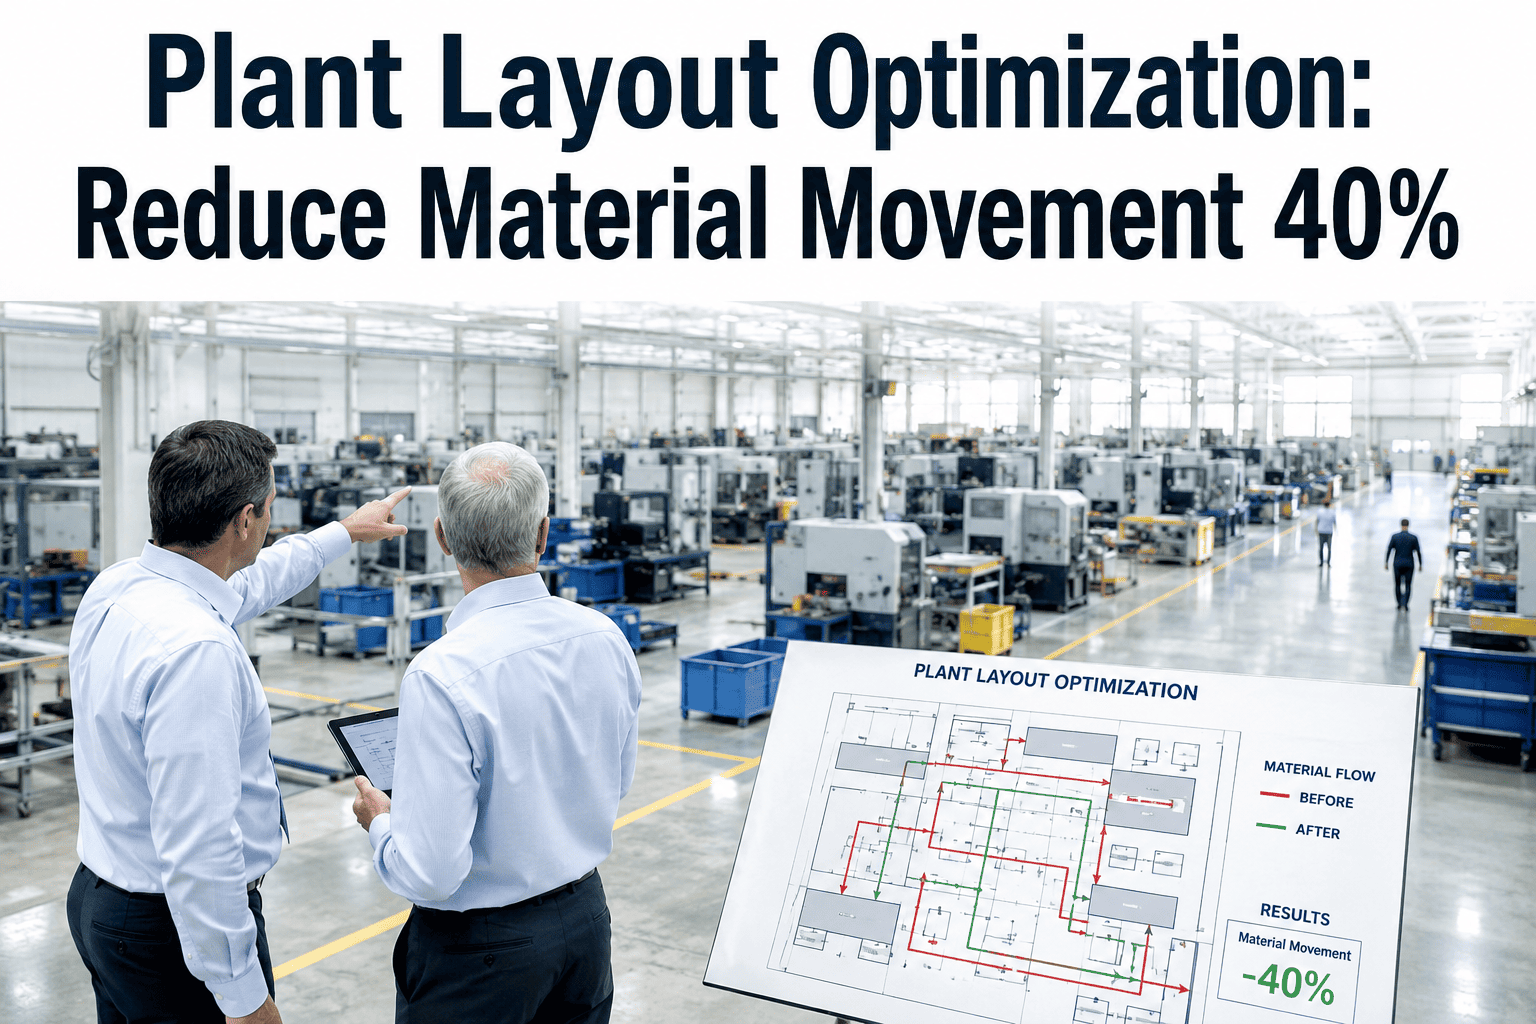
Most manufacturing plants were not designed from scratch. They grew one machine at a time, one product line added on top of another, until the floor plan became a patchwork of convenience rather than a system built for flow. The result is material traveling back and forth across the facility, operators walking distances that add up to miles per shift, and bottlenecks that everyone learns to work around instead of eliminating. Systematic layout optimization reverses that pattern by treating material movement as a measurable cost and redesigning the plant around the path work actually takes, and you can book a demo to see how iFactory maps your current layout digitally.
Your Plant Layout Is Costing You 30-40% More in Material Movement Than Necessary
Every foot of unnecessary travel between workstations is wasted time, wasted labor, and wasted floor space. Systematic layout optimization eliminates that waste by redesigning your plant around how material actually flows rather than where equipment happened to land.
What Poor Layout Actually Costs a Manufacturing Operation Every Single Day
Material handling is one of the largest non-value-adding costs in any plant, yet it is rarely measured as a distinct line item. The figures below represent what operations teams report when they finally map the distances, count the touches, and time the waits that their current layout forces into every production cycle.
How Material Moves Now vs How It Should Move After Layout Optimization
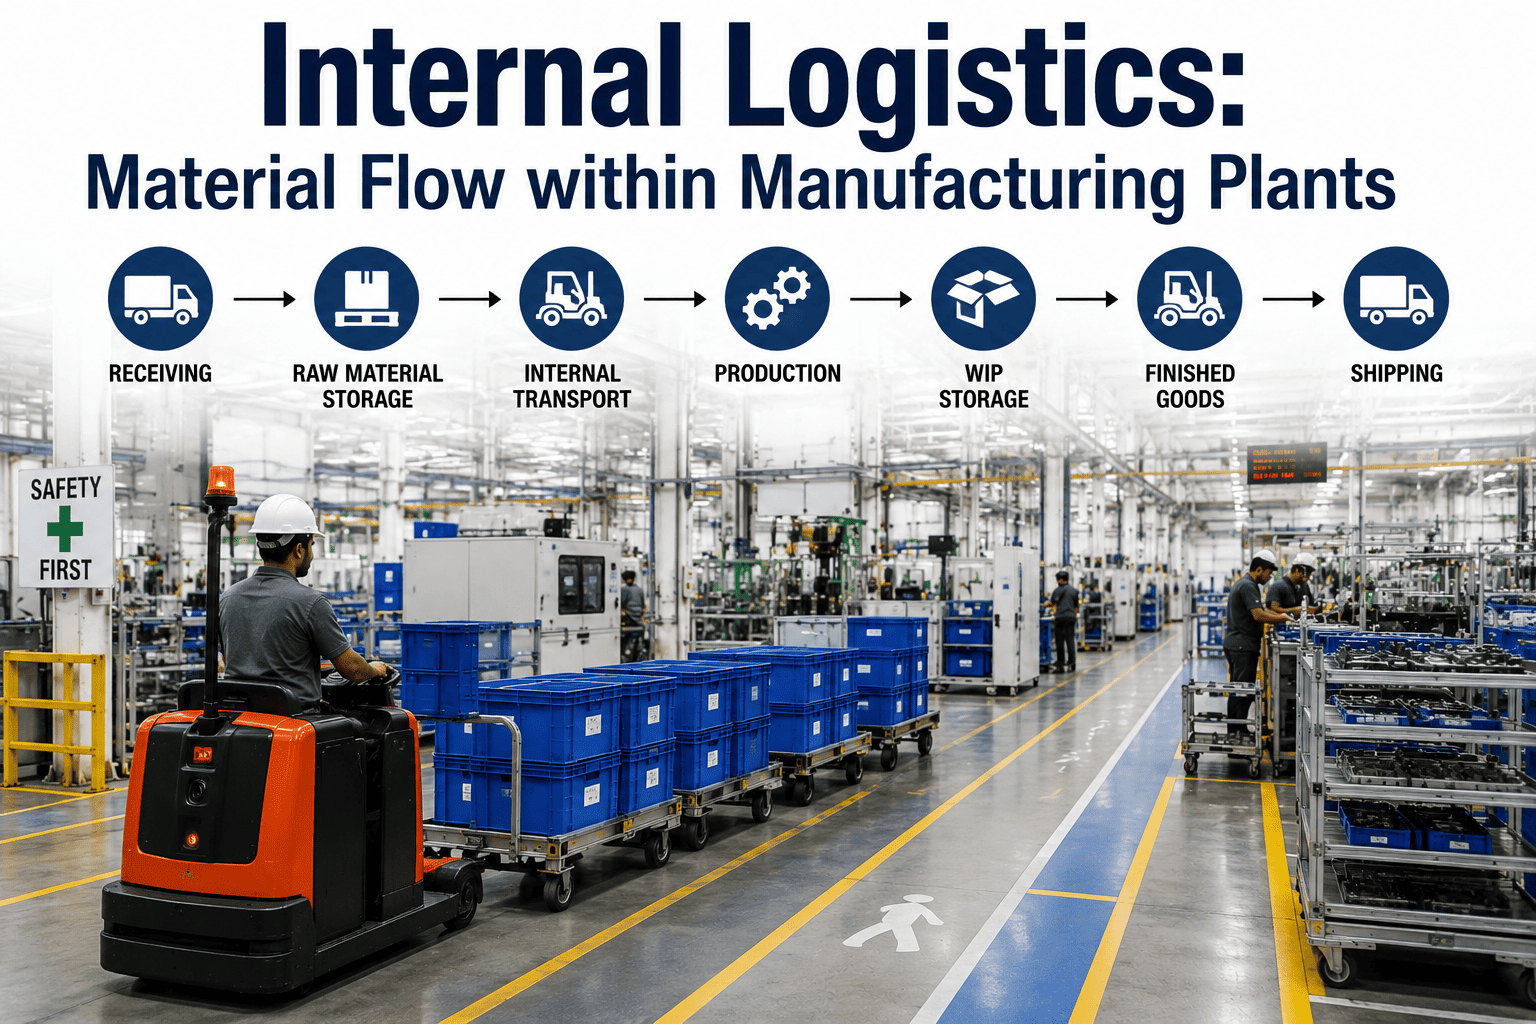
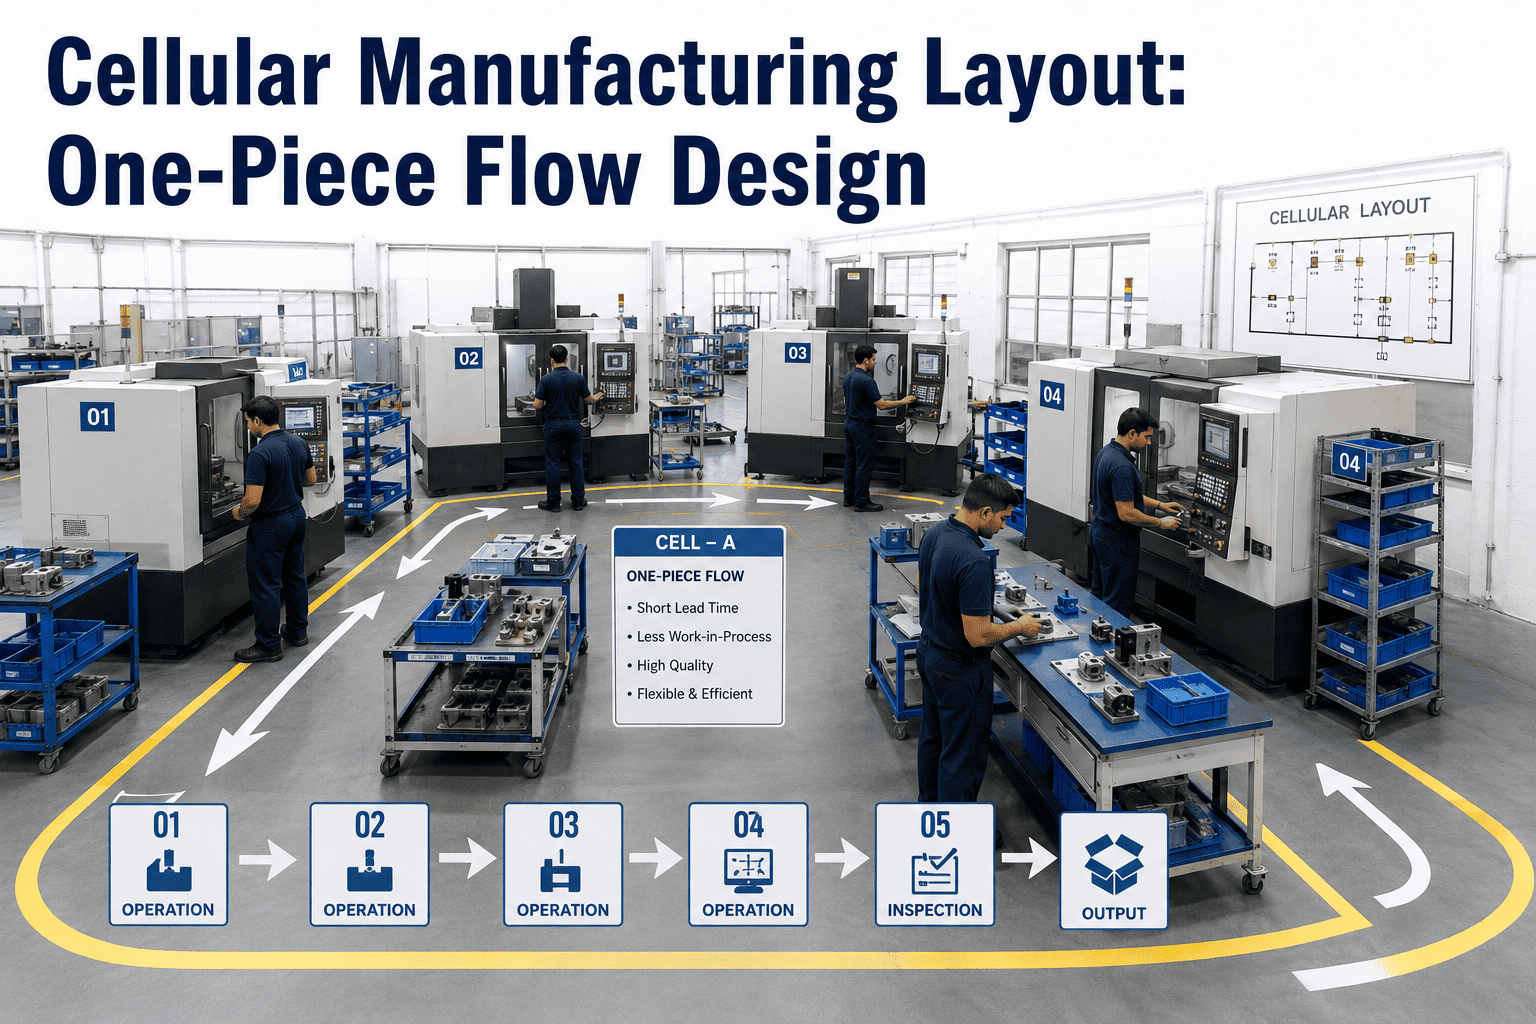
The most revealing exercise in any layout project is mapping the actual path a single part takes from receiving to shipping. In most plants, that path doubles back on itself multiple times, passes through intermediate storage that exists only because stations are too far apart, and crosses traffic lanes that create safety risks and delays.
Five Phases of Systematic Layout Planning That Produce Measurable Results
The Systematic Layout Planning framework remains the most widely used method for plant layout design because it forces the planner to follow data rather than intuition. Each phase builds on the output of the previous one, and skipping a phase almost always results in a layout that looks logical on paper but fails under real operating conditions.
Flow Analysis
Map every material flow path, volume, frequency, and weight between all departments and workstations to establish the quantitative foundation for all layout decisions that follow.
Activity Relationships
Rate the closeness desirability between every pair of activities using a standardized scale that captures non-flow factors like safety, supervision needs, and noise sensitivity.
Space Requirements
Calculate the exact area, shape, and service needs for each activity based on equipment footprint, material buffer sizes, and operator workspace dimensions.
Block Layout
Combine flow data, relationship ratings, and space requirements into a block diagram that shows where each activity should sit relative to every other activity.
Layout Evaluation
Score multiple layout alternatives against weighted criteria including travel distance, flexibility, safety, expansion capacity, and capital cost to select the best option.
Layout Decisions That Create Recurring Bottlenecks and Why They Persist
Most layout problems are not caused by a lack of effort but by a set of predictable decision patterns that feel right in the moment but accumulate into systemic inefficiency over time. The mistakes below appear in nearly every layout audit, often in combination with each other.
Planners keep machines where they sit and arrange everything else around them, which locks in historical accidents as permanent constraints and prevents the flow-based arrangement that would actually reduce travel distance.
Layouts are optimized for today's product mix without considering that new variants, materials, or volumes will demand different flow patterns within months, forcing another costly rework cycle.
Mixed traffic lanes force operators to wait for forklifts and forklifts to slow for pedestrians, which creates unpredictable delays that show up as inconsistent cycle times across every downstream station.
When a plant runs multiple product families but the layout is optimized for the highest-volume item alone, the other products end up with disproportionately long travel paths and higher handling costs.
Centralized raw material and WIP storage may simplify inventory counting but it guarantees that every part makes an extra round trip to and from the point of consumption on every single operation.
See Your Plant Layout Analyzed Against Flow Data in Real Time
iFactory's platform maps your current material flows, calculates the waste, and simulates optimized alternatives before you move a single machine.
What Digital Layout Analysis Delivers That Manual Planning Cannot
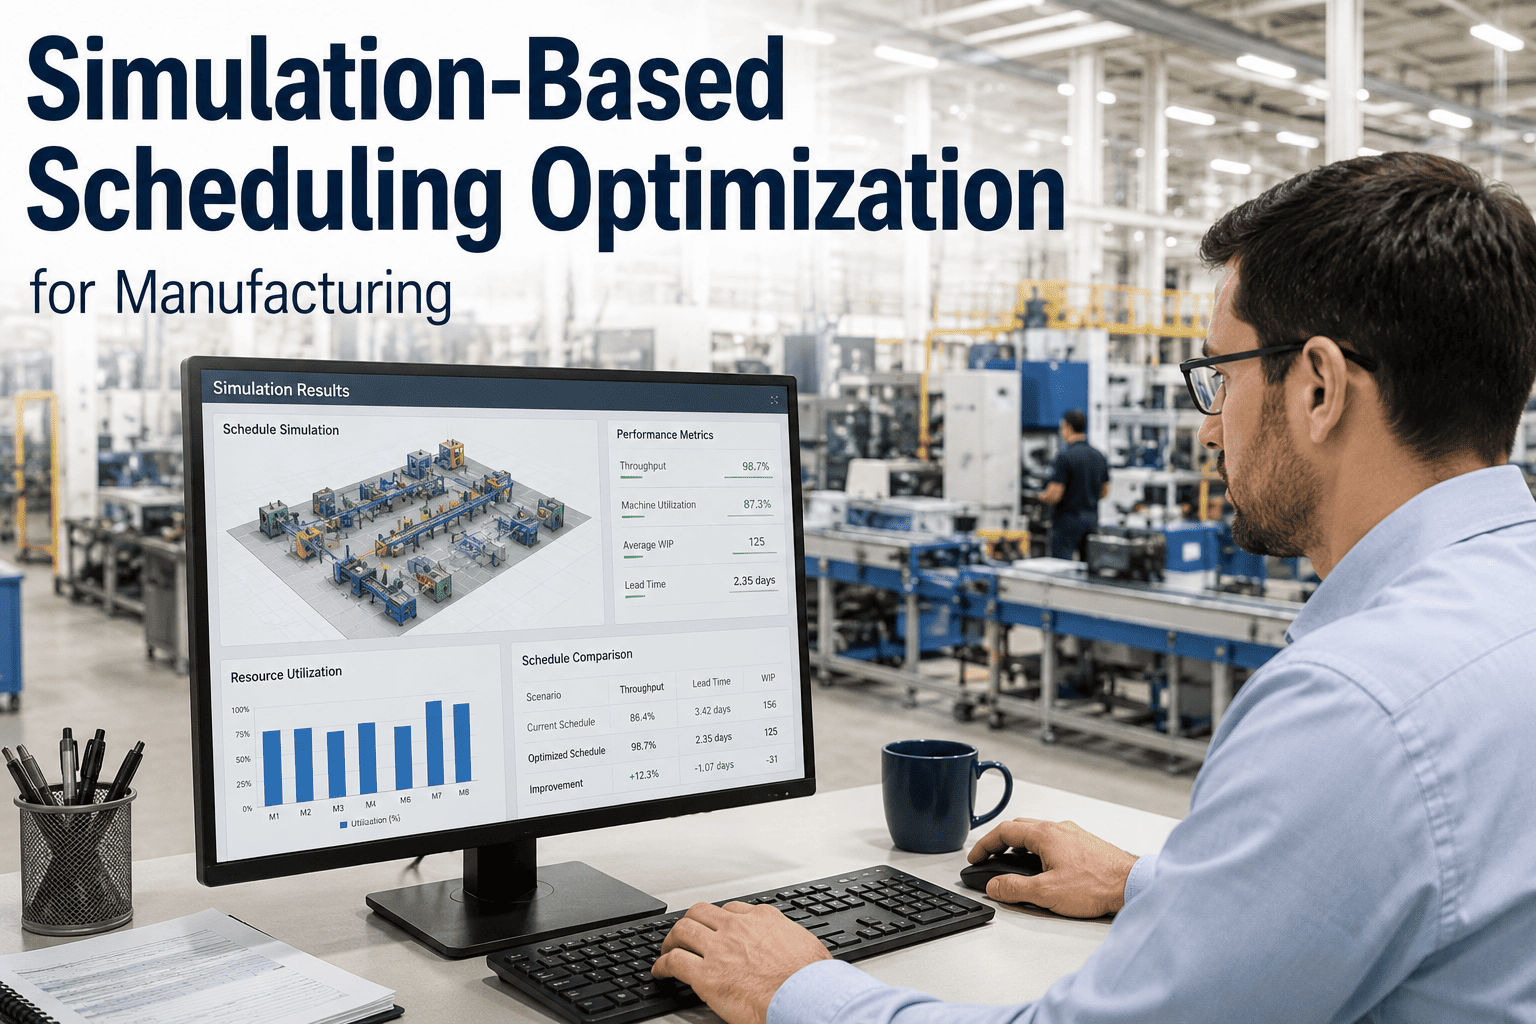
Traditional layout planning relies on 2D drawings, spaghetti diagrams drawn on paper, and subjective judgment about which alternative is better. Digital analysis replaces that process with data-driven flow mapping, distance calculations, and what-if simulation that lets you compare dozens of layout alternatives in the time it used to take to sketch one.
Material flow paths are generated from production routing data, work order history, and station coordinates, producing a complete flow map in minutes rather than the days a manual spaghetti diagram requires.
Every layout alternative is scored on total travel distance, handling steps, and estimated material handling cost so the comparison between options is quantitative rather than based on visual impression alone.
Multiple layout configurations can be tested against the same production data set, including the impact of adding a new product line, changing volumes, or repositioning a single workstation.
Block layouts are generated from the optimized arrangement and displayed in three dimensions so stakeholders can evaluate aisle widths, clearances, and material access before any physical changes begin.
Outcomes Reported From Digital Layout Optimization Projects
The figures below reflect results tracked across manufacturing facilities that used digital flow analysis and simulation to redesign their plant layouts, compared against each facility's own prior baseline measured over multiple production periods before and after the change.
Questions Plant Engineers Ask About Layout Optimization and Digital Flow Analysis
Map Your Material Flows and Find the Waste Before Your Next Layout Change
iFactory's digital layout analysis platform turns your routing data into a flow map, calculates the cost of every unnecessary foot of travel, and simulates optimized alternatives you can evaluate before moving a single machine.