Manufacturing plants carry between 15 and 30 percent of their total maintenance budget in spare parts inventory, yet maintenance managers still regularly encounter situations where a critical part is not available when needed while the storeroom is full of components that have not been requisitioned in years. This paradox exists because most parts inventories were built reactively, adding stock after each shortage event without ever removing parts that became obsolete, without classifying which parts actually deserve shelf space based on equipment criticality, and without calculating reorder points that balance carrying cost against the consequence of a stockout. The result is an inventory that is simultaneously overstocked and underprepared. iFactory analyzes consumption history, equipment criticality rankings, and lead time variability to optimize spare parts classification, set data-driven reorder points, and flag obsolescence before it ties up capital — see the platform at iFactory support.
Predictive Maintenance · MRO Inventory
Spare Parts Optimization: ABC Classification, Criticality Assessment, and Reorder Point Calculation
Stop overstocking non-critical parts while running out of the ones that stop production. Build a data-driven spare parts strategy using ABC classification, equipment criticality, and calculated reorder points.
Total Inventory ValueAbove Target
$2.4M
18 percent above optimized target of $2.03M based on current consumption
Stockout Events This Quarter7 Events
7
5 involved critical or insurance spares with no on-site replacement available
Obsolete Inventory Identified$340K
$340K
Parts with zero requisitions in 36+ months across equipment no longer in service
The Inventory Paradox
Why Most Manufacturing Spare Parts Inventories Are Both Overstocked and Underprepared
The spare parts inventory problem in manufacturing is not that plants carry too much or too little in absolute terms, but that the distribution of inventory across the parts portfolio does not reflect the distribution of risk across the equipment fleet. Parts that protect against high-consequence failures are understocked relative to the downtime cost they prevent, while parts for low-consequence equipment or redundant systems are overstocked because someone once experienced a shortage and added buffer stock that was never re-evaluated. Over years and decades of reactive additions, the inventory loses any connection to a rational stocking strategy and becomes a historical record of every panic purchase the maintenance department has ever made.
$1.8M
Average annual spare parts inventory value for a mid-size discrete manufacturing plant in North America
22%
Of stocked parts have had zero requisitions in the past 36 months but remain in active inventory locations
35%
Of unplanned downtime events attributed to spare parts unavailability involve parts classified as critical by the maintenance team
12%
Annual carrying cost including storage, insurance, depreciation, and opportunity cost on average MRO inventory value
ABC Classification
ABC Classification — Sorting Your Parts Portfolio by Consumption Value Rather Than Unit Price
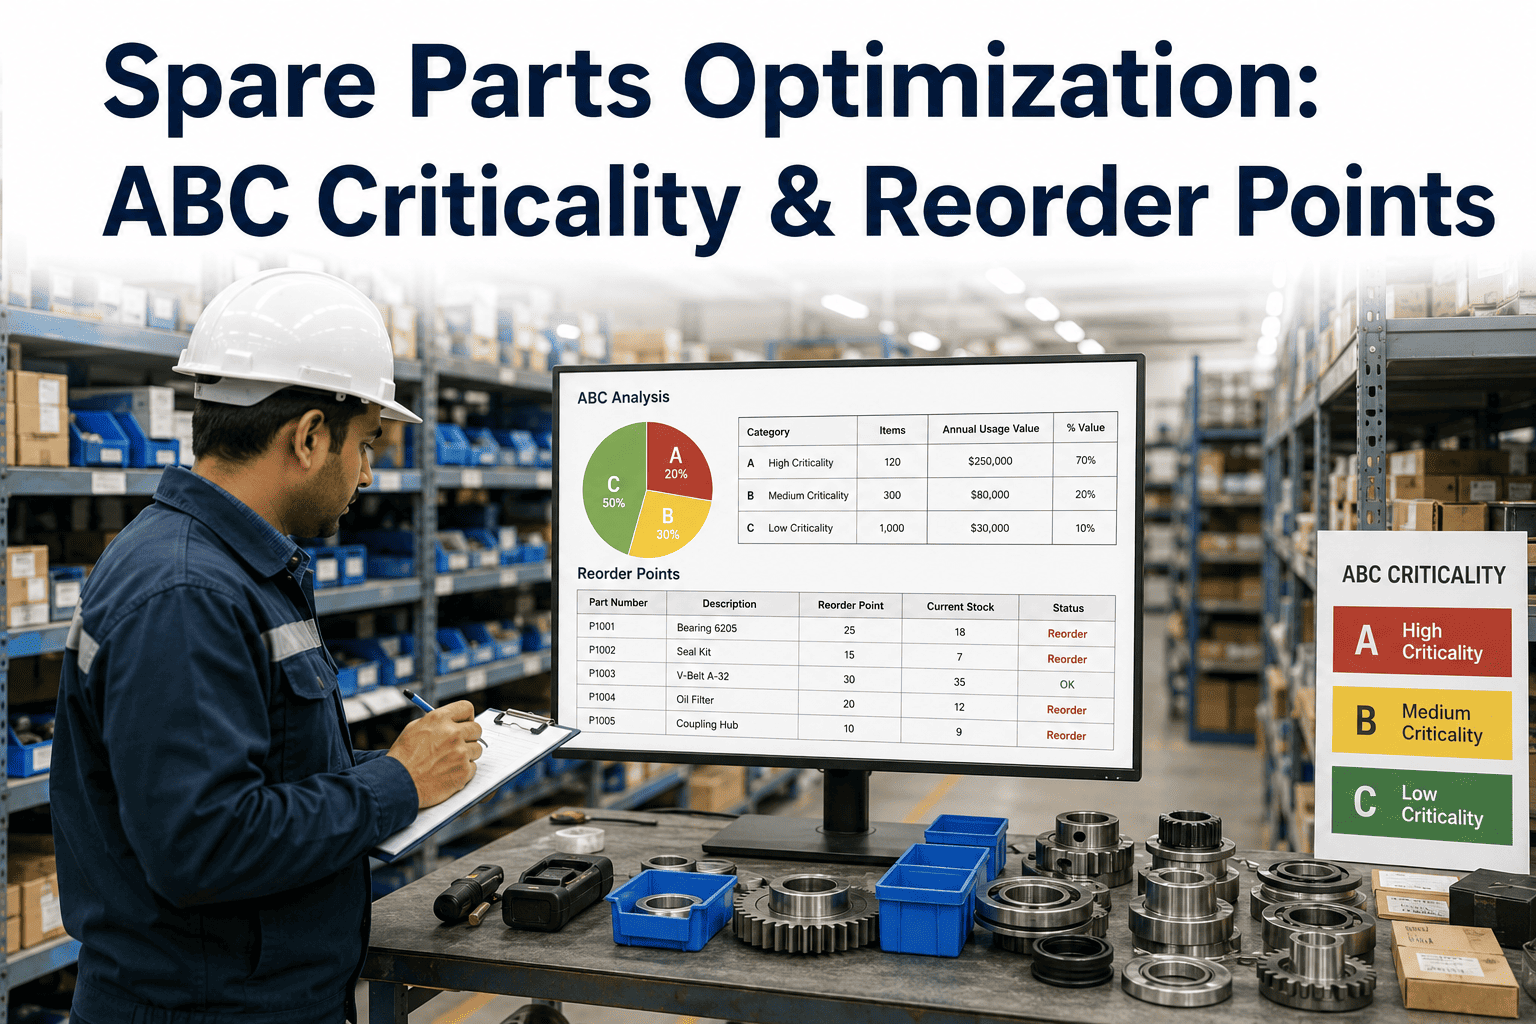
ABC classification is a foundational inventory management technique that sorts parts into three categories based on their contribution to total consumption value, which is calculated as unit cost multiplied by annual usage quantity. The classification reveals that a small percentage of part numbers typically accounts for a large percentage of total spending, which means that inventory management attention should be concentrated on that small group rather than spread evenly across the entire catalog. Without ABC classification, plants apply the same stocking policies to a fifty-dollar bearing that is consumed weekly and a fifty-dollar fitting that is consumed once every three years, which guarantees suboptimal inventory performance in both directions.
Class A
10 to 20 percent of part numbers drive 70 to 80 percent of total consumption value. These parts demand tight reorder point control, frequent review cycles, and minimal safety stock variability.
70-80% of value
Class B
20 to 30 percent of part numbers drive 15 to 25 percent of total consumption value. These parts require moderate control with periodic review and standard safety stock calculations.
15-25% of value
Class C
50 to 70 percent of part numbers drive only 5 to 10 percent of total consumption value. These parts can be managed with simple min-max controls, longer review cycles, and higher relative safety stock to avoid the administrative cost of frequent ordering.
5-10% of value
Criticality Assessment
Criticality Assessment — Why ABC Value Alone Does Not Determine Which Parts Deserve Shelf Space
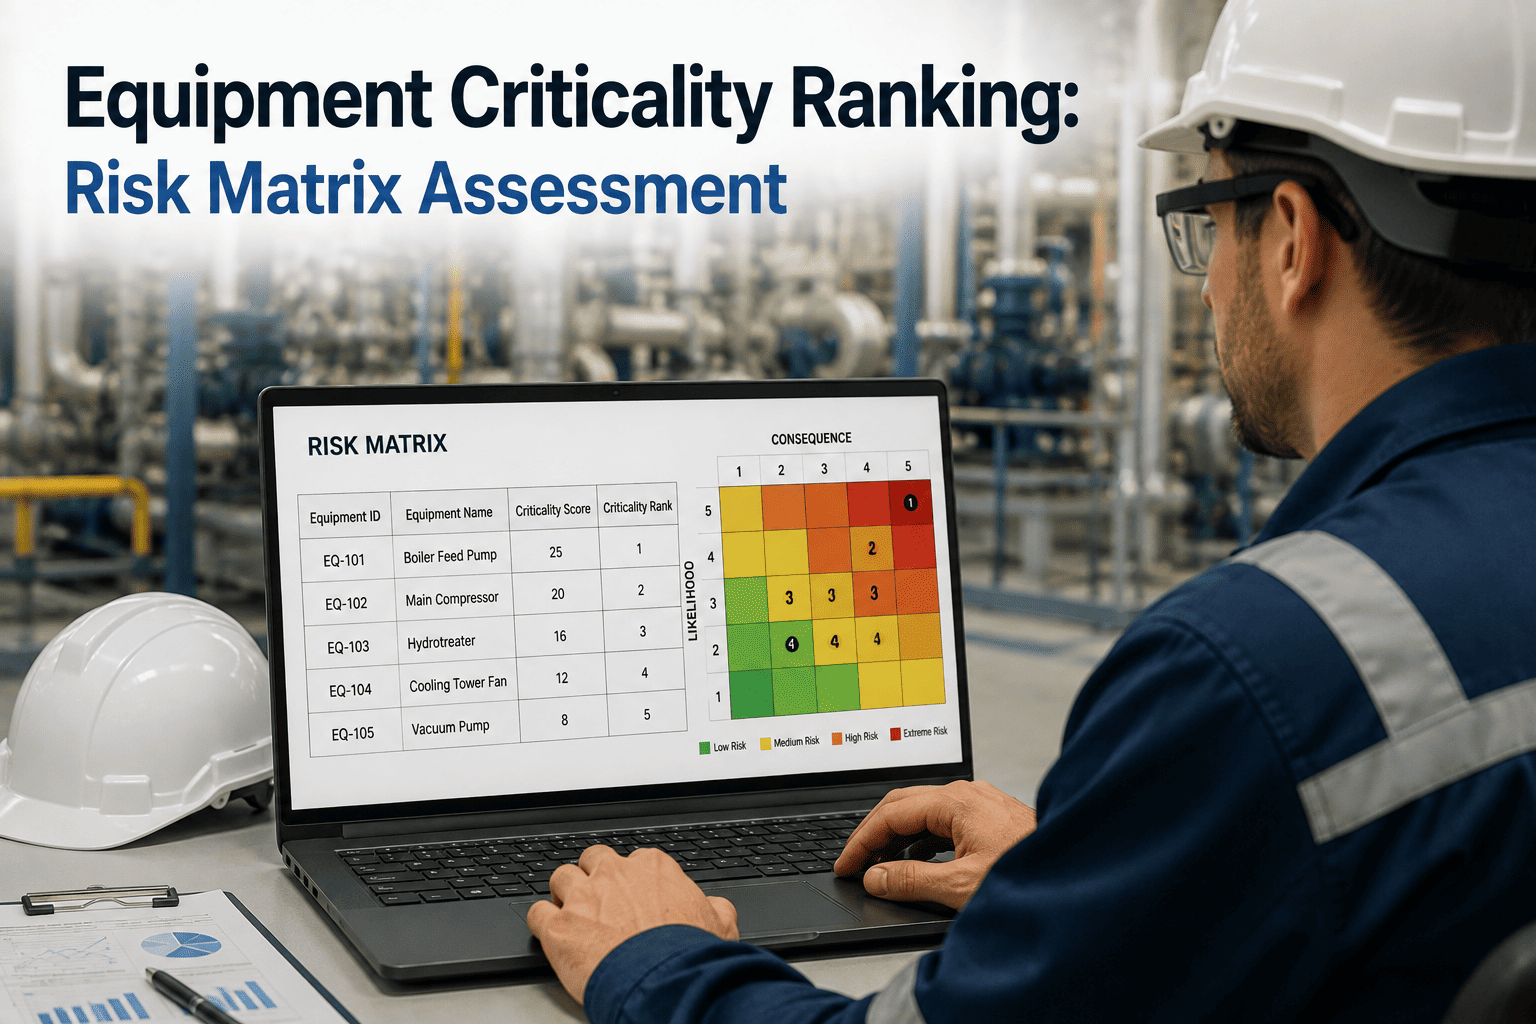
A part can be Class C by consumption value, meaning it costs very little and is rarely used, but still be the most important part in the storeroom because it protects a single point of failure on a production line with no redundant backup. Conversely, a Class A part by consumption value might serve equipment that has multiple redundant paths, where a stockout causes inconvenience but not a shutdown. Criticality assessment adds a second dimension to the classification by evaluating what happens to production, safety, and the environment if the part is not available when needed. The intersection of ABC classification and criticality assessment produces a stocking strategy matrix that is far more effective than either method alone.
Equipment Criticality
ABC Consumption Value Class
Class A
Class B
Class C
High Criticality
Stock Deep
High value and high consequence. Carry dedicated safety stock with calculated reorder points. Consider insurance spares if lead time exceeds production risk tolerance.
Stock Moderate
Moderate value but high consequence. Stock based on failure probability with reorder point tied to equipment condition indicators where available.
Insurance Spares
Low value but high consequence. Carry as insurance spares regardless of consumption frequency. Cost of stocking is negligible compared to downtime cost.
Low Criticality
JIT or Min-Max
High value but low consequence. Manage with just-in-time ordering or simple min-max controls. Do not carry excess safety stock.
Standard Stock
Moderate value and low consequence. Standard reorder point with average safety stock. Review periodically for downsizing.
Eliminate or Consolidate
Low value and low consequence. Candidate for elimination from stocked inventory. Order on demand or consolidate to a regional shared store.
Reorder Point Calculation
Reorder Point Calculation — The Math That Balances Stockout Risk Against Carrying Cost
The reorder point is the inventory level at which a new purchase order should be placed to replenish stock before it reaches zero, accounting for the lead time required for delivery and the variability in both demand during that lead time and the lead time itself. Many plants set reorder points based on subjective judgment or historical averages that do not account for variability, which means the reorder point is either too high, creating excess inventory, or too low, creating stockout risk. A properly calculated reorder point uses statistical demand and lead time distributions to set a reorder level that achieves a defined service level target, which is the probability that stock will be available when a requisition is placed.
ROP = (D x LT) + (Z x SDLT)
DAverage daily demand calculated from historical consumption data, excluding outlier periods
LTAverage lead time in days from purchase order to receiving dock, based on supplier performance history
ZService level factor from the standard normal distribution, typically 1.65 for 95 percent service level
SDLTStandard deviation of demand during lead time, combining demand variability and lead time variability
Example: Motor Bearing
D = 0.4 per day, LT = 14 days, Z = 1.65, SDLT = 1.2
ROP = (0.4 x 14) + (1.65 x 1.2) = 5.6 + 1.98 = 7.58, round to 8
Order when stock drops to 8 units to maintain 95 percent service level across a 14-day lead time
Example: PLC Input Module
D = 0.05 per day, LT = 21 days, Z = 2.05, SDLT = 0.15
ROP = (0.05 x 21) + (2.05 x 0.15) = 1.05 + 0.31 = 1.36, round to 2
Higher Z factor for critical spare pushes reorder point above simple demand-average calculation
Your Storeroom Is Full of Parts That Will Never Be Used and Missing Parts That Will Stop Your Line Tomorrow.
iFactory classifies your entire parts catalog by ABC consumption value and equipment criticality, calculates statistically sound reorder points, and flags obsolete inventory that is tying up capital you could be spending on the parts that actually matter.
Obsolescence Management
Spare Parts Obsolescence — How Inventory Becomes a Liability When Equipment Changes and the Parts Do Not
Obsolescence in spare parts inventory occurs when the equipment a part was stocked for is removed from service, replaced by a newer model with different components, or modified in a way that changes the bill of materials. The part remains in the inventory system with a valid stocking record, occupying shelf space and carrying cost, but it will never be requisitioned because the demand source no longer exists. In plants with long operating histories, obsolescence can accumulate silently for years because there is no systematic mechanism to trigger a part review when the associated equipment is changed through a capital project or a management of change action.
1
Equipment Change Occurs
A capital project replaces a pump, a control system upgrade changes the PLC model, or a process modification removes a heat exchanger from service. The MOC or project closeout updates the equipment register but does not trigger a review of the associated spare parts.
2
Demand Drops to Zero
The part that was previously consumed at some regular or irregular frequency stops appearing on requisitions entirely. Because the part is low-value or low-frequency, the absence of demand goes unnoticed in the normal inventory management workflow.
3
Inventory Ages in Place
The part sits in its designated bin location for 12, 24, or 36 months with zero movement. Annual physical inventory counts confirm it is still there but do not flag it as a candidate for removal because the inventory system still shows it as an active stocked item.
4
Carrying Cost Accumulates
At a 12 percent annual carrying cost, a parts inventory with $340,000 in obsolete stock is consuming roughly $34,000 per year in storage, insurance, depreciation, and capital opportunity cost with zero probability of ever being used.
5
Write-Off or Disposal Required
When obsolescence is finally identified, the parts must go through a formal write-off process that often requires finance approval, physical removal, and disposal or scrap sale, all of which are administrative effort that could have been avoided with earlier identification.
Common Failures
Where Spare Parts Optimization Programs Fail — And What Distinguishes Programs That Deliver Lasting Results
Many manufacturing plants have attempted spare parts optimization at some point, often triggered by a finance directive to reduce inventory value or a frustrated maintenance manager who cannot find a critical part during a shutdown. The programs that fail almost always share a set of common characteristics that cause initial improvements to erode within months of the project closing. Understanding these failure modes is essential to structuring a program that produces sustainable inventory performance rather than a one-time write-off that leaves the underlying problems intact.
One-Time Cleanup Without Ongoing Governance
The optimization project focuses on identifying and writing off obsolete stock but does not establish ongoing mechanisms to prevent new obsolescence from accumulating. Within eighteen months, the inventory is back to its pre-optimization state because the root cause was never addressed.
ABC Classification Based on Unit Price Instead of Consumption Value
Some programs sort parts by unit cost rather than annual consumption value, which misclassifies expensive but rarely used parts as Class A while missing the high-frequency consumables that actually drive the majority of inventory spending and reorder activity.
No Link Between Criticality Assessment and Stocking Policy
Criticality assessments are performed as exercises in documentation but the output does not actually change the stocking parameters in the inventory management system, so critical parts continue to be managed with the same min-max values as non-critical parts.
Reorder Points Set Once and Never Recalculated
Reorder points are calculated during the optimization project using historical data at that point in time, but there is no process to recalculate them as demand patterns change, equipment conditions evolve, or supplier lead times shift.
No Connection to Maintenance Planning
The optimization team works from inventory data alone without connecting to the maintenance schedule, meaning that parts needed for planned shutdowns are not differentiated from parts needed for random failures, which produces stocking policies that do not align with how work is actually executed.
Failure to Account for Lead Time Variability
Reorder points are calculated using average lead time without incorporating the standard deviation of lead time, which means the safety stock component does not protect against the delivery delays that cause the majority of actual stockout events.
Strategy Comparison
Spare Parts Stocking Strategies Across the ABC-Criticality Matrix
Matrix Position
Stocking Strategy
Reorder Method
Review Frequency
Obsolescence Risk
Class A / High Criticality
Dedicated safety stock with dual sourcing where possible
Continuous review with statistical reorder point
Weekly or real-time
Low — high consumption keeps inventory turning
Class B / High Criticality
Moderate safety stock tied to equipment condition
Periodic review with adjusted reorder point
Monthly
Low to moderate — consumption is predictable but slower
Class C / High Criticality
Insurance spare with one unit stocked regardless of usage
Review on equipment change or MOC only
Annual or on trigger
High — low usage means obsolescence can go unnoticed
Class A / Low Criticality
Minimal safety stock, leverage supplier inventory
Just-in-time or Kanban with frequent small orders
Weekly
Very low — high consumption prevents stagnation
Class B / Low Criticality
Standard min-max with moderate safety stock
Periodic review with standard reorder point
Monthly to quarterly
Moderate — review periodically for downsizing opportunity
Class C / Low Criticality
Eliminate from stocked inventory, order on demand
No reorder point, purchase on requisition
None until removal confirmed
N/A — already identified for elimination
Field Implementation
Reducing MRO Inventory Value by 23 Percent While Eliminating All Critical Stockout Events at a Process Manufacturing Plant
A process manufacturing plant with 12,000 active spare part numbers and a total inventory value of $3.1 million had been experiencing recurring stockout events on critical production equipment while simultaneously carrying over $600,000 in parts that had not been requisitioned in more than three years. The maintenance manager had requested budget increases to add more stock to address the stockouts, while the finance controller was demanding inventory reduction to free working capital. iFactory was deployed to analyze the full parts catalog, pulling consumption history from the CMMS, equipment criticality ratings from the asset register, and supplier lead time data from the purchasing system. The analysis classified 14 percent of parts as Class A driving 76 percent of consumption value, identified 2,800 parts with zero requisitions in 36 months as candidates for obsolescence review, and calculated that 68 percent of existing reorder points were set either too high or too low relative to the statistical demand and lead time profiles. Rather than a massive one-time adjustment, the team implemented the changes in three phases over four months. Phase one addressed the critical stockout problem by recalculating reorder points for all high-criticality parts and adding insurance spares for six single-point-of-failure components that had no on-site replacement. Phase two eliminated obsolete inventory through a structured write-off process that removed $490,000 in confirmed dead stock. Phase three recalculated reorder points for the remaining Class A and Class B parts using the statistical method, which reduced average on-hand quantities for those parts by 18 percent while increasing service level from 87 percent to 96 percent. Book a Demo to see how iFactory analyzes your parts catalog and calculates optimized stocking parameters.
23%Total inventory value reduction from $3.1M to $2.39M
$490KObsolete inventory identified and written off in structured process
96%Service level achieved after reorder point recalculation, up from 87%
0Critical stockout events in the six months following implementation
Frequently Asked Questions
Spare Parts Optimization — What Maintenance Managers and Materials Teams Ask First
What data sources does iFactory need to perform ABC classification and criticality assessment?
iFactory integrates with your computerized maintenance management system to pull parts consumption history including requisition dates, quantities, and associated equipment, with your asset register to pull equipment criticality ratings and bill of materials relationships, and with your purchasing or ERP system to pull unit costs, supplier lead times, and current on-hand quantities. The minimum data requirement for an initial ABC classification is twelve months of consumption history with unit costs, which produces a first-pass classification that can be refined as equipment criticality data is incorporated. For reorder point calculation, at least twenty-four months of consumption data is preferred to establish a reliable demand distribution that accounts for seasonal variation and planned shutdown demand spikes.
Book a Demo to discuss data requirements for your specific systems.
How does iFactory handle parts that are consumed during planned shutdowns versus random failures?
Planned shutdown consumption and random failure consumption are separated in the demand analysis because they follow fundamentally different patterns and require different stocking approaches. Parts consumed during planned shutdowns have predictable demand that can be aligned with the shutdown schedule and procured on a project basis rather than held in standing inventory. Parts consumed during random failures have stochastic demand that requires safety stock and statistical reorder points. iFactory uses maintenance work order type classifications from the CMMS to distinguish planned from unplanned consumption, calculates demand profiles for each category separately, and recommends different stocking strategies for the same part depending on which demand stream dominates. This prevents planned shutdown demand from inflating the safety stock calculation for parts that are also needed for random failures, which is a common error in manual reorder point setting.
Contact support to discuss how shutdown-specific demand is handled in the optimization workflow.
Can the system automatically flag parts for obsolescence review when equipment is changed?
Yes. iFactory can be configured to monitor management of change actions and capital project closeouts that modify or remove equipment from the asset register. When an equipment change is detected, the system cross-references the affected equipment against the bill of materials in the parts catalog and generates an obsolescence review notification for every spare part that is uniquely associated with the changed equipment. The notification includes the part number, the equipment it was stocked for, the date of the equipment change, the current on-hand quantity, and the inventory value at risk, giving the materials team an immediate and actionable list of parts to evaluate for removal rather than discovering them months or years later during a manual review. This MOC-triggered review mechanism is what prevents the obsolescence accumulation cycle that occurs at facilities where equipment changes and parts inventory are managed in disconnected systems.
How often should reorder points be recalculated, and does iFactory automate that process?
For Class A parts with high consumption variability, monthly recalculation is recommended to ensure the reorder point reflects the most recent demand pattern. For Class B parts, quarterly recalculation is typically sufficient. For Class C parts that are retained as insurance spares based on criticality rather than consumption, reorder point recalculation is not relevant because the stocking decision is based on consequence rather than demand frequency. iFactory automates the recalculation process on configurable schedules, pulling the latest consumption data and lead time performance to generate updated reorder points that can be reviewed and approved by the materials team before being pushed to the inventory management system. The system also flags any reorder point where the recommended change exceeds a defined threshold, such as a 20 percent increase or decrease, so that significant changes receive individual attention rather than being applied automatically without review.
Book a Demo to see the automated reorder point recalculation workflow.
What is the typical timeline to implement spare parts optimization across a plant with 10,000 or more part numbers?
For a plant with 10,000 to 15,000 active part numbers and existing CMMS, ERP, and asset register systems that can be integrated, the initial analysis and classification phase typically takes two to three weeks. This includes ABC classification, criticality mapping, obsolescence identification, and reorder point calculation for the full catalog. The implementation phase, where optimized stocking parameters are validated by the materials and maintenance teams and loaded into the inventory system, typically takes an additional four to six weeks depending on how many parts require individual review and approval. The total timeline from project kickoff to live optimized inventory parameters is generally six to nine weeks for a single plant, with additional time required for multi-plant deployments where standardization of classification criteria and criticality definitions across sites is needed.
Contact support to get a deployment timeline estimate for your plant count and parts catalog size.
Your Spare Parts Inventory Is a $2 Million Bet That You Placed Without Calculating the Odds.
ABC classification, criticality assessment, and statistical reorder point calculation turn your parts inventory from a guessing game into a data-driven strategy that reduces carrying cost while eliminating the stockouts that stop your production lines.