Not every asset on a plant floor deserves the same maintenance attention, and treating them as if they do is one of the most common reasons maintenance budgets get spent in the wrong places. A conveyor motor with three spares in the storeroom and a bottling line's only filler pump are not the same risk, even if both show up as identical line items in a CMMS. Equipment criticality ranking assigns every asset a defensible score based on production impact, safety consequence, and how hard it is to recover from a failure, then routes maintenance strategy accordingly. iFactory's reliability engineering team can help build a criticality model against your actual asset register rather than a generic template.
Predictive Maintenance · Asset Prioritization
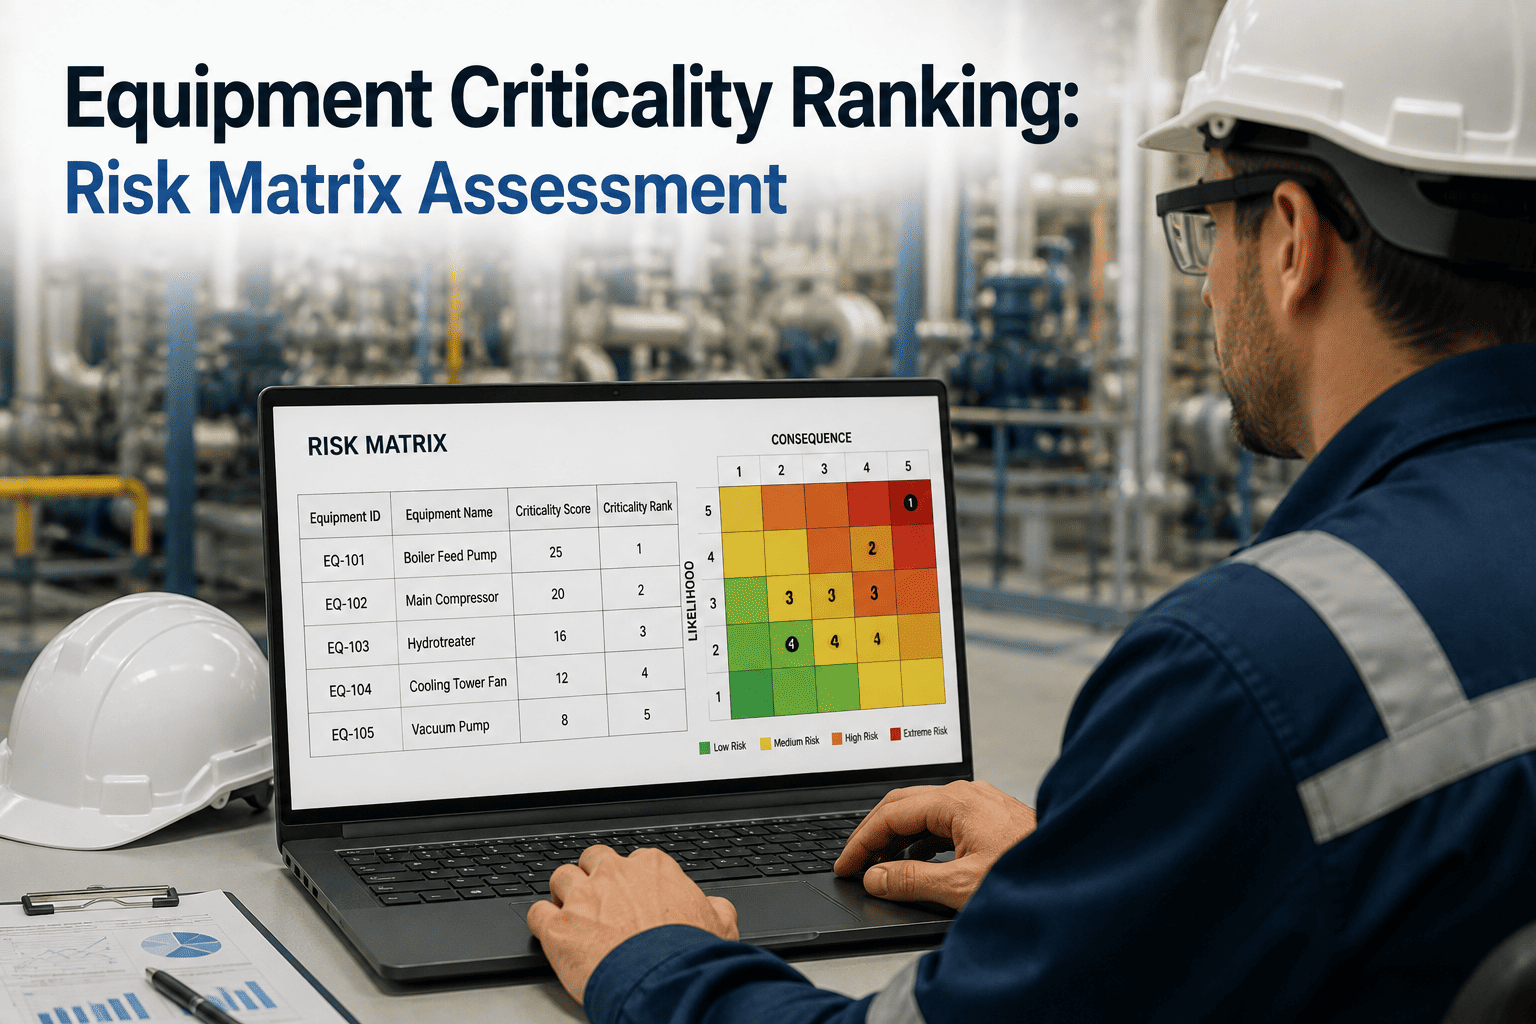
Equipment Criticality Ranking: Turning Gut Feel Into a Defensible Risk Matrix
Every maintenance budget is finite, and every reliability team eventually has to answer the same question — which assets get predictive monitoring, which get standard preventive maintenance, and which are fine running to failure. A structured criticality matrix answers it with data instead of whoever argues loudest in the planning meeting.
The Default Failure Mode
Without a Criticality Model, Maintenance Is Reactive by Default
Ask most maintenance teams which assets matter most, and the honest answer is usually "whichever one broke most recently." That is not a criticism of the team — it is what happens naturally when there is no structured way to compare a compressor against a conveyor against a control panel. Every department has a different lens on the same equipment. Operations sees which asset throttles output. Safety sees which one carries injury or environmental risk if it fails. Finance sees repair cost and downtime dollars. None of those views alone produces a ranking that everyone trusts, and scoring based on opinion instead of maintenance history and failure records is one of the most common pitfalls teams run into when they first attempt a criticality analysis.
The cost of skipping this step compounds quietly. Unplanned downtime already costs manufacturers enormous sums industry-wide, and a large share of that cost traces back to critical assets that were never flagged as critical until after they failed. Meanwhile, plenty of maintenance hours get spent on low-consequence equipment simply because it is easier to schedule than to justify skipping. A criticality matrix does not eliminate failures — it makes sure the failures that do happen are the ones you already decided you could live with, rather than the ones that catch a planning meeting completely off guard three weeks after a similar asset was quietly deprioritized.
Building the model correctly also means resisting the urge to let maintenance alone own the scoring. Operations, safety, and engineering each hold information the maintenance team does not have full visibility into on their own, and a cross-functional scoring exercise consistently produces a more accurate and more defensible ranking than one department working in isolation. It also gives the resulting list political durability — a ranking that safety and operations helped build is far harder to override in a budget cycle than one maintenance produced alone and simply circulated for comment.
The Four Scoring Dimensions
What Actually Goes Into a Criticality Score
A defensible criticality model scores every asset numerically across the same defined criteria, rather than letting each evaluator apply their own private rubric. The four dimensions below drive the bulk of the calculation in most manufacturing criticality frameworks.
1
Safety and Environmental Consequence
Does failure create a risk of injury, fatality, or hazardous release? Assets carrying a genuine safety consequence are automatically elevated in the ranking regardless of how they score on production impact, since a safety incident is not a cost that can be traded off against convenience.
2
Production and Operational Impact
Does failure halt or degrade a production line, service, or revenue stream? Single-point-of-failure assets with no installed redundancy score materially higher than equipment with a backup unit that can absorb the load while repairs happen.
3
Failure Probability and History
How likely is this asset to fail within a given period, based on historical maintenance records and failure frequency rather than a guess? Assets running continuously under harsh conditions carry a materially higher probability score than equipment used intermittently under mild conditions.
4
Recovery Difficulty and Repair Cost
How long does repair or replacement actually take once a failure happens? Long lead-time spare parts, specialized technician requirements, and complex reinstallation procedures all amplify the real-world criticality of a failure well beyond what its raw production impact alone would suggest.
Visualizing the Score
Plotting Severity Against Probability on the Risk Matrix
Once severity and probability scores are assigned, every asset gets plotted on a grid where the intersection of the two axes determines its final criticality tier. The five-by-five layout below is the standard structure most manufacturing criticality frameworks use to turn two numbers into one clear ranking.
Probability of Failure
Medium
High
Critical
Critical
Critical
Low
Medium
High
Critical
Critical
Low
Low
Medium
High
Critical
Low
Low
Medium
High
High
Low
Low
Low
Medium
Medium
Severity of Consequence
Assets landing in the critical zone — high severity paired with high probability — become the immediate focus for predictive monitoring and condition-based maintenance. Assets in the low zone at the opposite corner are strong candidates for run-to-failure strategies, freeing up technician hours that would otherwise be spent maintaining equipment whose failure barely registers.
See a Live Criticality Model Built From Your Asset Register
Watch a Risk Matrix Score a Real Asset Population
iFactory's reliability team walks through how a criticality score is calculated end to end — from raw failure history and consequence scoring to a ranked asset list ready to drive maintenance strategy. Bring a sample of your asset register and we'll score it live.
From Score to Strategy
What Each Criticality Tier Actually Changes
A criticality score only earns its keep once it changes how an asset is actually maintained. The tiers below map each matrix zone to the maintenance strategy it typically justifies.
Critical Tier
Predictive and condition-based monitoring, strict preventive schedules, and priority spare parts stocking. These are the single-point-of-failure assets where an unplanned failure has both safety and production consequences.
High Tier
Regular condition monitoring combined with a firm preventive schedule based on manufacturer recommendations and usage data, with periodic review as operating conditions change.
Medium Tier
Standard time-based preventive maintenance intervals, without the added cost of continuous condition monitoring, revisited periodically to confirm the rating still reflects current operating conditions.
Low Tier
Run-to-failure or minimal time-based intervals are generally acceptable here, since redundancy or low consequence means a failure is an inconvenience rather than an operational or safety event.
Tiering also changes how spare parts inventory gets managed, since a critical asset with a long repair lead time justifies carrying an expensive spare on the shelf even when it rarely fails, while a low-tier asset with an identical repair cost usually does not warrant the same investment. Getting this mapping right is what turns a criticality score from an academic exercise into a document that actually shapes purchasing decisions, technician scheduling, and capital planning conversations months or years in advance, rather than a report that gets filed away after the initial workshop and never referenced again.
Criticality in Practice
How the Same Four Factors Play Out Across Different Asset Types
The scoring criteria stay constant, but the way they combine looks very different depending on the asset category. The examples below illustrate how equipment that looks similar on paper can land in very different tiers once the full picture is scored.
Single-Line Bottleneck Equipment
A filler, packer, or extruder with no installed backup on a single production line typically scores high on both severity and probability, since any stoppage halts the entire line's output with no fallback path.
Redundant Utility Equipment
A compressor or pump that is one of three units sized with built-in spare capacity often scores lower overall, even if its individual failure probability is identical, because the redundancy absorbs the production consequence.
Safety and Emissions Equipment
Relief valves, gas detection systems, and emissions control equipment frequently score at the top of the matrix regardless of production impact, since their failure consequence is measured in safety and regulatory terms rather than output.
Long Lead-Time Specialty Assets
A custom-wound motor or a gearbox with a twelve-week replacement lead time can score critical even at a moderate failure probability, since the recovery difficulty factor alone extends any outage far longer than the plant can absorb.
General Facility Equipment
Office HVAC, general lighting circuits, and administrative building systems typically land in the low tier, since their failure creates discomfort rather than a genuine safety, production, or compliance consequence.
Aging Assets Nearing End of Life
Equipment with a rising failure frequency trend in the maintenance history should see its probability score climb accordingly, even if the asset was reliable for years, since criticality reflects current condition rather than original design intent.
Building the Model
The Process, Start to Finish
A streamlined criticality analysis follows the same core sequence regardless of facility size — the steps below describe how the assessment actually moves from a raw asset list to a ranked, strategy-linked model.
| Step |
What Happens |
Who's Involved |
| Agree the risk matrix |
Define the severity and probability scales and how many tiers the matrix will use |
Reliability engineering, operations |
| Build the asset hierarchy |
Assemble a complete, structured list of assets down to the level maintenance is actually planned at |
Maintenance, engineering |
| Collect failure history |
Pull maintenance records, repair costs, and downtime duration per asset to remove guesswork from scoring |
CMMS data, maintenance |
| Score each asset |
Apply the four scoring dimensions consistently across every asset using the agreed matrix |
Cross-functional scoring team |
| Assign strategy by tier |
Map each criticality tier to a defined maintenance strategy and spare parts policy |
Reliability engineering, procurement |
| Review and revise |
Revisit scores periodically since operating conditions, redundancy, and failure history all change over time |
Reliability engineering |
What Reliability Teams Actually Gain
The Operational Impact of a Defensible Criticality Model
The value of a criticality matrix shows up less in the model itself and more in the decisions it changes once maintenance planning stops treating every asset the same way.
Maintenance Spend Follows Actual Risk
Predictive monitoring and priority spare stocking concentrate on the assets whose failure genuinely threatens safety or production, instead of being spread evenly across the asset register.
Fewer Surprise Critical Failures
Assets that were quietly critical but undocumented get identified and elevated before their first unplanned failure, rather than after it.
Freed-Up Technician Hours
Low-criticality assets moved to run-to-failure or reduced-frequency strategies free up hours that get redirected to the equipment where they actually reduce risk.
A Ranking Every Department Trusts
Because the score is built from data and cross-functional input rather than one department's opinion, the resulting priority list holds up in the budget conversation instead of being re-litigated every planning cycle.
Common Questions
Frequently Asked Questions
Who should actually be involved in scoring criticality?
Limiting the exercise to maintenance personnel alone is one of the most common mistakes teams make when building a criticality model, because maintenance typically has the clearest view of failure history but the least visibility into revenue impact or regulatory exposure. A cross-functional team that includes maintenance engineers, operations managers, safety officers, and often a finance representative produces a materially more accurate score, since each function experiences an equipment failure differently and contributes information the others lack.
iFactory's reliability team can help structure that scoring session so it stays efficient rather than turning into an open-ended debate.
How often should a criticality ranking be revisited?
Criticality is not a one-time exercise, since operating conditions, redundancy, and equipment age all shift over time in ways that change an asset's real risk profile. A common cadence is an annual full review paired with an ad hoc reassessment any time a significant process change, new redundancy installation, or a run of unexpected failures suggests an asset's tier may no longer reflect reality. Assets that were scored low specifically because a backup unit existed should be flagged for immediate re-review the moment that redundancy is removed or goes out of service.
What is the difference between criticality ranking and FMEA?
Criticality ranking and failure mode and effects analysis answer related but distinct questions. Criticality ranking asks which asset matters most overall, producing a single prioritized list used to allocate maintenance resources, spare parts inventory, and monitoring budget across the entire asset register. FMEA goes a level deeper on a specific asset, breaking down its individual failure modes, the effects of each one, and the detection methods available for each, which is more useful once you already know an asset is critical and need to design the specific maintenance tasks that protect it. Many reliability programs run criticality ranking first to decide where to focus, then apply FMEA to the assets that rank highest.
Can criticality scoring work without years of historical failure data?
Yes, though the score becomes more defensible as real failure history accumulates. Facilities without extensive historical records typically start with manufacturer-recommended failure rates, engineering judgment from experienced technicians, and known process criteria such as redundancy and safety consequence, then refine the scores as actual maintenance and failure data builds up in the CMMS. The goal in the early stages is consistency in how the scoring criteria are applied across assets, not perfect historical precision, since even a directionally correct ranking is a significant improvement over no ranking at all. As real operating data accumulates in the CMMS over the following year or two, the probability scores can be recalculated against actual failure rates and the ranking naturally becomes more precise without requiring a second full workshop.
How does a criticality model connect to our existing CMMS?
A criticality score is most useful when it lives directly on the asset record in the CMMS rather than in a separate spreadsheet that quietly goes stale, since that is what lets the tier automatically drive preventive maintenance frequency, work order priority, and spare parts stocking policy. Once the scoring model is agreed, the tier and its supporting factors get written back to each asset record, and the platform can flag assets whose score is overdue for review.
Booking a demo is the fastest way to see how that scoring and review workflow would sit inside your specific CMMS.
Stop Guessing Which Assets Matter Most
Build a Defensible Criticality Model Against Your Own Asset Register
iFactory's reliability engineering team helps structure the scoring criteria, run the cross-functional workshop, and write the resulting tiers directly into your maintenance system so criticality actually drives strategy instead of sitting in a spreadsheet. Book a demo to see the scoring model in action, or get in touch with support to start scoping a criticality assessment against your plant.