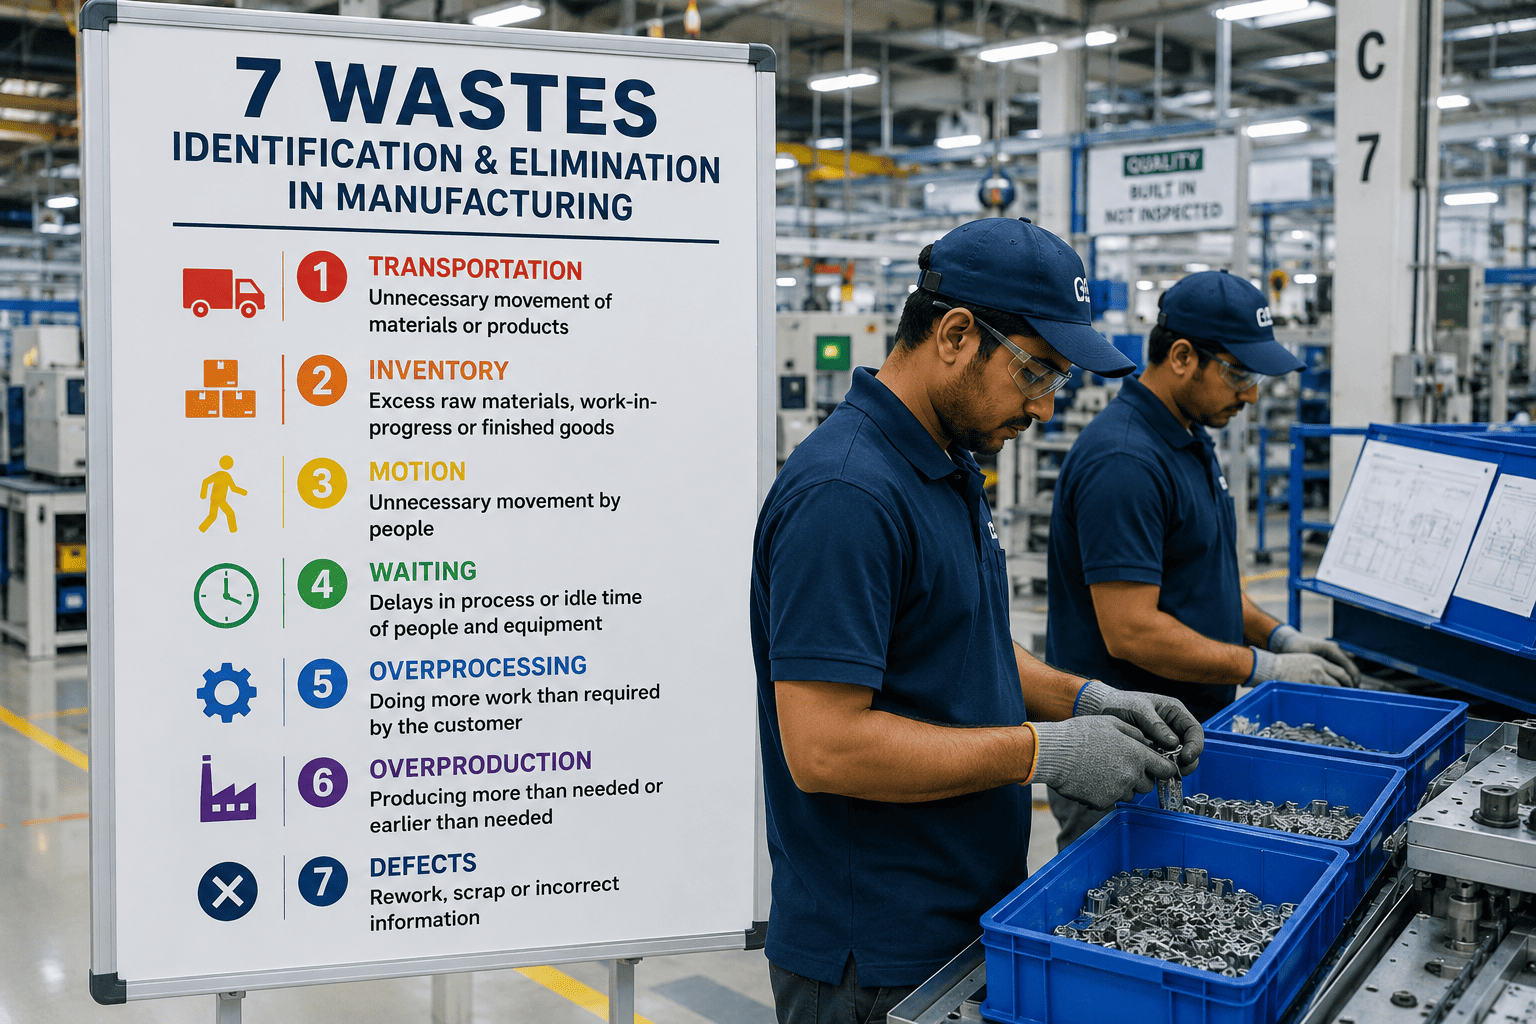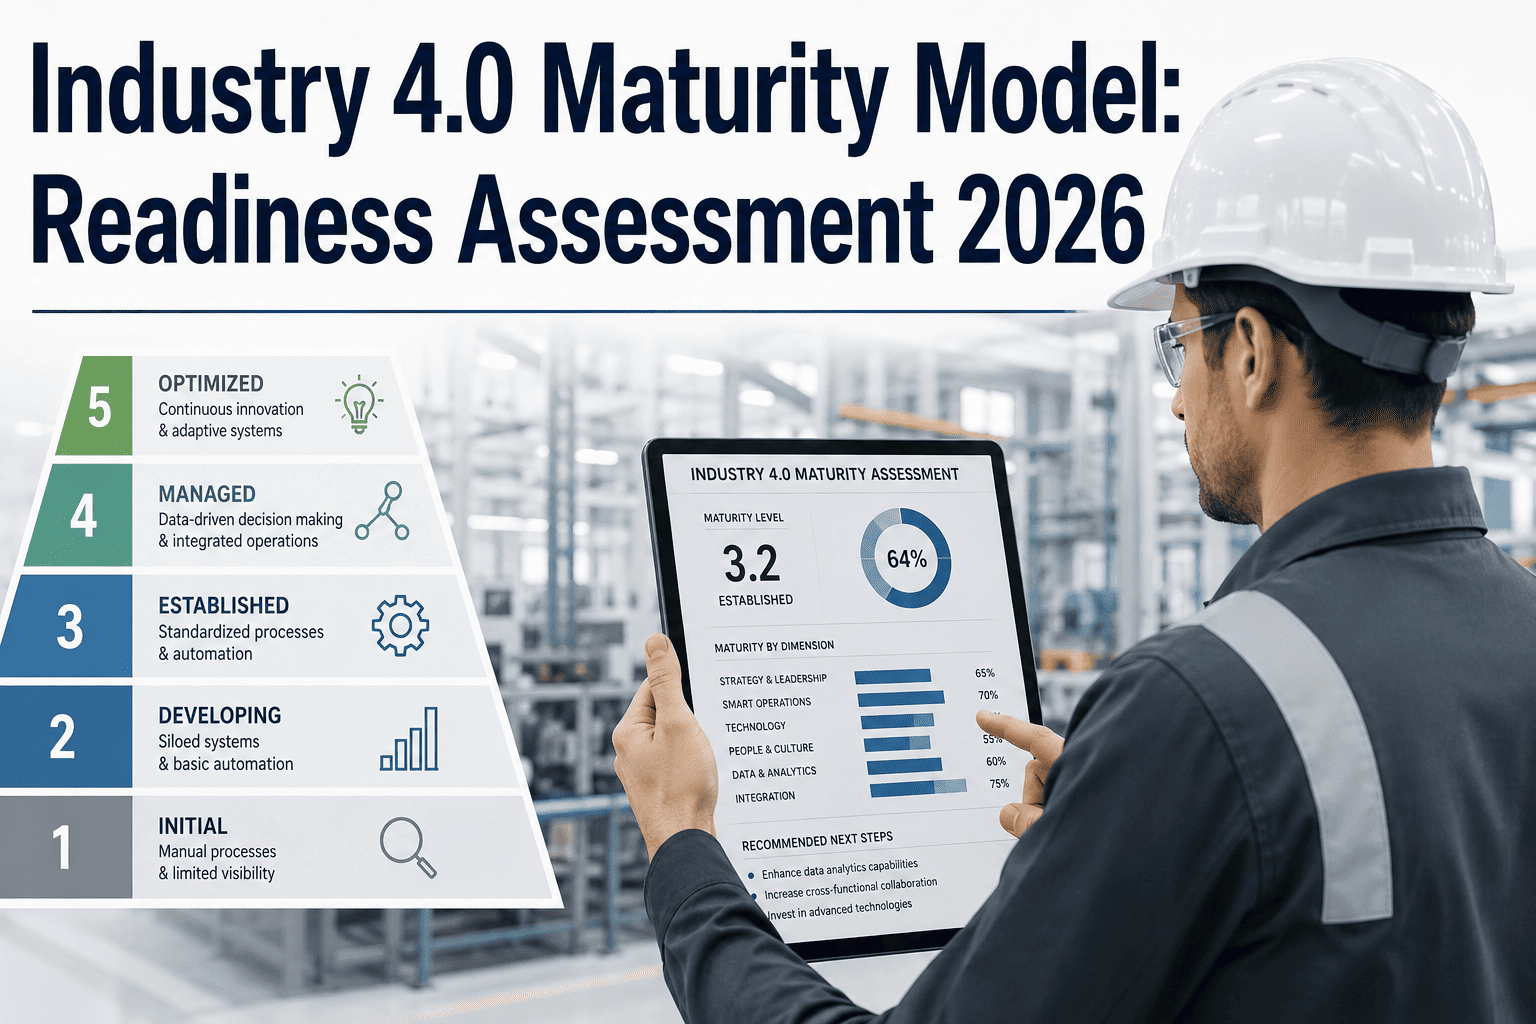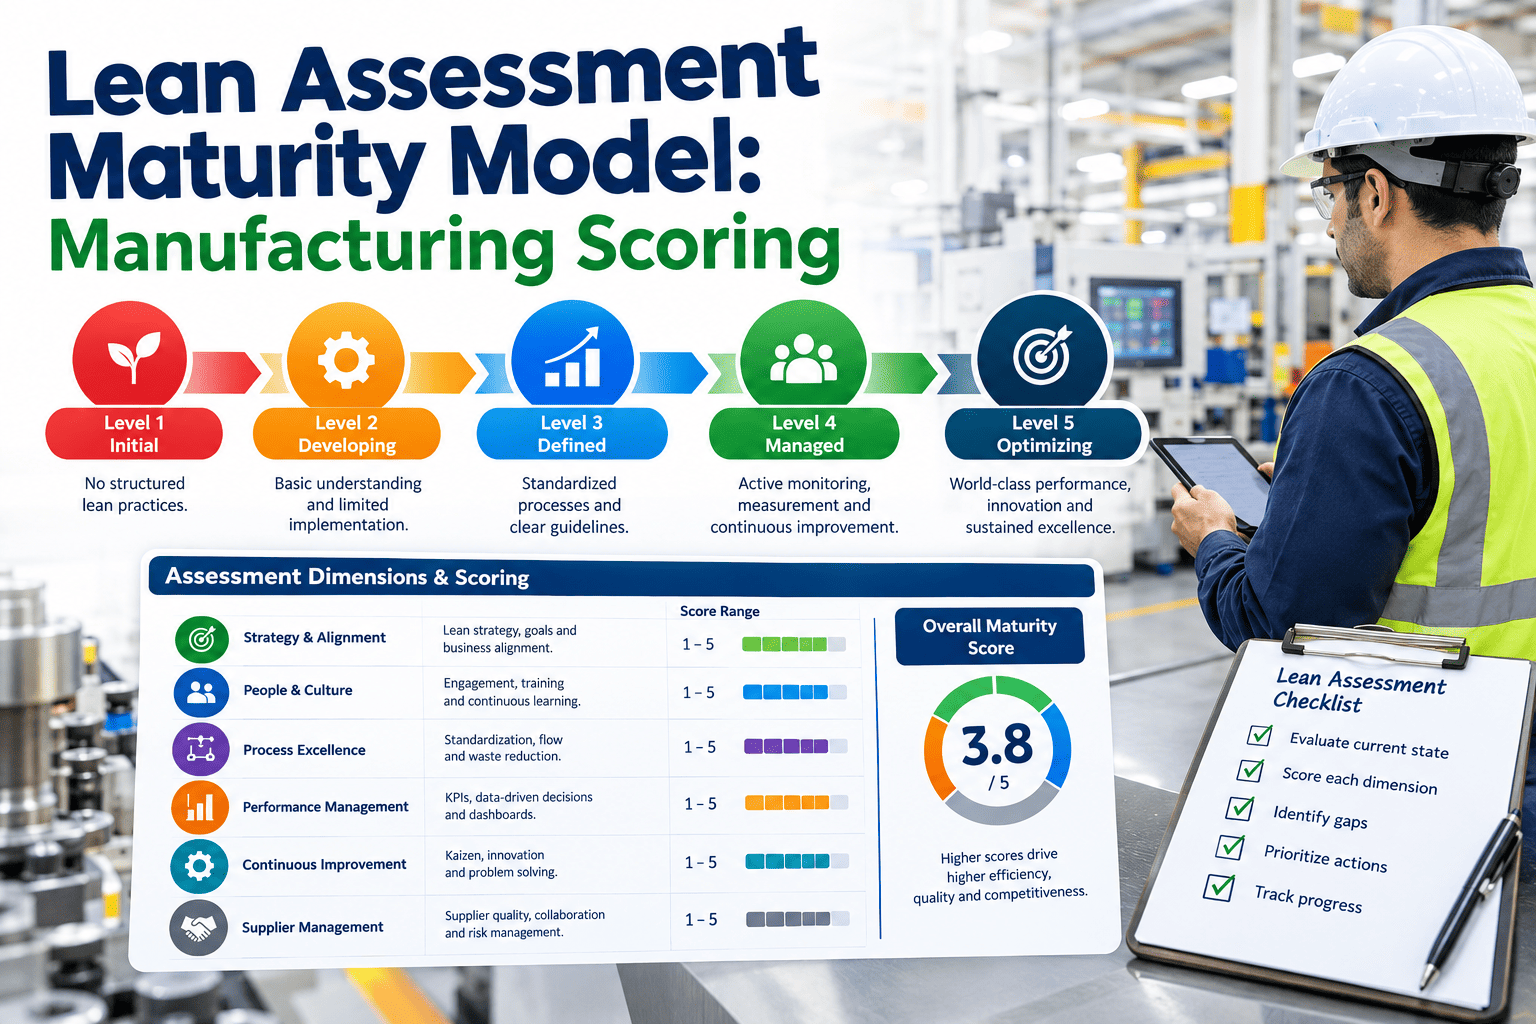
Most plants can point to a wall covered in 5S posters and a kaizen board that hasn't been updated since last quarter, and call that "being lean." A real lean maturity assessment replaces that gut feeling with a scored model across the dimensions that actually determine whether continuous improvement sticks or quietly fades after the consultants leave. This page breaks down how a manufacturing lean maturity model scores each dimension, where most plants actually land versus where they think they land, and how a documented gap turns into a prioritized improvement roadmap instead of another binder on a shelf. Plants ready to run this assessment against their own operation can start with the iFactory support team.
Know Exactly Where Your Lean Program Stands — Not Where the Posters Say It Stands
A lean maturity assessment scores your plant across the dimensions that actually determine whether continuous improvement holds, then turns every gap into a ranked, ownable action on the improvement roadmap.
Why "We Do Lean Here" Is Not a Maturity Score
Ask most plant managers whether their operation is lean and the answer is almost always yes, usually backed by a description of the tools in use — 5S, kanban, a kaizen board, maybe a value stream map from two years ago. A maturity model asks a harder question: are those tools sustaining themselves without constant management push, or would they collapse the moment the current champion leaves the building.
A plant with 5S boards, a kanban system, and a kaizen suggestion box looks lean on a walkthrough, but none of that tells you whether the tools are used correctly, sustained without champion intervention, or connected to a real strategic priority.
Each dimension is scored against defined behavioral evidence — who owns it, how often it's reviewed, whether it survives a personnel change — producing a level that predicts whether the program holds under normal turnover and schedule pressure.
The Dimensions a Credible Lean Maturity Model Scores
A single overall "lean score" hides more than it reveals, because a plant can be excellent at visual management and still have no functioning problem-solving discipline underneath it. Scoring each dimension separately is what turns the assessment into a usable diagnostic rather than a vanity number.
Standard Work & Visual Management
Whether documented standard work actually exists at the workstation, is followed consistently, and is updated when a better method is found — rather than laminated once and never revisited.
Problem-Solving Discipline
Whether operators and supervisors use a structured method — A3, 8D, PDCA — to solve recurring problems, or whether the same issue gets a quick fix and reappears every few weeks.
Leader Standard Work & Gemba Discipline
Whether supervisors and managers have a defined, followed cadence of floor presence and coaching, or whether "management by walking around" only happens during a scheduled audit.
Metrics & Daily Management
Whether performance metrics are visible, current, and actually drive a daily conversation about countermeasures, or whether the board is updated for the benefit of visitors rather than the team running it.
Employee Engagement & Idea Flow
Whether frontline improvement ideas have a real path to review, decision, and implementation with visible follow-through, or whether the suggestion box is a symbolic gesture nobody expects results from.
Strategic Alignment
Whether improvement projects on the floor are visibly connected to a plant or company strategic priority, or whether kaizen events are chosen based on whoever asked loudest that month.
Score Your Own Plant Against These Six Dimensions
Book a walkthrough and iFactory will show you how the dimension-by-dimension scoring model works against a sample of your own operation's data and floor evidence.
The Five Maturity Levels, From Ad Hoc to Self-Sustaining
Each dimension is scored against the same five-level ladder, so a plant's profile can be compared dimension to dimension and against itself over time as the improvement roadmap takes effect.
Assessment Method: Where the Score Actually Comes From
A score that comes only from a manager's self-assessment survey tends to run optimistic. A credible assessment triangulates three sources so the resulting level reflects what is actually happening on the floor rather than what leadership believes is happening.
| Evidence Source | What It Reveals | Common Gap Exposed |
|---|---|---|
| Gemba Walk Observation | Whether standard work and visual management are actually followed in practice | Documentation exists but is not followed on second and third shift |
| Structured Interviews | Whether operators and supervisors understand the "why" behind the tools they use | Tools are used mechanically without understanding the underlying problem they solve |
| Historical Data Review | Whether metrics, kaizen closure rates, and idea-implementation rates show a real trend | Metrics board looks current but underlying data has not moved in months |
A Composite Scenario: The Plant That Scored Itself a 4 and Actually Sat at a 2
A mid-sized components manufacturer had run lean initiatives for nearly six years and leadership's internal self-assessment consistently rated the program at a 4 out of 5 — "managed," in the model's language — pointing to a well-attended kaizen event calendar and full 5S audit scores across the plant.
An independent maturity assessment combining gemba observation, floor interviews, and a review of two years of kaizen closure data told a different story. Standard work and visual management scored a genuine 4, but problem-solving discipline scored a 2 — most "closed" kaizen items were quick fixes with no root-cause verification, and the same top defects reappeared on the line every six to eight weeks. Leader standard work also scored a 2, since supervisor gemba walks were documented on paper but interviews showed they rarely happened as logged. The composite maturity score, once every dimension was weighted honestly, came in at 2.6 rather than the self-reported 4.
The roadmap that followed focused almost entirely on those two dimensions rather than spreading effort evenly across all six, since the assessment made clear that visual management and 5S were already solid and did not need further investment. Eight months later, a re-assessment showed problem-solving discipline moving to a 3 and leader standard work to a 3, with the recurring-defect cycle stretching from six weeks to over five months between repeat occurrences.
Turning a Gap Into a Roadmap Instead of a Report
The assessment itself is only useful if the gaps it identifies convert into a prioritized, owned set of actions. The dimensions scoring lowest relative to their strategic importance — not simply the lowest absolute scores — should drive the first wave of the roadmap, since a low score on a low-priority dimension matters far less than a moderate score on a dimension tied directly to a plant's top strategic objective.
Mistakes That Undermine a Lean Maturity Assessment
Relying Only on Self-Assessment Surveys
A survey filled out by the people responsible for the program tends to score generously. Gemba observation and data review are what keep the score honest.
Producing One Overall Score
A single composite number hides which specific dimension is actually holding the program back, and leads to improvement effort spread thin across everything instead of focused where it matters.
Treating the Assessment as a One-Time Audit
Maturity moves in both directions. Without a re-scoring cadence, a plant that improved after an initial roadmap can quietly slide back once attention moves elsewhere.
Skipping the Strategic Weighting Step
Fixing the lowest-scoring dimension first, regardless of its strategic relevance, wastes effort on a gap that may not matter as much as a moderate gap in a higher-priority area.
Assigning Roadmap Ownership to a Committee
Shared ownership across a steering committee diffuses accountability. Each priority gap needs exactly one named owner and a defined review date.
Ignoring Shift-to-Shift Variation
A dimension scored only from day-shift observation can badly overstate maturity if second and third shift are running a very different reality on the floor.
Is Your Plant Ready for a Real Maturity Assessment
Leadership is willing to hear a score lower than expected
An assessment only produces value if the resulting score is treated as diagnostic input rather than a performance review leadership feels compelled to defend or dispute.
You can access at least two years of kaizen and metrics history
Historical closure rates, recurrence patterns, and metric trends are what separate a genuine maturity signal from a snapshot that happens to look good on assessment day.
Gemba observation can cover more than one shift
A single-shift assessment risks badly overstating or understating maturity if practice differs meaningfully across shifts, which is common in plants without strong leader standard work.
There is a defined owner ready to run the resulting roadmap
A completed assessment without a committed roadmap owner tends to sit as a report rather than drive the prioritized action it was designed to produce.
Frequently Asked Questions
How is a lean maturity assessment different from a standard lean audit or 5S score?
A standard 5S audit or lean checklist typically checks whether specific tools are present and being used at a point in time, producing a compliance-style score. A maturity assessment goes further by evaluating whether each dimension is sustained without constant management intervention, whether it survives normal personnel turnover, and whether it is connected to a real strategic priority rather than existing in isolation. The five-level scale used in a maturity model — from ad hoc activity through to a fully self-sustaining culture — captures that sustainment question in a way a simple present-or-absent checklist cannot. This is why two plants can show identical 5S audit scores while sitting at very different points on the maturity ladder underneath. Plants that want to see a sample dimension-by-dimension scorecard can reach out through iFactory support.
How many dimensions should a manufacturing lean maturity model score?
Most credible frameworks score somewhere between five and eight dimensions, commonly including standard work and visual management, problem-solving discipline, leader standard work, metrics and daily management, employee engagement, and strategic alignment. Scoring too few dimensions risks collapsing genuinely different capabilities into one number, while scoring too many can dilute assessor attention and make the resulting roadmap harder to prioritize. The right number for a given plant often depends on its size and complexity, with a single-line operation needing fewer distinct dimensions than a multi-line, multi-shift facility. What matters most is that each dimension has clearly defined behavioral evidence at every maturity level, so the score is not left to individual assessor interpretation.
Who should conduct the maturity assessment — internal staff or an outside team?
Both approaches are used successfully, though an outside or cross-plant assessor tends to produce a more honest score because they have less personal stake in defending the existing program's reputation. Internal assessment works well when the plant has a trained continuous improvement function with enough independence from line management to report an unflattering score without political consequence. Many organizations use a hybrid approach — an internal team trained on the scoring rubric, calibrated periodically by an outside reviewer — to keep the assessment repeatable and affordable while still guarding against self-serving scores. Booking a demo is a good way to see how a structured, data-backed scoring rubric reduces that subjectivity regardless of who runs it.
How often should a plant re-run the maturity assessment?
A full assessment across every dimension is typically worth repeating annually, since meaningful maturity movement in a well-run roadmap usually takes many months to show up as sustained behavior rather than a temporary spike after a training push. An abbreviated re-score focused specifically on the priority dimensions identified in the current roadmap is worth running more frequently, often every ninety days, to confirm the gains from recent roadmap actions are holding rather than fading once initial attention moves elsewhere. Re-scoring too infrequently risks discovering a regression long after it started; re-scoring too often on every dimension burns assessment capacity without giving initiatives enough time to show real movement.
Can a small plant with limited lean history use this kind of maturity model?
Yes — the model is equally useful for a plant just beginning a lean journey, since an honest Level 1 or Level 2 baseline is far more useful for planning than assuming maturity based on a few posted tools. Smaller and newer programs often benefit even more from dimension-level scoring, because it prevents the common early mistake of investing heavily in visual management while problem-solving discipline and leader standard work are left completely undeveloped. Starting with an honest low score and a focused roadmap on the one or two dimensions that matter most tends to produce faster real progress than a broad, unscored push across every lean tool at once.
Replace the Wall of 5S Posters With a Real Maturity Score
iFactory's continuous improvement platform is built to run the dimension-by-dimension scoring, track roadmap ownership, and re-score on a defined cadence so gains are proven, not assumed. Book a walkthrough to see it against your own plant's data.