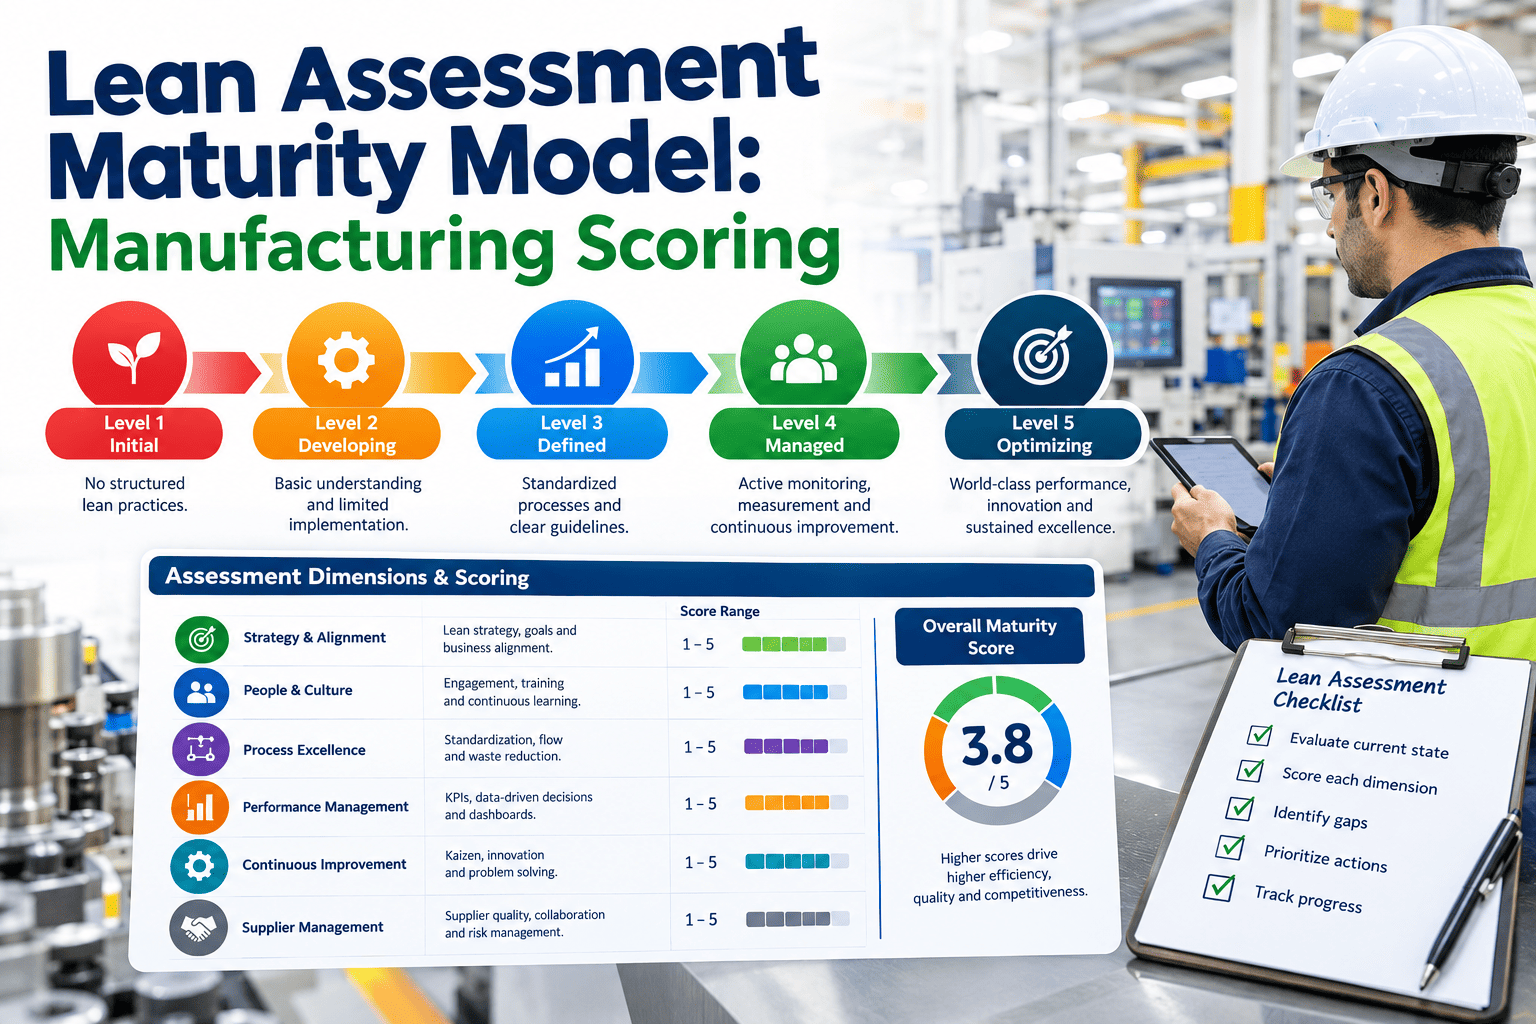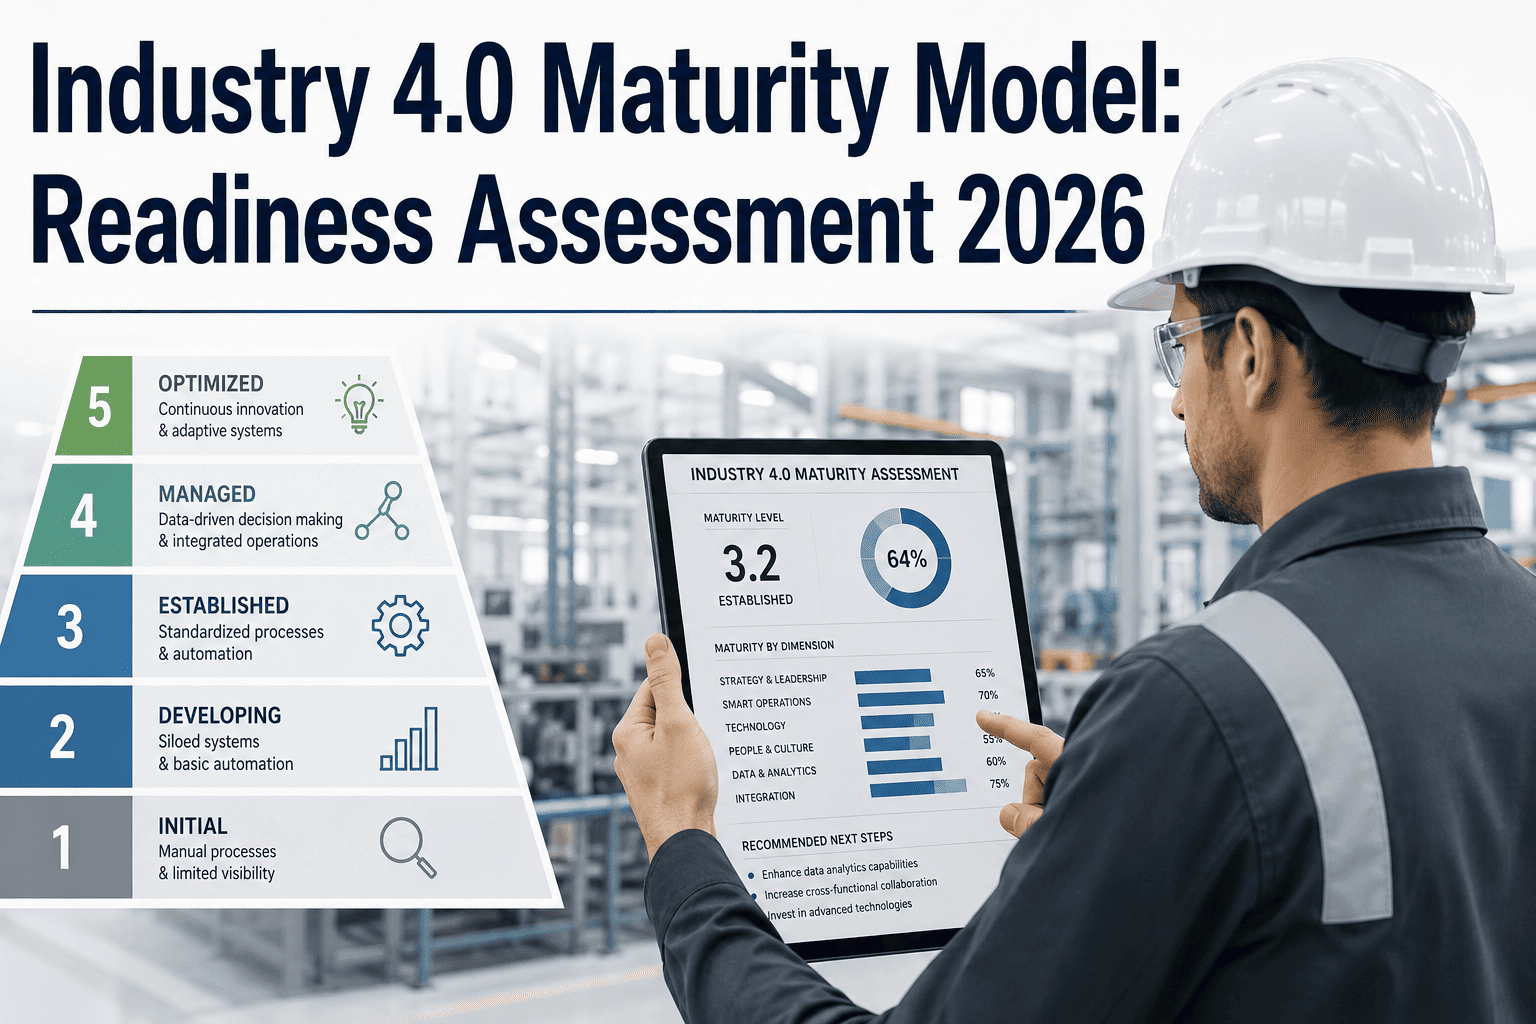
Every plant leader has a gut feeling about how "digital" their operation really is, and that feeling is usually wrong in one direction or the other. A plant with three dashboards and a data lake can still be operationally blind if nobody trusts the numbers enough to act on them, while a plant running on paper travelers can be closer to Industry 4.0 than it looks if its workforce and strategy discipline are further along than its technology stack. A maturity model exists to replace that gut feeling with a structured score, one that tells you exactly which of six dimensions is holding transformation back and which is already ahead of the rest. See how ifactory support runs this assessment for manufacturing teams.
Score Your Plant's Industry 4.0 Maturity Across Six Dimensions
Connectivity, analytics, automation, workforce, security, and strategy, each scored on the same five-level scale, so you know exactly where to invest next instead of guessing based on which vendor called last.
Why Most Plants Misjudge Their Own Maturity
Ask an operations director how digitally mature their plant is and the answer usually centers on whatever project shipped most recently, a new SCADA rollout or a predictive maintenance pilot. That is a technology snapshot, not a maturity score, and it misses the dimensions that determine whether the technology actually sticks. A plant can have excellent connectivity and still stall out because the workforce was never trained to trust the data, or because security was bolted on so late that IT refuses to expand the network. Maturity models exist precisely to catch these blind spots by scoring every dimension independently instead of letting the most visible project stand in for the whole operation.
The Five Levels Every Dimension Is Scored Against
Scoring only matters if the scale means the same thing across every dimension, so each of the six areas is measured against the same five levels. A plant rarely sits at one level across the board; the real value of the assessment is seeing exactly which dimension is dragging the overall score down and by how much.
What Each Dimension Actually Measures
Reading a maturity score without understanding what sits behind each dimension leads to the wrong investment decision. A low automation score, for example, calls for a different fix than a low workforce score, even though both might drag the overall number down by the same amount.
What the Data Says About Where Most Plants Actually Stand
Benchmark data across manufacturing plants consistently shows a wide gap between digital ambition and digital execution. Most manufacturers report active Industry 4.0 initiatives underway, yet a much smaller share have a documented, phased implementation roadmap with clear milestones attached to it, which is exactly the strategy dimension this assessment is designed to catch. That gap between activity and structure is where budget gets spent without a proportional return, and it is the single most common finding across plants that complete a structured maturity assessment for the first time.
Curious how your plant compares to these benchmarks? Share your current setup with our team and we will map your score against the wider dataset.
Find Out Where Your Plant Sits on Each of the Six Dimensions
A structured assessment usually takes less time than the meeting it would take to argue about it internally. We will walk your team through the scoring live.
Turning a Score Into a Roadmap
A maturity score is only useful if it changes what gets funded next. The plants that get the most value from this exercise do not try to fix all six dimensions at once; they identify the one or two dimensions with the lowest score and the highest operational cost, and sequence investment against those first, re-scoring every few months to confirm the gap is actually closing.
Ranking dimensions by operational cost rather than by how easy they are to fix is what separates a roadmap that moves the needle from one that just looks busy. A low workforce score tied to frequent manual overrides that slow every changeover carries a very different cost than a low strategy score that mostly shows up as awkward planning meetings, even though both might read as the same numeric gap on a scorecard. Weighting each dimension's gap against what it is actually costing in downtime, scrap, or rework gives leadership a defensible order of operations instead of a list sorted by whichever department argued loudest for budget.
| Level | What It Looks Like on the Floor | Typical Next Step |
|---|---|---|
| Level 1-2 | Operators manually adjust setpoints based on experience, with no automated feedback loop | Introduce basic closed-loop control on one pilot line |
| Level 3 | Automated control exists on most lines but still requires manual overrides during changeovers | Standardize changeover logic across all lines running the same equipment class |
| Level 4 | Systems adjust automatically to most conditions, with alerts only for genuine exceptions | Extend automated adjustment to remaining manual exception categories |
| Level 5 | Predictive models anticipate conditions and adjust before a deviation occurs | Focus on continuous model retraining as products and equipment change |
Mistakes That Make a Maturity Assessment Useless
The most common mistake is letting one enthusiastic department answer the whole survey, so a plant with an excellent analytics team but a disengaged workforce ends up with an artificially high overall score that does not reflect reality on the floor. A second mistake is treating the assessment as a one-time report card instead of a recurring checkpoint, which means the score goes stale the moment the next reorganization or system upgrade happens. A third mistake is scoring dimensions in isolation without connecting the result to operational cost, so a plant might chase a low security score that carries little near-term risk while ignoring a mediocre automation score that is quietly costing real money every shift. Assessments hold their value only when multiple roles across the plant contribute honestly, the exercise repeats on a set cadence, and every score is tied back to what it is actually costing the business to stay at that level.
A fourth mistake worth naming separately is skipping the security dimension because it feels like an IT problem rather than an operations one. Every connectivity and automation gain widens the plant's attack surface, and a maturity model that scores connectivity and analytics highly while ignoring how those systems are segmented and access-controlled is measuring capability without measuring risk. The strongest assessments treat security as a gating dimension, one that can cap how far a plant is credited for progress elsewhere until the underlying network architecture catches up.
A fifth mistake is comparing scores across plants with fundamentally different operating models without adjusting for context. A continuous-process plant running one product around the clock has a very different automation ceiling than a high-mix, low-volume plant that changes over dozens of times a week, and holding both to an identical target score ignores that reality. The assessment works best when leadership agrees on a realistic target level per dimension for each plant type before scoring begins, so the conversation afterward is about closing an agreed gap rather than debating whether the target itself was fair in the first place.
How This Differs From Generic Digital Transformation Scorecards
Generic digital transformation scorecards tend to lump technology, culture, and strategy into a single composite number, which sounds convenient but hides exactly the information a plant needs to act. A composite score of sixty percent tells you almost nothing about whether the gap is in connectivity, workforce trust, or strategic sequencing, and it invites teams to spend money on whichever dimension is easiest to fund rather than the one that is actually limiting output. Scoring the six dimensions independently, and refusing to average them into one headline number, forces the harder but more useful conversation about which specific capability is the actual constraint.
This distinction matters most when a plant is comparing itself against sister sites or industry benchmarks. Two plants can post the same composite score of sixty percent while one is strong on automation and weak on workforce adoption, and the other is the exact opposite. Treating those two plants the same way, funding the same initiative at both, would help one and waste money at the other. A dimension-level score keeps that difference visible instead of averaging it away, which is why the plants that get the most out of this exercise resist the temptation to reduce it to a single grade for a leadership slide.
Frequently Asked Questions
Get a Six-Dimension Maturity Score for Your Plant
Bring your current systems and team structure to the call. We will score connectivity, analytics, automation, workforce, security, and strategy, and show you what to fund first.