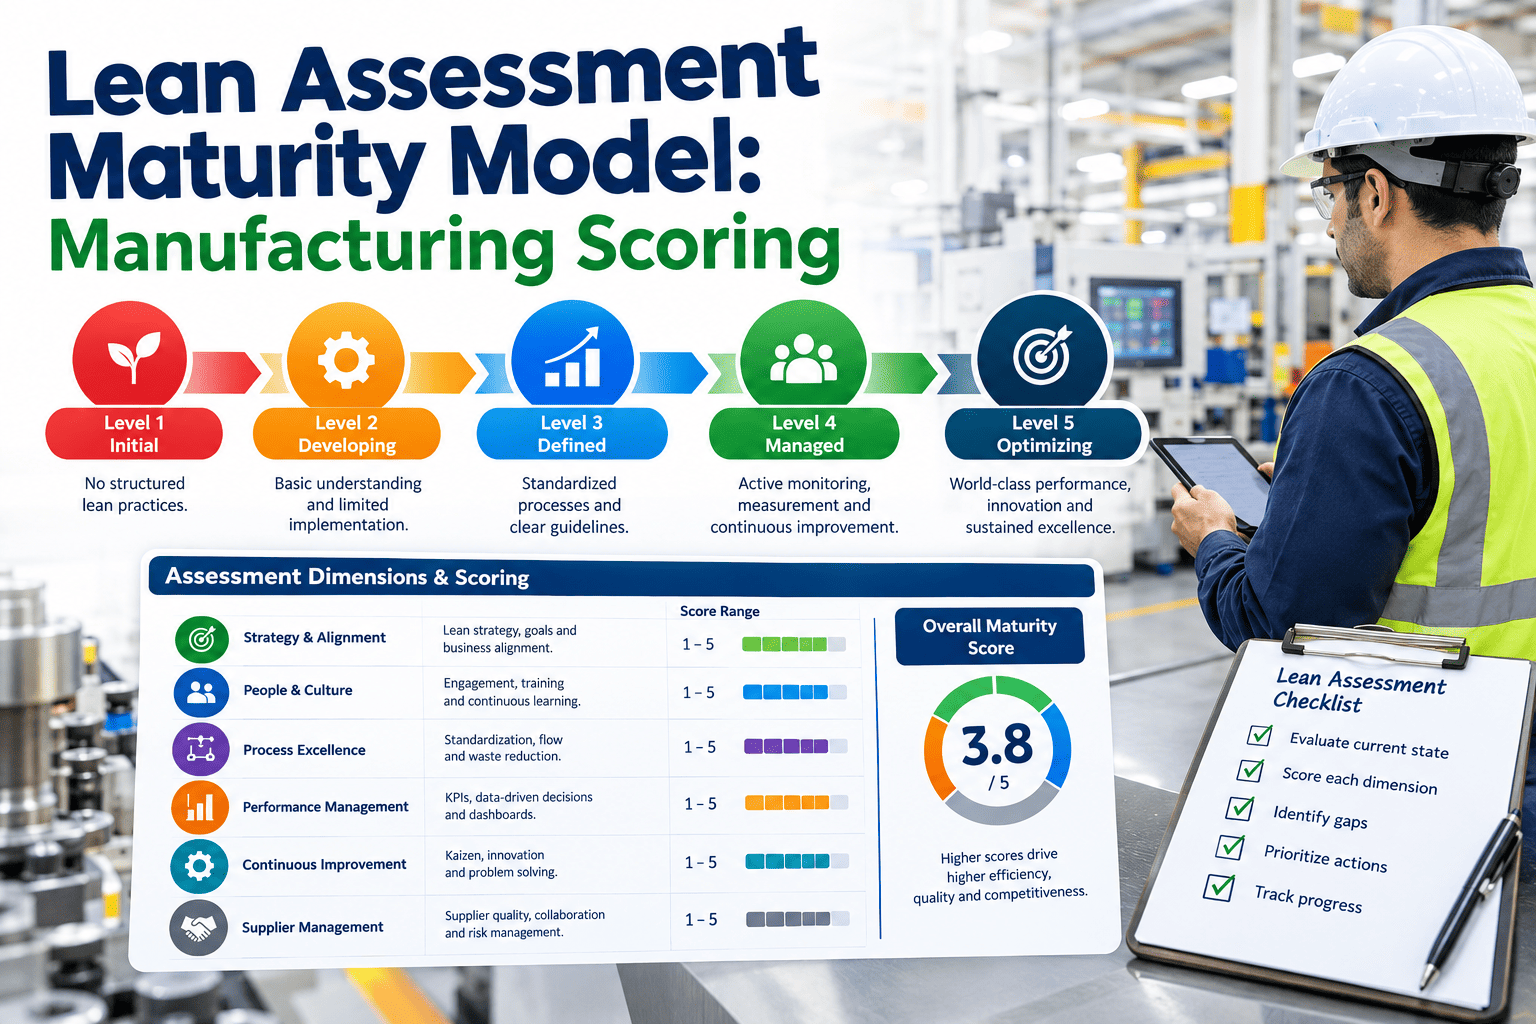
Most manufacturing leaders can describe their plant's digital state in a sentence, but few can score it in a way that actually guides next year's budget. "We have some sensors and a dashboard" isn't a maturity level, it's a shrug, and shrugs don't win capital investment against competing projects. A structured digital maturity assessment replaces that shrug with a defensible score, a clear gap list, and a roadmap that ties each investment to a measurable jump in capability. If you're not sure where your plant actually sits, our team can walk through a maturity scoring exercise with you.
Digital Transformation Planning
Manufacturing Digital Maturity Assessment & Roadmap
Technology adoption scoring, capability gap mapping, and investment prioritization to turn a vague digital ambition into a funded roadmap.
Why "Digital" Isn't a Yes-or-No Question
Ask whether a plant is digital and you'll get very different answers depending on who's asked. A maintenance lead might point to a CMMS as proof of digital maturity, while a data scientist looking at the same plant sees disconnected systems with no shared data model underneath them. Maturity assessment resolves that disagreement by breaking "digital" into specific, scorable capabilities instead of a single fuzzy label.
Level 1
Manual
Paper logs, spreadsheets, and tribal knowledge drive most operational decisions with little digital record.
Level 2
Connected
Core systems like MES and SCADA exist but largely operate as separate silos with limited integration.
Level 3
Integrated
Systems share a common data layer, enabling cross-functional reporting and consistent metrics.
Level 4
Predictive
Data feeds predictive models for maintenance, quality, and scheduling rather than only historical reporting.
Level 5
Autonomous
Systems recommend and, in defined cases, execute adjustments with minimal manual intervention.
The Capability Areas a Real Assessment Covers
A useful maturity assessment doesn't produce one overall score — it scores several capability areas independently, because most plants are uneven. A facility can be highly mature in production data collection while still being nearly manual in quality and maintenance data, and that unevenness is exactly what a roadmap needs to target.
Data Infrastructure
How connected and centralized production, quality, and maintenance data actually are across the plant today.
Process Digitization
How much of daily work still depends on paper, spreadsheets, or manual handoffs versus digital workflows.
Analytics Capability
Whether the plant can move beyond historical reporting into predictive and prescriptive analytics.
Workforce Readiness
Whether staff have the skills and trust in digital tools needed to actually use new capability once deployed.
Scoring Technology Adoption Honestly
| Capability Area | Common Score Range | Typical Gap Found |
|---|
| Data Infrastructure | Level 2–3 | Systems connected but not sharing a common data model |
| Process Digitization | Level 1–2 | Paper logs still used for downtime and quality |
| Analytics Capability | Level 2 | Reporting is historical, not predictive |
| Workforce Readiness | Level 2–3 | Tools exist but adoption is inconsistent across shifts |
Want an honest score for your own plant across these areas? Talk to our team about a maturity assessment.
Turning a Score Into a Roadmap
A maturity score by itself is just a diagnostic. The value comes from translating each identified gap into a specific, sequenced investment, so leadership can see exactly what closing the gap requires and what capability it unlocks in return.
1
Score
Assess each capability area against a defined maturity scale using real plant evidence.
2
Prioritize
Rank gaps by impact and feasibility rather than tackling every area simultaneously.
3
Sequence
Order investments so foundational capability is in place before dependent capability is attempted.
4
Fund
Build a phased business case tied to measurable capability gains at each stage.
Investment Prioritization: What Should Come First
Most plants are tempted to fund the most visible or exciting technology first — a predictive maintenance pilot, for instance — before the underlying data infrastructure can actually support it. A disciplined roadmap resists that instinct and prioritizes foundational gaps first, even when they're less exciting than the capability they eventually enable.
Fix Data Foundations First
Predictive analytics built on fragmented, inconsistent data tends to produce unreliable results that erode trust in the whole program.
Target the Widest Gaps
Capability areas scoring lowest usually offer the largest improvement per dollar invested, compared to areas already reasonably mature.
Build Quick, Visible Wins
Early roadmap phases should include at least one fast, visible improvement to build organizational confidence in the program.
Match Pace to Readiness
Rolling out capability faster than the workforce can adopt it tends to produce shelfware rather than real operational change.
What Maturity Progress Looks Like Over Time
Clearer
Understanding of true capability gaps
Sequenced
Investment tied to measurable outcomes
Sustained
Adoption instead of stalled pilots
Ready to see a maturity roadmap built against your own plant's current state? Book a 30-minute walkthrough with our team.
Common Reasons Digital Transformation Roadmaps Stall
Skipping the Assessment
Jumping straight to technology selection without scoring current capability leads to solutions that don't match the actual gap.
Chasing Every Area at Once
Trying to advance every capability area simultaneously spreads budget and attention too thin to move any of them meaningfully.
Ignoring Workforce Readiness
Technology rollouts that outpace training and trust tend to get quietly abandoned by the floor within months.
No Re-Assessment Cadence
A maturity score taken once and never revisited stops reflecting reality as the plant and technology landscape both evolve.
How Assessments Are Actually Conducted
A credible maturity assessment combines several evidence sources rather than relying on a single survey or interview. The goal is to score what's actually happening on the floor, not what's documented in a policy that may no longer reflect daily practice.
System Audit
A direct review of what systems exist, how they're configured, and whether they actually share data with each other today.
Shift-Level Interviews
Conversations with operators and supervisors across shifts reveal gaps between documented process and daily reality.
Data Quality Sampling
Spot-checking actual data output against expected values exposes silent quality issues that a system review alone would miss.
Benchmark Comparison
Comparing scores against similar plant types provides useful context without treating the benchmark as a hard target.
A Sample Roadmap Timeline
While every plant's roadmap should reflect its own assessment results, a typical phased structure gives a useful sense of pacing for how capability tends to build over time.
| Phase | Timeframe | Typical Focus |
|---|
| Foundation | 0–6 months | Data infrastructure and system integration gaps |
| Digitization | 6–12 months | Replacing remaining paper and manual workflows |
| Analytics | 12–18 months | Introducing predictive models on top of clean data |
| Optimization | 18–24 months | Expanding predictive capability and workforce adoption |
Want a roadmap timeline built specifically around your assessment results? Book a demo to walk through it.
Frequently Asked Questions
How long does a digital maturity assessment typically take to complete?
A focused assessment across the core capability areas can usually be completed in a matter of weeks, depending on how many sites and systems are in scope and how available current documentation is. The process involves both a review of existing systems and structured conversations with staff across shifts, since actual usage often differs from what's documented.
Our team can scope a realistic timeline for your specific plant.
What's a realistic maturity level for a typical manufacturing plant today?
Most plants score somewhere between connected and integrated across their capability areas, with meaningful unevenness between areas rather than one consistent level. It's uncommon and not necessarily expected for every capability area to be at the predictive or autonomous level, and a roadmap should reflect a realistic, sequenced path rather than an assumption that every gap needs closing immediately.
Does a low maturity score mean the plant is behind competitors?
Not necessarily — maturity scoring is most useful as an internal benchmark to guide investment sequencing, rather than a direct competitive comparison, since plant types, products, and constraints vary too much for a single external benchmark to be meaningful. What matters more is whether the roadmap built from the score is closing gaps at a pace that supports the plant's actual operational and cost goals.
Should the roadmap prioritize technology that's easiest to deploy or highest impact?
The strongest roadmaps balance both by sequencing at least one fast, low-friction win early to build organizational momentum, while still prioritizing the foundational gaps that higher-impact capability will eventually depend on. Chasing only high-impact projects without early wins can stall a program before it gains internal support, while chasing only easy wins can leave the biggest gaps untouched.
How often should a plant re-run its maturity assessment?
An annual re-assessment is a reasonable default for most plants, since technology, staffing, and operational priorities shift enough over a year to meaningfully change the picture. Plants in the middle of an active transformation roadmap may benefit from checking progress more frequently against the specific capability areas being targeted.
Book a demo to see how ongoing maturity tracking typically works.
Know Your Score. Fund the Right Gaps.
Get a Real Digital Maturity Score for Your Plant
Bring your current systems and processes. We'll help you score your capability gaps and build a roadmap tied to measurable outcomes.