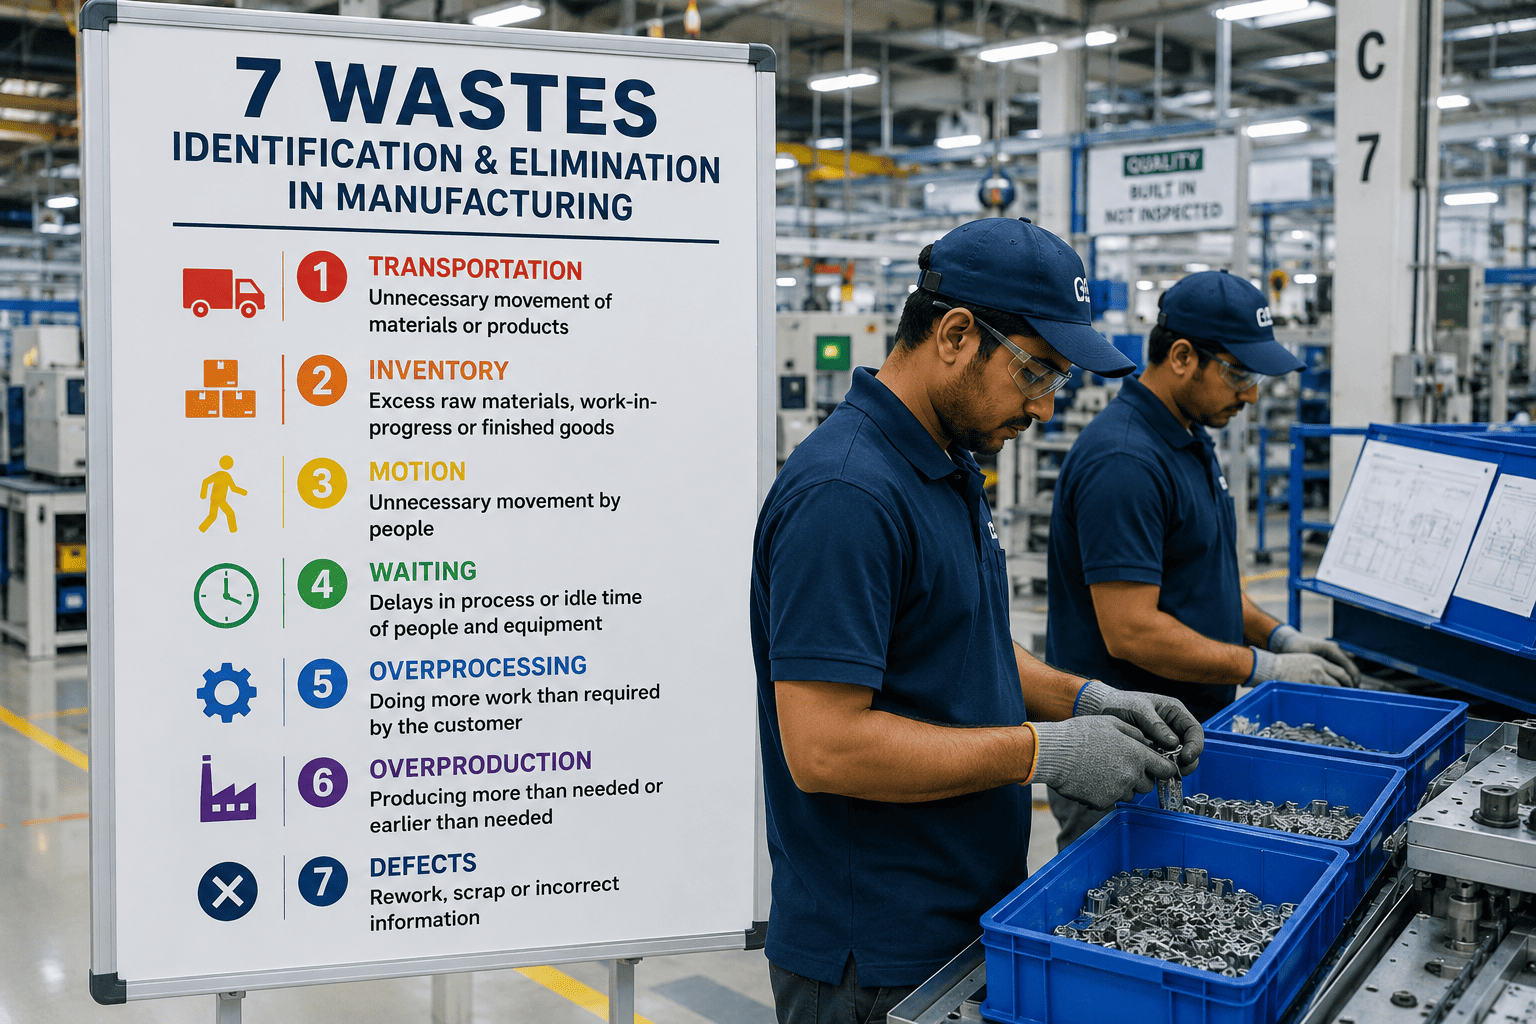
Every plant pays a hidden tax that never shows up as a single line on the P&L — it is scattered across overtime hours, forklift trips, stacked pallets, and rework tickets that everyone treats as "just how the line runs." Taiichi Ohno named this tax muda, and he grouped it into seven categories so that shop floors could finally see what had always been invisible. Manufacturers who learn to spot these seven wastes stop treating scrap, waiting, and excess motion as the cost of doing business and start treating them as a solvable engineering problem. This piece walks through each of the seven wastes with plant-floor symptoms, a practical way to tell necessary work from pure waste, and the elimination sequence that actually sticks, and teams who want a structured waste-finding exercise on their own line can start that conversation with iFactory's support team.
The Seven Wastes Are Costing You More Than Your Scrap Report Shows
Muda hides inside "normal" operations — a forklift run that always happens, a stack of WIP that always sits there, a rework station nobody questions. iFactory turns those invisible patterns into a ranked, dollarized waste list your team can actually act on.
Why "Busy" and "Productive" Are Not the Same Thing
A line can run at full headcount, full machine utilization, and still be drowning in waste. Lean manufacturing separates every activity into three buckets: value-added work the customer would actually pay for, necessary non-value-added work that today's process still requires, and pure waste that adds nothing and can be attacked immediately. Most plants that have never run a formal waste walk discover that value-added work is a surprisingly small slice of the total time a part spends on the floor — the rest is muda wearing a work order.
The Seven Wastes, One by One
Each of the seven wastes has its own fingerprint on the shop floor. Learning to recognize the fingerprint — not just the textbook definition — is what turns a waste walk from a theoretical exercise into a list of fixable problems by next shift.
Overproduction
Making more, sooner, or faster than the next process actually needs. This is the waste Ohno called the worst of the seven because it manufactures all the others behind it — extra parts need extra storage, extra handling, extra counting, and extra inspection that may never even ship.
Waiting
Operators standing idle for a machine cycle, a missing part, a late changeover, or an upstream bottleneck. Waiting is the easiest waste to see and the easiest to misdiagnose — the visible symptom is idle people, but the root cause almost always sits somewhere else in the line.
Transport
Moving materials, WIP, or finished goods farther than the process genuinely requires. Transport adds zero value to the product and adds real risk — every extra handoff is another chance for damage, delay, or a part getting lost in a queue nobody owns.
Overprocessing
Doing more work, tighter tolerances, or extra finishing than the customer specification actually calls for. Overprocessing is the waste teams are proudest of, because it usually looks like craftsmanship — until someone compares it against what the spec sheet actually says.
Inventory
Raw material, WIP, or finished goods sitting beyond what the next process needs right now. Inventory hides every other problem in the plant — a machine that's slowly degrading, a supplier that's slipping, a quality issue that hasn't surfaced yet — because there's always a buffer to absorb the shock.
Motion
Unnecessary movement by people — reaching, bending, walking, searching — that doesn't advance the product. Motion waste is exhausting in a way inventory waste is not: it shows up directly as fatigue, ergonomic injury risk, and operators who are busy without being productive.
Defects
Producing anything that fails to meet specification, whether it is scrapped, reworked, or — worst of all — shipped. Defects are the most expensive waste per unit because they carry every cost the part already absorbed: material, labor, energy, and handling, with nothing to show for it.
The Eighth Waste Most Teams Add Today
Many modern lean programs recognize an unofficial eighth waste: underutilized skills and talent — the experience, ideas, and problem-solving ability of frontline operators that never reach the people who could act on them. It doesn't fit neatly into Ohno's original seven, but on a floor where the best fix for a recurring jam came from the operator who runs the machine every day, ignoring that input is its own form of muda.
See Your Own Seven Wastes, Ranked by Dollar Impact
iFactory pulls machine, labor, and material-flow data into a single waste view, so instead of guessing which of the seven is costing the most, your team gets a ranked list to attack first.
Muda, Mura, and Muri — Why Waste Doesn't Travel Alone
The seven wastes rarely appear in isolation. Toyota's founders paired muda with two related ideas — mura (unevenness) and muri (overburden) — because waste is often a symptom of one of the other two rather than a standalone problem. Fixing the visible muda without addressing the mura or muri behind it is why some kaizen events don't hold past the first quarter.
Waste
Any of the seven activities above — work that consumes resources without adding value the customer will pay for.
Unevenness
Workload that swings between overloaded and idle — a schedule that dumps a month's orders into the last week creates waiting upstream and overproduction downstream.
Overburden
Pushing people or equipment past a sustainable pace — the defects, breakdowns, and motion waste that follow are muda caused directly by muri.
The Five-Step Sequence That Actually Removes Waste
Spotting waste is the easy half. Removing it in a way that doesn't quietly grow back requires working the root cause, not just the symptom that's visible today.
Map the current state
Build a value stream map from raw material to shipment, recording cycle time, wait time, WIP levels, and defect rate at every step — the numbers, not memory, are what expose where time actually goes.
Classify every step
Tag each activity as value-added, necessary Type 1 waste, or pure Type 2 waste. Type 2 items are the immediate targets — there is no trade-off to removing them.
Trace the root cause
Run a 5-Why chain on the waste that shows up most often. A stack of WIP is a symptom; an unreliable upstream machine or an oversized batch policy is usually the actual cause underneath it.
Redesign the flow, not just the station
Fixes that only touch one workstation tend to move the bottleneck rather than remove it. Rebalance cycle times, resize batches, and reposition material at the line level, not the machine level.
Standardize and re-measure
Lock the new method into a standard work instruction and re-run the value stream map on a set cadence. Waste that isn't monitored has a way of quietly rebuilding itself within a few months.
Identification-to-Elimination Reference Table
A quick-reference view of the shop-floor symptom for each waste, the tool that typically surfaces it, and the improvement lever that removes it.
| Waste | Shop-Floor Symptom | Tool That Surfaces It | Primary Elimination Lever |
|---|---|---|---|
| Overproduction | Pallets of finished goods with no order attached | Value stream mapping, pull-signal audit | Kanban and pull-based scheduling |
| Waiting | Operators idle between cycles or changeovers | Line balancing study, OEE downtime log | Cycle-time balancing, quick-changeover (SMED) |
| Transport | Forklift and cart traffic crossing the same path repeatedly | Spaghetti diagram | Cell layout redesign, point-of-use storage |
| Overprocessing | Extra finishing steps not on the customer spec | Process capability review vs. print | Spec verification, tooling upgrade |
| Inventory | WIP piling up between two workstations | WIP-to-cycle-time ratio tracking | Batch-size reduction, supplier reliability program |
| Motion | Operator walking to a shared tool crib repeatedly per shift | Time-and-motion study, 5S audit | Workstation redesign, point-of-use tooling |
| Defects | Recurring rework at the same station or defect code | Pareto of defect codes, SPC charts | Root cause analysis, poka-yoke error-proofing |
A Composite Line: Where the Waste Was Actually Hiding
A mid-size fabrication line was running at 94% machine utilization and still missing its weekly shipment target. Leadership assumed the answer was more capacity, but a value stream mapping session told a different story.
The map showed that value-added cutting and welding time made up barely 12% of a part's total time on the floor. The rest was overproduction from a batch-size policy set years earlier, WIP sitting between two stations with mismatched cycle times, and a defect rework loop that consumed one full shift's worth of capacity every week. None of it showed up in the utilization number, because the machines were, in fact, busy — just often busy producing waste.
The fix wasn't more equipment. Rebalancing cycle times between the two mismatched stations removed most of the waiting, cutting the batch size in half cut WIP without touching output, and a root-cause investigation traced the recurring rework to a single worn fixture rather than an operator skill gap. Within ten weeks, the line hit its shipment target with the same headcount and no new capital.
Signs Your Plant Is Carrying More Muda Than It Realizes
Utilization looks good but shipments still slip
High machine utilization measures whether equipment is running, not whether it is running on the right work at the right time — a classic sign that overproduction or unbalanced flow is hiding behind a healthy-looking number.
The same defect code reappears every month
A recurring defect that keeps getting "fixed" without disappearing usually means the corrective action addressed a symptom, not the root cause identified through a proper 5-Why or fishbone analysis.
Nobody can say why a batch size is what it is
Batch sizes set years ago and never revisited are a common source of both overproduction and excess inventory, and are often the single fastest waste to reduce once questioned.
Operators walk more than they work
If a simple time-and-motion observation shows operators spending a meaningful share of their shift walking to parts, tools, or a shared station, motion waste is quietly eating capacity that looks like it belongs to production.
Mistakes That Keep Waste Reduction From Sticking
Attacking the Visible Waste Instead of the Root Waste
Reducing a pile of WIP without fixing the batch-size or cycle-time mismatch behind it just moves the pile — the underlying cause reproduces the same waste within weeks.
Running a One-Time Kaizen Event Instead of a Standard
A three-day improvement blitz without a locked-in standard work instruction and a re-measurement cadence tends to drift back toward the old way of working once attention moves elsewhere.
Treating All Seven Wastes as Equally Urgent
Not every waste costs the same on every line. Ranking the seven by actual dollar or capacity impact before assigning improvement resources avoids spending a quarter fixing a low-impact waste.
Ignoring Mura and Muri Behind the Muda
Removing waste from a station that's still being scheduled unevenly or pushed past a sustainable pace usually means the same waste reappears somewhere else on the line within a few cycles.
Leaving Operators Out of the Waste Walk
The people running the process daily usually know exactly where the waste is before any study confirms it — skipping their input is its own form of the eighth waste, underutilized talent.
Measuring Success by Activity Instead of Flow
A line can look busier after an improvement and still be no closer to shipping faster. Track total flow time and value-added ratio, not just local activity counts, to know if waste actually left the system.
Frequently Asked Questions
What are the seven wastes of lean manufacturing?
The seven wastes, also called muda, are overproduction, waiting, transport, overprocessing, inventory, motion, and defects — a framework first defined inside the Toyota Production System by Taiichi Ohno. Each represents a category of activity that consumes labor, material, or time without adding anything the customer would pay for, and together they account for the large majority of non-value-added work found in most manufacturing operations. Many modern lean programs also track an unofficial eighth waste: underutilized skills and talent among frontline operators. Teams building out a structured waste-tracking approach on their own line can walk through the framework with iFactory's support team.
Which of the seven wastes should a plant tackle first?
There is no universal answer, because the highest-impact waste differs by line, product mix, and current bottleneck — but overproduction is the most common starting point because Taiichi Ohno considered it the root waste that triggers most of the other six. A value stream mapping exercise that quantifies time and cost by waste category, rather than relying on intuition, is the most reliable way to rank which waste is actually costing the most on a specific line before committing improvement resources to it.
What is the difference between Type 1 and Type 2 muda?
Type 1 muda is necessary non-value-added work that today's process still depends on — required inspection steps or mandated documentation, for example — while Type 2 muda is pure waste that can be removed immediately with no downside, such as searching for a misplaced tool or reworking a preventable defect. The distinction matters because it tells a team where to spend improvement effort first: Type 2 waste offers immediate, low-risk wins, while Type 1 waste usually requires a process or system redesign to remove safely.
How is muda different from mura and muri?
Muda is waste itself — the seven categories of non-value-added activity. Mura is unevenness, such as a production schedule that swings between idle periods and overloaded rushes, and muri is overburden, such as running equipment or people past a sustainable pace. The three are connected: uneven scheduling (mura) commonly forces overburden (muri), and overburden commonly produces the defects, breakdowns, and waiting that show up as visible muda, which is why lasting waste reduction usually has to address all three together rather than the waste alone.
Can waste reduction be tracked continuously instead of through periodic audits?
Yes, and doing so is increasingly common on lines that already collect machine, labor, and material-flow data — a periodic waste walk finds what changed since the last audit, while continuous tracking flags waiting, overproduction, or defect patterns as they happen rather than weeks later. iFactory's platform is built to surface this kind of ranked, ongoing waste view for manufacturing teams, and interested plants can book a demo to see how continuous waste tracking would look on their own line.
Turn Muda From a Training Slide Into a Working Elimination Plan
iFactory connects machine, labor, and flow data so your team can see which of the seven wastes is actually costing the most — and track whether the fix held. Book a walkthrough to see it running on a line like yours.