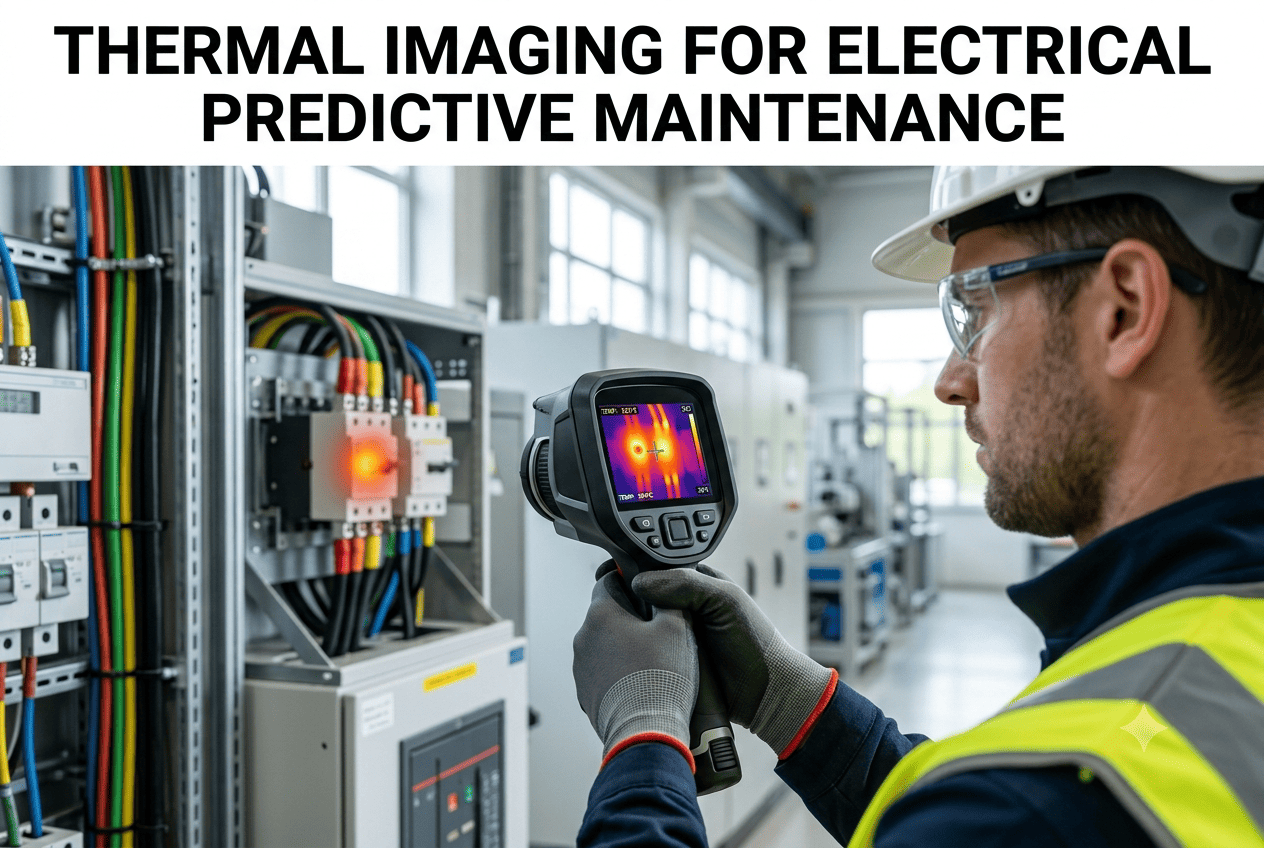
An electrical connection running ten degrees hotter than its neighbors rarely trips a breaker on day one, but the resistance at that joint keeps climbing until an arc flash event turns a maintenance ticket into an evacuation. Infrared thermography catches that rising temperature long before insulation degrades or a bearing seizes, because heat is often the very first measurable signal a failing component gives off. Applied consistently across electrical panels, motors, and bearings, a thermal scanning program turns invisible heat buildup into a ranked list of components that need attention this week versus this quarter. Facilities building out a structured thermography program can book a demo to see severity classification applied to a real thermal scan.
PREDICTIVE MAINTENANCE · THERMAL INSPECTION · 2026
See the Heat Before It Becomes a Failure
Infrared thermography for electrical panels, motors, and bearings that turns hot spot detection into a scheduled, severity-ranked maintenance program.
Three Assets Where Heat Tells the Story First
Electrical panels, motor windings, and bearing housings each generate a distinct thermal signature well before the fault becomes visible through any other inspection method.
Electrical Panels
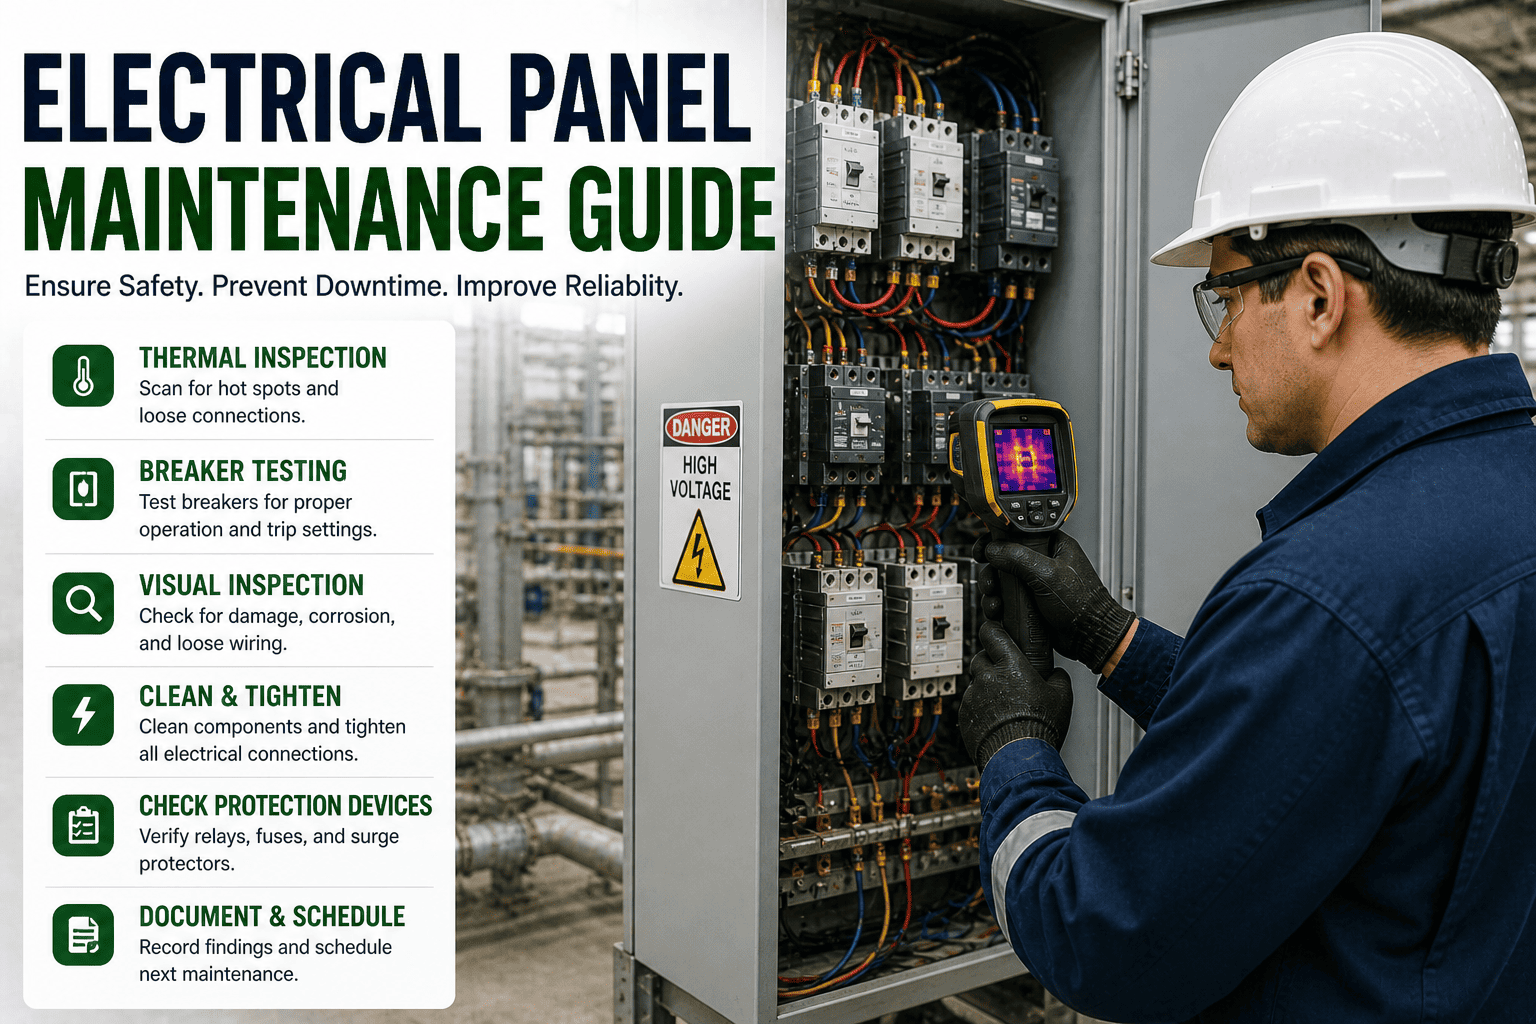
Loose lugs, corroded connections, and overloaded breakers show up as localized hot spots on a connection point that reads well above ambient and above its identical neighbors on the same bus.
Motor Windings & Frames
Insulation breakdown, phase imbalance, and cooling fan degradation raise winding and frame temperatures unevenly across the motor body, visible well before a current signature changes.
Bearing Housings
Lubrication failure and early-stage bearing wear generate friction heat at the housing surface that trends upward over days, ahead of any audible or vibration-based warning.
Thermal Severity Classification Used in the Field
Every thermographer works from a version of the same severity scale, comparing a component's temperature rise above ambient or above a matched reference point rather than judging an absolute number in isolation.
Minor · 1-10°C rise
Moderate · 10-20°C rise
Serious · 20-40°C rise
Critical · 40°C+ rise
Minor
Log the reading and re-check at the next scheduled scan, no immediate action required.
Moderate
Schedule repair at the next planned maintenance window and increase scan frequency on that component.
Serious
Plan repair as soon as practical, generally within days, since the trend is likely to keep rising under load.
Critical
Treat as an immediate safety concern, de-energize or reduce load where possible until repaired.
Recommended Scan Intervals by Asset Criticality
| Asset Class | Recommended Interval | Primary Fault Indicator |
| Main Distribution Panels |
Quarterly, or continuous with fixed IR sensors |
Localized connection hot spots above ambient |
| Critical Production Motors |
Monthly to quarterly depending on load profile |
Uneven winding and frame temperature distribution |
| Bearing Housings |
Combined with vibration route, monthly |
Rising surface temperature trend over successive scans |
| Non-Critical Panels & Motors |
Annually or semi-annually |
Baseline comparison against prior year scan |
The Physics Behind Every Thermal Reading
Infrared cameras do not measure temperature directly, they measure infrared radiation emitted from a surface and convert that radiation into a temperature value using an assumed emissivity for the material being scanned. This distinction matters enormously in practical electrical and mechanical inspection, because emissivity varies widely between a painted steel panel surface, a bare copper bus bar, and an insulated cable jacket. A technician scanning a shiny bare metal connection without correcting for its low emissivity will read a temperature well below the component's true value, potentially missing a genuinely serious fault. This is why experienced thermographers apply reference tape with a known, high emissivity to bare metal components they intend to monitor regularly, ensuring the reading reflects reality rather than an artifact of the surface finish.
Load correlation is the second variable that separates a useful thermal reading from a misleading one. A motor or panel component's temperature rises roughly with the square of the current flowing through it, which means the same connection can show a dramatically different thermal reading depending on whether it was scanned at ten percent load or ninety percent load. Mature thermography programs record the load percentage at the time of every scan and normalize temperature rise findings back to a common load reference, typically full rated load, before comparing readings across different inspection dates. Without this normalization, a component that looks like it is trending toward failure might simply be reflecting a facility that happened to be running harder on the day of the more recent scan.
Distance and angle to the target introduce a third source of measurement variation worth controlling for consistency. Infrared cameras have a defined field of view and spatial resolution, and scanning the same connection point from a different distance or angle between visits changes the effective area being averaged into the reading, which can shift the apparent temperature even when nothing about the component itself has changed. Establishing fixed scan positions and distances for the most critical monitoring points, particularly on panels and motors that are part of a formal trending program, removes this variable and ensures that a genuine upward trend reflects an actual change in the equipment rather than a change in how it was photographed.
Taken together, these three variables, emissivity correction, load normalization, and consistent scan geometry, are what separate a thermography program that produces reliable trend data from one that generates a folder of impressive-looking images with limited diagnostic value. Facilities building a scanning program for the first time often underestimate how much of the value comes from this underlying discipline rather than from the camera hardware itself.
Scheduled Thermography vs Reactive Inspection
Scheduled Thermal Scanning
Hot spots caught and classified before insulation fails
Severity trend data supports planned repair scheduling
Arc flash and fire risk reduced through early correction
No baseline temperature data exists for comparison
Reactive Inspection Only
Fault typically discovered only after a trip or failure
Repairs happen under unplanned downtime conditions
Building a Thermography Program in Four Stages
Stage 1
Baseline Scan
Every panel, motor, and bearing housing in scope is scanned once under normal load to establish a reference temperature profile.
Stage 2
Interval Assignment
Each asset is assigned a scan frequency based on criticality, load variability, and consequence of failure if the fault progresses undetected.
Stage 3
Trend Comparison
Every subsequent scan is compared automatically against the baseline and against the asset's own historical readings to catch a slow upward trend.
Stage 4
Severity-Ranked Action
Findings are classified into minor, moderate, serious, or critical, and routed to the maintenance queue with the appropriate urgency.
ELECTRICAL & MECHANICAL RELIABILITY
Turn Thermal Scans Into a Scheduled Program
See how automated severity classification would rank your last panel and motor scan results.
Building the Case Internally for a Formal Scanning Program
Facilities without an existing thermography program often need to justify the investment before rolling one out, and the strongest case usually comes from documenting what a single avoided event is worth rather than trying to estimate an abstract program-wide return. An unplanned outage on a main distribution panel caused by an undetected connection failure typically costs far more in lost production time and emergency electrical contractor fees than an entire year of scheduled quarterly scanning across the whole facility, and that single comparison is often enough to secure budget approval where a broader statistical argument might not land as clearly with plant leadership.
Staffing and training decisions come next, and facilities generally choose between training internal maintenance staff to perform scans or contracting the work to a third-party thermography service on a recurring schedule. Internal training tends to make sense for facilities with a large enough asset base to justify dedicated camera equipment and where scan frequency needs to be higher than an outside contractor could practically support, while contracted services often work well for smaller facilities or as a starting point before a facility commits to building internal capability. Either path benefits from starting with a defined scope, a specific list of panels, motors, and bearings to be scanned on a fixed interval, rather than an open-ended commitment to scan whatever seems convenient during a given week.
Data management is the piece most new programs underinvest in relative to its importance. A thermal image without associated metadata, the load at time of scan, the ambient temperature, the specific component identifier, and the date, is far less useful than the same image properly logged and tied to a trend history for that exact point. Facilities that invest in a structured tracking system from the very first scan avoid the common and costly mistake of accumulating a large folder of individually useful images that cannot be meaningfully compared against each other months or years later when a trend actually needs to be evaluated.
Common Mistakes That Undermine Thermal Scanning Results
Scanning Without Recording Load
A reading taken without noting the load percentage at scan time cannot be reliably compared against future scans, since temperature rise scales with load and an apparent trend may simply reflect a busier production day.
Ignoring Emissivity Differences
Scanning bare metal, painted, and insulated surfaces with the same default emissivity setting produces readings that are not comparable to each other, masking real findings on low-emissivity components.
One-Time Scans With No Follow-Up
A single scan establishes a snapshot but not a trend, and facilities that treat thermography as an occasional audit rather than a recurring program miss the gradual temperature rise that precedes most electrical failures.
Skipping Safety Procedures for Speed
Removing panel covers on energized equipment without following proper arc flash protection protocols to save time introduces a serious safety risk that undermines the entire purpose of a proactive inspection program.
How Scanning Priorities Shift Across Facility Types
A heavy manufacturing plant running large motors and high-amperage distribution panels around the clock has a very different thermography priority list than a facility with a more distributed load profile, and matching scan focus to the actual failure risk of each environment improves both the efficiency and the return of the program.
Heavy Manufacturing & Process Plants
High-amperage main distribution panels and large continuously running motors carry the highest consequence of failure, making them the natural starting point for a phased scanning rollout in this environment.
Food & Beverage Facilities
Washdown-rated panels and motors face accelerated corrosion at connection points from moisture exposure, making connection hot spots a particularly common and fast-developing finding in this environment.
Data Centers & Utility Rooms
Dense electrical infrastructure with limited redundancy means even a single overlooked connection fault can cascade into a wider outage, justifying more frequent scanning than a typical industrial panel schedule.
Facilities Ask
How is a true fault distinguished from a normal hot component like a motor frame under load?
The key comparison is never an absolute temperature reading in isolation, it is the difference between a component and its expected reference, whether that reference is ambient air, an identical phase on the same panel, or the same component's own historical baseline. A motor frame running warm under full load is expected behavior, but the same frame running noticeably hotter than an identical motor on the adjacent line at the same load is a genuine anomaly. This comparative approach is why consistent scan conditions and load documentation matter as much as the thermal image itself. Teams can walk through comparative scanning setup by reaching out through
support.
Do we need to shut down equipment to perform a thermal scan?
No, and in fact thermography is most valuable specifically because it works on energized equipment under normal operating load, since a de-energized panel or an idle motor will not show the heat signature that reveals a developing fault. Electrical scans are typically performed with panel covers removed under proper safety procedures while the circuit remains energized. This is part of why thermography complements rather than replaces other offline inspection methods.
What causes false positives in thermal scanning results?
Reflected heat from nearby sources, inconsistent load conditions between scans, and emissivity differences between painted, bare metal, and insulated surfaces are the most common sources of a misleading reading. A component that appears hot may simply be reflecting radiant heat from an adjacent process, not generating it internally. Trained interpretation of the thermal image alongside load data at the time of the scan is what separates a real finding from a false alarm, which is why automated severity classification is paired with contextual load and history data rather than reading temperature alone. Teams can
book a demo to see this contextual scoring in action.
How does thermography combine with vibration monitoring on the same bearing?
Thermal rise and vibration signature often develop on different timelines for the same bearing fault, with vibration frequently changing first at the earliest defect stage while a measurable temperature rise appears once friction has increased due to surface damage or lubrication breakdown. Running both technologies on the same critical bearing gives a cross-check, since a fault confirmed by both methods carries far higher confidence than either reading alone. Many reliability programs treat agreement between the two data sources as the trigger for immediate action rather than continued monitoring.
How much does an undetected electrical hot spot typically cost if it progresses to failure?
Beyond the direct cost of replacing a damaged breaker, bus bar, or connection, an undetected hot spot that progresses to an arc flash event carries a serious personnel safety risk and can force an extended shutdown of the entire panel or distribution section while repairs and safety inspections are completed. Even short of an arc event, chronic overheating shortens insulation life across the whole panel, creating a recurring maintenance burden rather than a single fixable fault. Facilities can model this risk against their own panel inventory through
support.
THERMAL INSPECTION · PANELS · MOTORS · BEARINGS
Stop Waiting for the Trip. Start Scanning the Heat.
Build a severity-ranked thermography program across every panel, motor, and bearing in the plant.


.png)