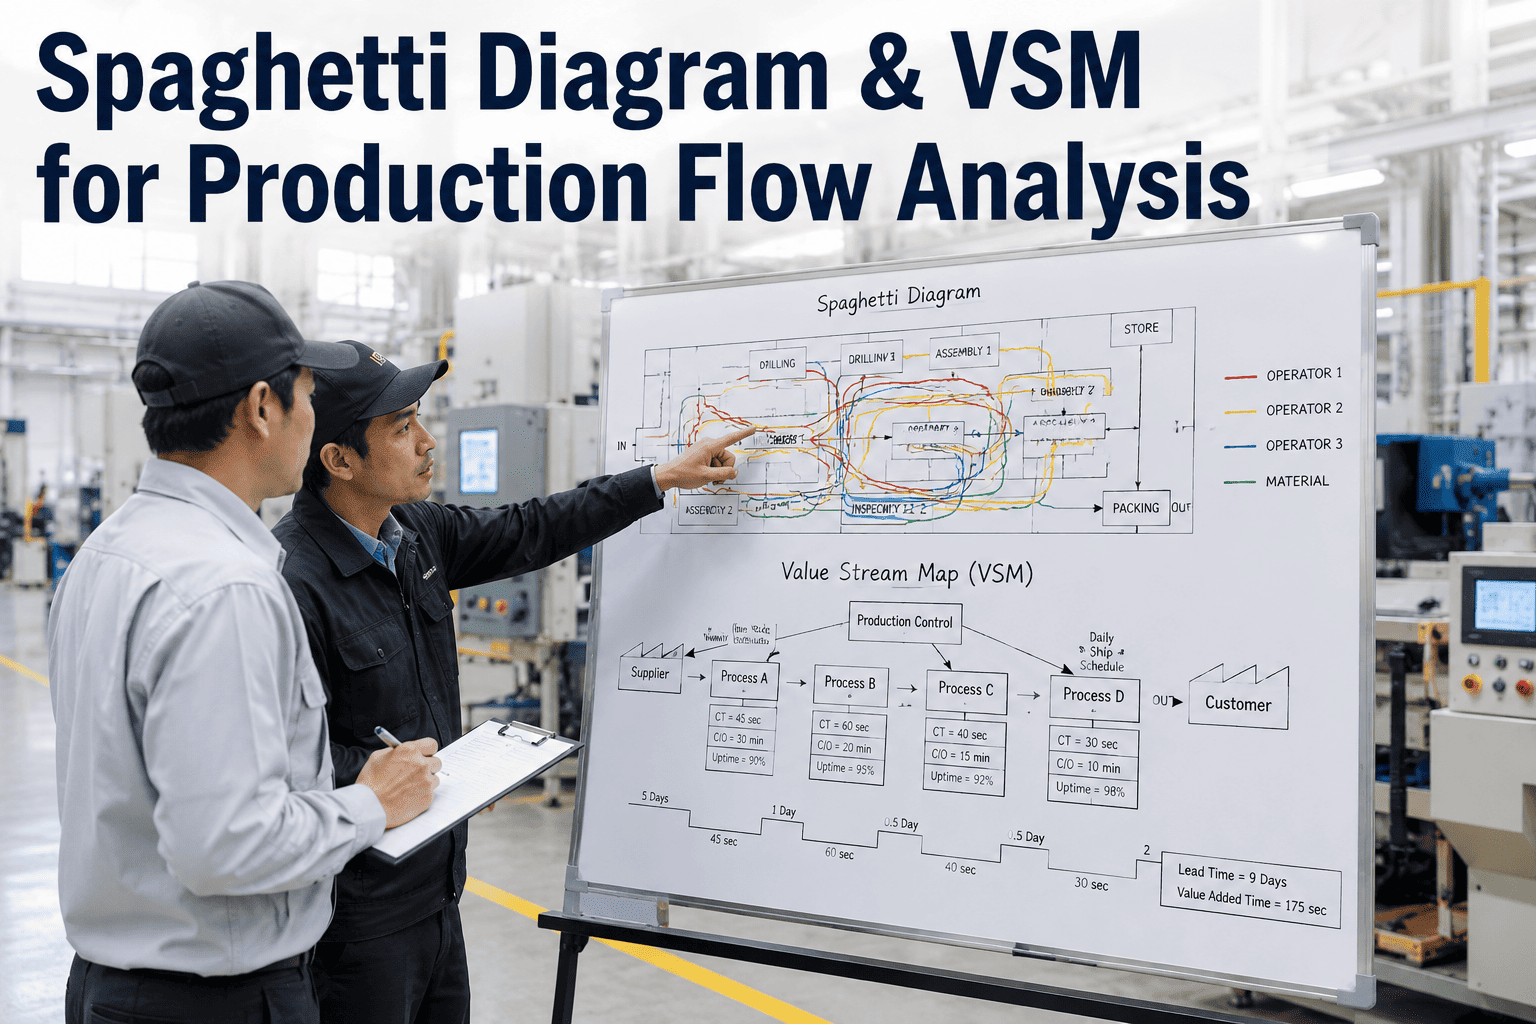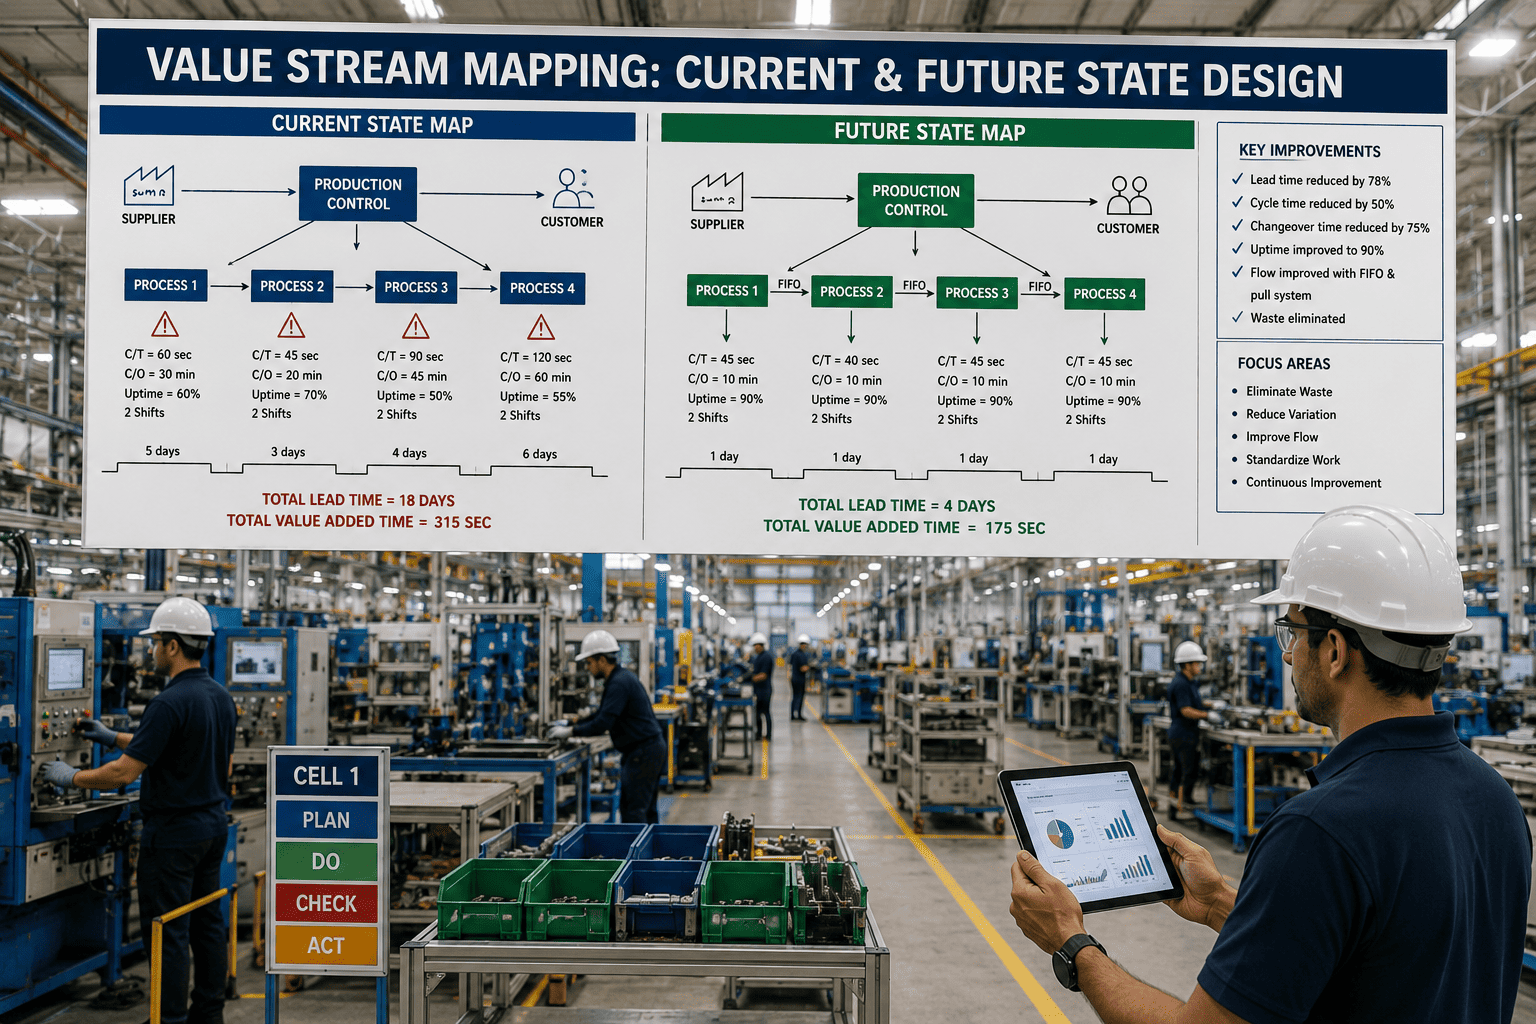
Most manufacturing improvement projects start with a gut feeling about where the bottleneck is, and that feeling is wrong more often than plant leaders like to admit. A machine operator points to the slowest visible step, a supervisor points to the machine that breaks down most, and a production manager points to whatever missed a shipment last week — and all three can be looking at the same value stream and pointing in three different directions. Value stream mapping replaces that guesswork with a single shared picture: every process step, every wait, every handoff, and every scrap of information that moves material from raw stock to a shipped order, laid out so the real bottleneck becomes visible to everyone in the room at once. Once that picture exists, the harder work begins — designing a future state that removes the waste the map exposed, a task the iFactory platform is built to support with live production data instead of a stopwatch and a clipboard.
Your Process Runs for Days. Your Product Only Moves for Minutes.
Value stream mapping is the only lean tool that puts a number on that gap. Map the current state honestly, design a future state around flow instead of batches, and the days start disappearing.
What Current State Mapping Actually Captures
A current state map is not a flowchart. A flowchart shows sequence; a value stream map shows sequence plus time, plus inventory, plus the information that tells each process what to make next. Four building blocks carry almost all of that information, and a team that misreads any one of them ends up designing a future state around the wrong constraint.
Process Box
A single, continuous-flow operation — one machine, one workstation, or one cell where product moves through without stopping. Two operations separated by a queue are two process boxes, never one, even if they sit on the same line.
Data Box
Sits beneath every process box and records cycle time, changeover time, uptime, and the number of operators — the numbers that turn a diagram into an analysis instead of a picture of the floor.
Inventory Triangle
Marks a pile of parts waiting between steps, labeled with quantity and the number of days of demand it represents. These triangles are usually where the real lead time is hiding, not inside the process boxes.
Timeline Ladder
Runs along the bottom of the map, stacking value-added time against wait time for every step in sequence, and produces the single comparison that matters most: total lead time against total processing time.
VSM Symbol Quick Reference
Standard VSM notation exists so any two plants can hand each other a map and read it the same way. Teams new to the method tend to make the same handful of notation mistakes, which quietly corrupt the analysis before the future state design even starts.
| Symbol | What It Tracks | Where Teams Get It Wrong |
|---|---|---|
| Process Box | One uninterrupted operation and its associated data box | Combining two separated operations into a single box, hiding a queue between them |
| Push Arrow | Material moved forward regardless of downstream demand | Labeling every material movement as push, even where a pull signal already exists |
| Supermarket / Kanban | A controlled, capped buffer that downstream pulls from on signal | Drawing a supermarket where the buffer actually has no replenishment trigger at all |
| Information Flow | Electronic (straight line) versus manual (jagged line) scheduling instructions | Skipping the information flow entirely and mapping only material movement |
| Timeline Ladder | Value-added time stacked against wait time across the whole sequence | Estimating wait time from memory instead of the inventory triangle quantities |
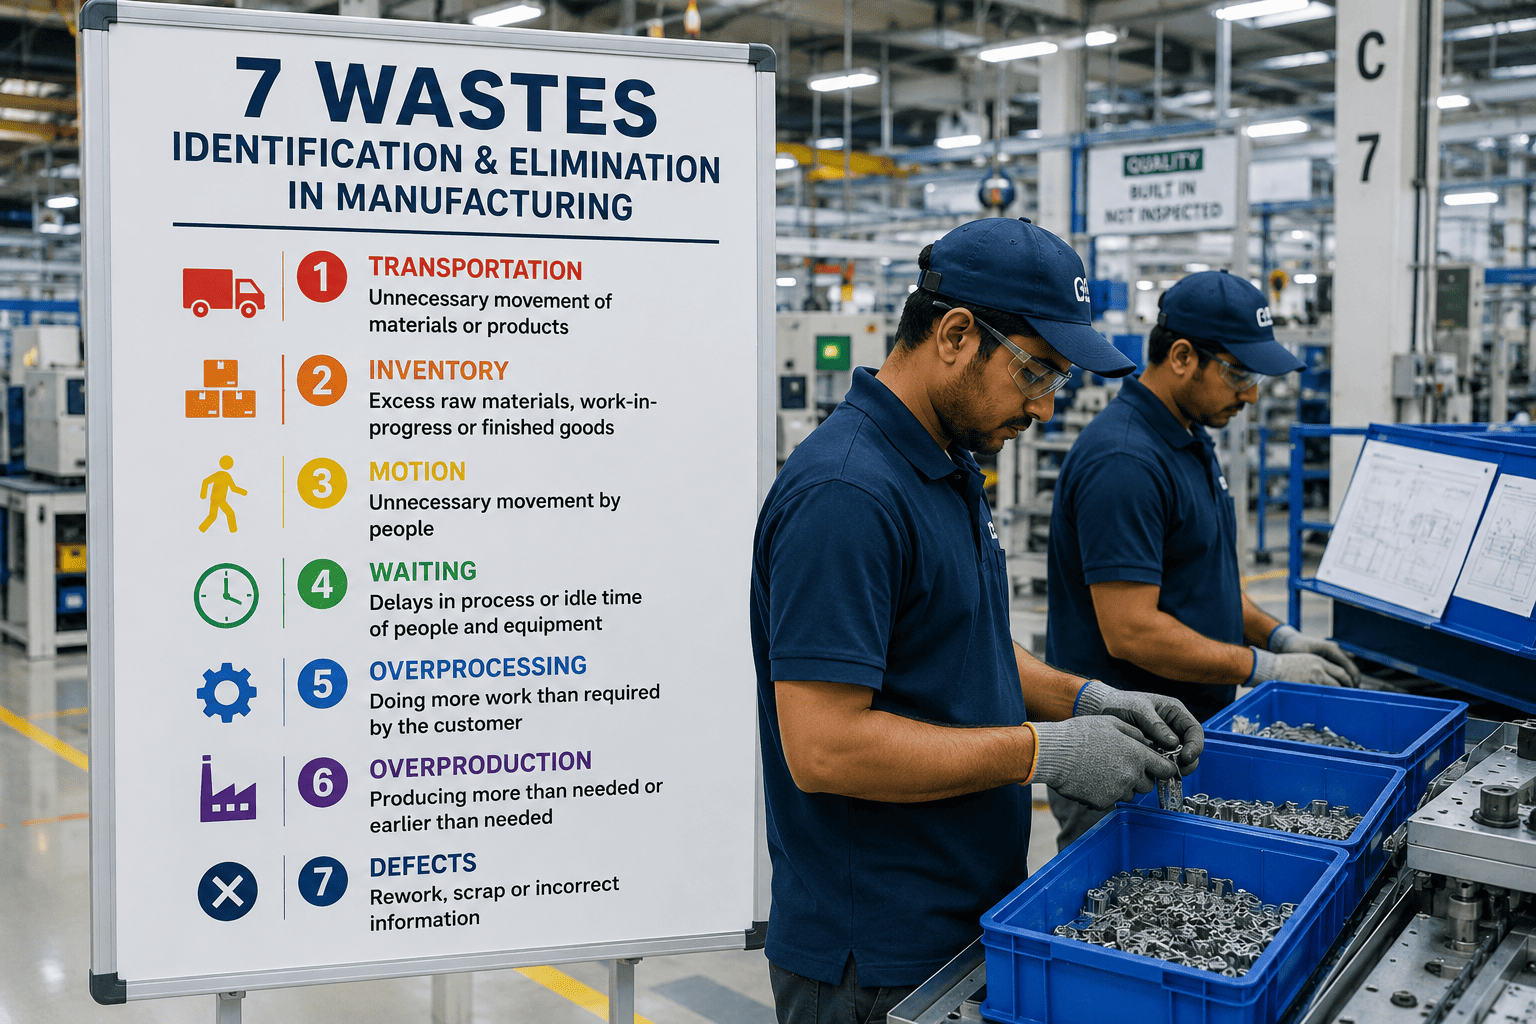
The Eight Wastes a Value Stream Map Exposes
Every inventory triangle and every gap in the timeline ladder traces back to one of eight recognized forms of waste. A future state design that doesn't name which waste it's attacking tends to move the problem sideways instead of removing it.
Transportation
Material moved farther than the process requires, usually a symptom of layout designed around departments instead of product flow.
Inventory
Every triangle on the map beyond what a supermarket or pull signal actually requires, tying up cash and hiding upstream problems.
Motion
Operator reaching, walking, or searching within a workstation that adds no value and shows up as inflated cycle time in the data box.
Waiting
The single largest contributor to most timeline ladders — operators or product idle while the next step or the next batch catches up.
Overproduction
Making more, sooner, or faster than the downstream process needs, the root cause behind most oversized inventory triangles.
Overprocessing
Doing more to a part than the customer specification actually requires, often left over from a tolerance nobody re-validated in years.
Defects
Rework and scrap loops that a static process map never shows, because the map assumes every part passes on the first attempt.
Unused Skills
Operators who see the same recurring problem shift after shift, with no structured way to feed that observation into the mapping session.
Current State Habits Versus Future State Design Principles
The current state map documents how material actually moves today, which in most plants means batch production pushed forward on a schedule. The future state map is a deliberate redesign around a small set of lean principles, and the gap between the two columns below is usually where the improvement roadmap comes from.
Reading the Timeline Ladder Correctly
The timeline ladder at the bottom of a value stream map is where most of the persuasive power of the exercise lives, because it puts value-added time and lead time on the same axis where anyone in the room can compare them at a glance. In a typical batch-and-push environment, the value-added segments — the moments where a process is actually changing the product — add up to a small fraction of the total lead time, while the inventory triangles between steps account for the rest. Presenting that ratio to plant leadership, rather than describing it in words, is usually what turns a value stream mapping workshop from a lean exercise into a funded improvement project. A future state map redraws the same ladder after continuous flow, pull signals, and leveled scheduling have been applied, and the shrinking gap between the two versions becomes the business case for every kaizen burst on the implementation plan.
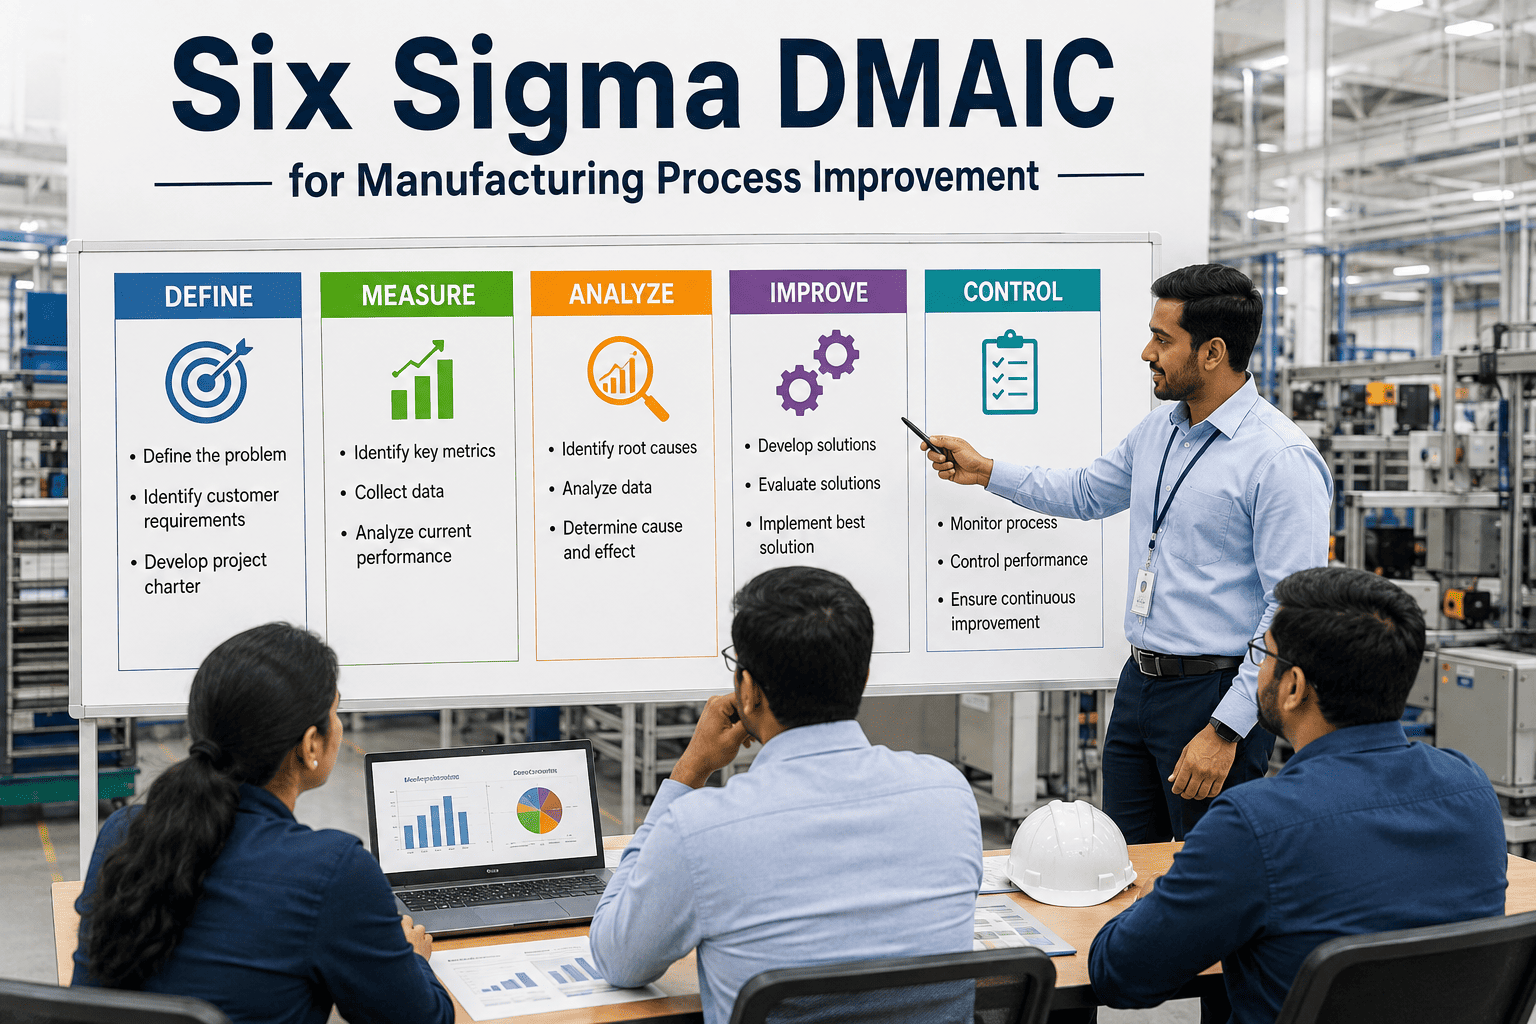
From Current State to Future State: The Six-Step Workshop
Select the product family
Group products that share most of the same process steps and equipment, rather than attempting to map every product a plant makes in a single pass.
Walk the floor and draw the current state
Follow the actual material path in person, timing cycles and counting inventory triangles directly, rather than reconstructing the process from a routing sheet in a conference room.
Calculate takt time
Divide available working time by customer demand to establish the pace every future state design has to be built around, not the pace the fastest machine happens to run.
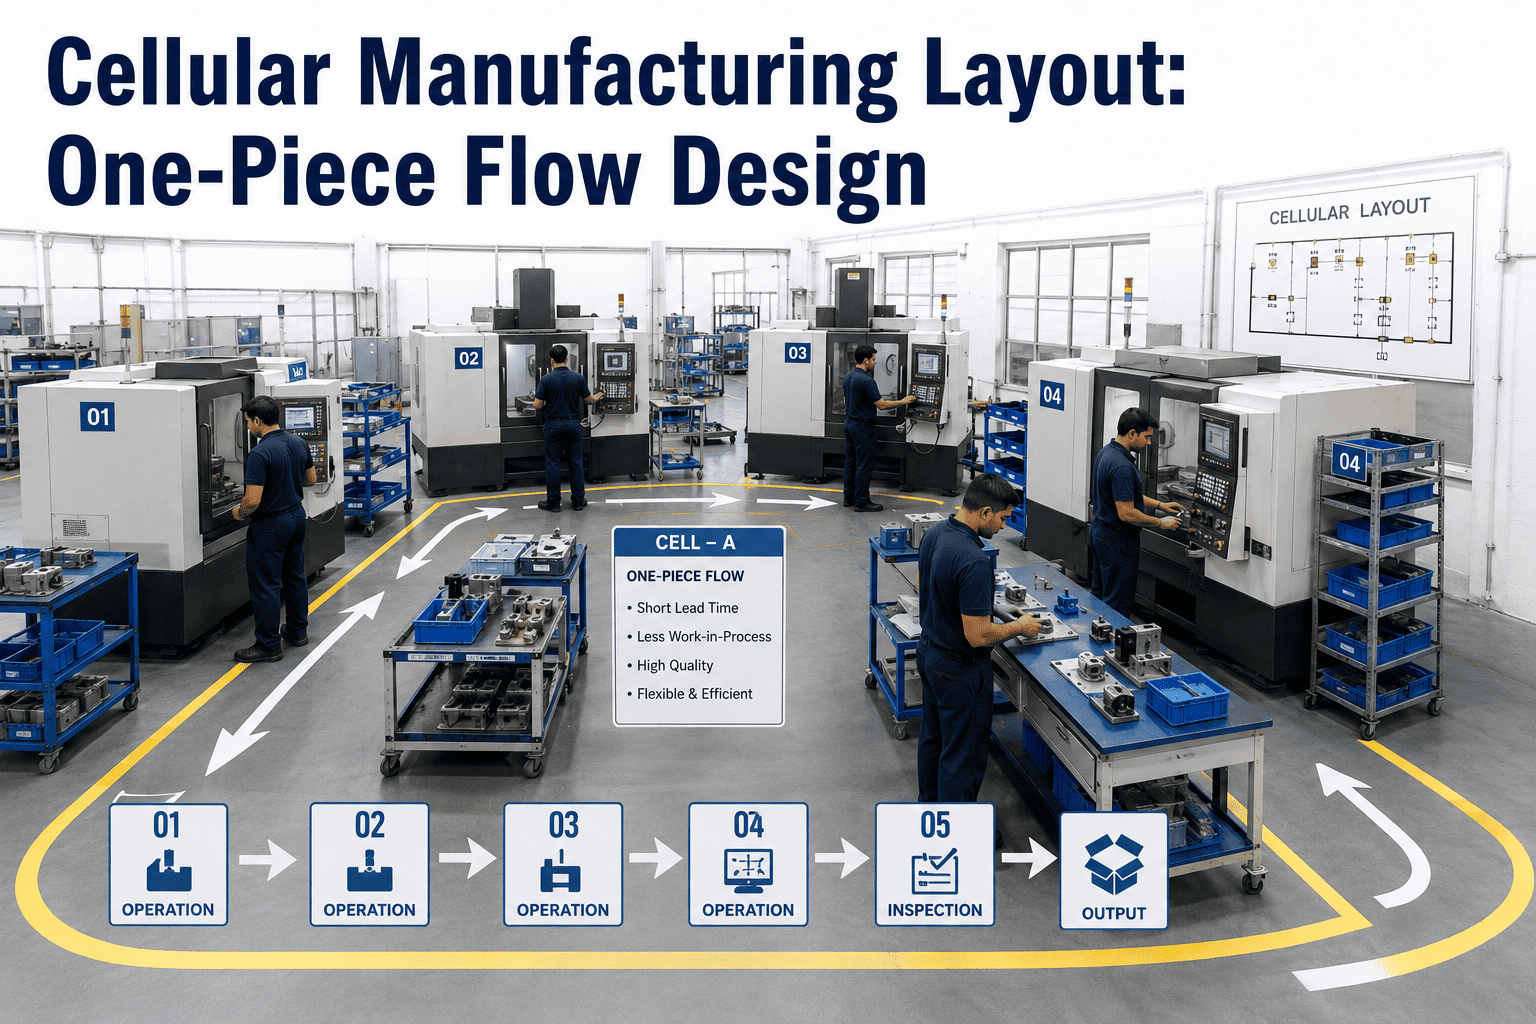
Identify continuous flow opportunities
Look for adjacent steps with similar cycle times that can be linked directly, and steps that cannot be linked yet, which become candidates for a supermarket instead.
Design the future state map
Redraw the value stream with a pacemaker process, pull signals, and leveled scheduling, and recalculate the timeline ladder to confirm the redesign actually shortens lead time.
Build an implementation plan with kaizen bursts
Break the future state into specific, scoped improvement events, each with an owner and a target date, rather than leaving the redesign as an unassigned aspiration.
Design a Future State Around Real Takt Time, Not a Guess
iFactory tracks actual demand and cycle time together, so the future state pacemaker process and every kaizen burst it triggers are sized against numbers your team can defend in the next planning meeting.
A Composite Scenario: What a Rushed Mapping Session Missed
A mid-size automotive parts supplier ran its first value stream mapping workshop on a bracket assembly line ahead of a customer's lean audit, compressed into a single afternoon. The team sketched the current state from the routing sheet and a handful of operator interviews rather than walking the actual line, and moved straight to a future state design without recounting the inventory triangles that already existed on the floor.
The future state map looked complete and satisfied the audit, but three months later the promised lead time reduction hadn't materialized. When a follow-up team walked the floor with a stopwatch, they found the original inventory count between the stamping and welding steps had been estimated at two days of stock; the actual count, once measured, was closer to five days, driven by a changeover pattern nobody had captured from the routing sheet alone. The pacemaker process the team had selected wasn't even the right constraint — the real bottleneck sat one step upstream, invisible in a map built from documentation instead of direct observation.
| Metric | Original Current State | Re-Measured Current State | Achieved Future State |
|---|---|---|---|
| Lead Time | 6.5 days | 9.2 days | 3.1 days |
| Cycle Time | 48 seconds | 48 seconds | 41 seconds |
| WIP Inventory | 2 days | 5 days | 0.8 days |
| Flow Efficiency | Not calculated | 4% | 13% |
The corrected process didn't just fix the bracket line's number — it changed how every subsequent value stream mapping session on that floor was run, with a standing rule that no future state design proceeds until the current state has been walked and re-measured in person, not reconstructed from paperwork. The supplier also began tracking flow efficiency as a standing metric alongside on-time delivery, giving the plant a leading indicator that flagged drift in the value stream well before it showed up as a missed shipment.
Keeping the Value Stream Map Alive
A value stream map drawn once for a single workshop and then filed away drifts out of date the moment demand, staffing, or equipment changes. Plants that sustain the discipline treat the map as a living planning input, revisited on a defined cadence rather than only when a customer asks for one.
Quarterly Gemba Walk
Re-walk the mapped value stream on a fixed schedule, checking whether inventory triangles, cycle times, and takt time still match the map as demand shifts across the year.
Kaizen Burst Trigger
Whenever a kaizen event from the implementation plan closes, update the affected process box and re-check the timeline ladder to confirm lead time actually dropped as designed.
New Product Introduction
Map any new product family before or shortly after launch rather than waiting for the next scheduled review, since early-stage flow decisions are far easier to correct than established ones.
Common Mistakes That Stall a VSM Program
Mapping From Memory, Not the Floor
Reconstructing the current state from a routing sheet or a manager's recollection produces a map that looks plausible and measures nothing real.
Skipping Straight to Future State
A future state built without an accurate, walked current state is a wish list, not a redesign grounded in the plant's actual constraints.
No Owner for Kaizen Bursts
A future state map with unassigned improvement items rarely becomes anything more than a poster on a conference room wall.
Treating It as a One-Time Event
A map that's never re-walked stops reflecting reality within a few months, and the next big improvement project starts from stale data all over again.
Frequently Asked Questions
How long does a typical value stream mapping workshop take?
A single product family current state map, walked properly on the floor with accurate timing and inventory counts, usually takes a full day for a cross-functional team of five to eight people. Future state design and the resulting implementation plan often take a second day, sometimes split into a separate follow-up session once the current state data has been verified. Visit support for guidance on structuring a workshop for your specific line.
What's the difference between value stream mapping and a standard process flowchart?
A flowchart shows the sequence of steps a product moves through, without capturing time, inventory, or the information flow that tells each step what to make next. A value stream map adds cycle time, wait time, inventory quantities, and scheduling information to that sequence, which is what makes it possible to calculate lead time, flow efficiency, and takt time rather than just describing the process in order.
Do we need historical production data before starting a VSM workshop?
It helps, but a current state map is built primarily from direct observation on the floor, not from historical reports. Cross-checking cycle times and inventory counts against CMMS or MES data afterward, wherever it exists, catches gaps between what the team observed during the walk and what actually happens across a full week of production. Book a demo to see how live floor data connects into the mapping process.
How do we decide which process becomes the pacemaker in the future state?
The pacemaker is typically the process closest to the customer that can be scheduled directly, usually the last continuous-flow step before shipping, with everything upstream pulled from it through supermarkets. Choosing a pacemaker further upstream than necessary tends to reintroduce the same batch-and-push scheduling problems the future state design was meant to eliminate.
How often should a value stream map be updated after the future state is implemented?
Treat it as a living document rather than a one-time deliverable — a practical minimum is a quarterly floor walk to re-check takt time and inventory levels, plus an update any time a kaizen burst closes or a new product joins the family. Contact support for help setting up a recurring VSM review cadence for your plant.
Turn Your Value Stream Map Into a Living Plan, Not a Poster
iFactory connects current state data, future state targets, and kaizen burst tracking in one place, so the map your team built actually drives the next planning meeting instead of gathering dust after the workshop ends.