Most plants know their labor cost down to the rupee spent last month, but very few can answer a simpler question in real time: which shift, which line, or which skill gap is quietly driving that cost up right now. Attendance gets tracked in one system, overtime gets approved in another, and skill certifications live in a spreadsheet nobody updates consistently, so the full picture only comes together weeks later, after the money is already spent. AI workforce analytics pulls all three threads into one live view, showing exactly where labor cost is leaking while there is still time to act on it. Book a demo to see your own workforce data turned into a live analytics view instead of a month-end report.
Workforce Analytics: Turn Labor Data Into Real-Time Productivity Decisions
Attendance patterns, skill utilization, overtime exposure, and labor cost per unit — tracked continuously with AI, instead of reconstructed weeks later from three disconnected systems.
Up to 25%
workforce productivity improvement reported with AI-driven labor management
10-30%
reduction in labor cost through AI-optimized staffing and scheduling
18-22%
less scheduling-related labor waste compared to manual methods
Where the Cost Actually Hides
Four Places Labor Cost Leaks Without Anyone Noticing Until Month-End
01
Overtime Creeping Line by Line
A few extra hours on one line looks minor in isolation, but across a plant running multiple shifts, unmanaged overtime compounds into one of the largest and most avoidable line items on the labor budget.
02
Certified Skills Sitting Idle
A certified welder scheduled on general assembly, or a trained operator idle while a less-experienced colleague struggles on a machine they are still learning, both represent skilled labor cost that is not being used where it delivers the most value.
03
Absence Patterns That Repeat Unnoticed
A recurring Monday absence pattern on one line or a specific shift with chronically higher unplanned leave rarely surfaces until it has already caused a staffing scramble, because nobody is watching the pattern build over weeks.
04
Labor Cost Per Unit Drifting Silently
Two lines producing the same product can carry very different labor costs per unit once overtime, downtime-driven idle labor, and rework hours are factored in, and that gap usually stays invisible until a finance review months later.
The Four Pillars
What AI Workforce Analytics Actually Tracks
Attendance
Attendance & Absence Patterns
Continuous tracking of check-ins, lateness, and unplanned absence, with pattern detection that flags recurring trends by shift, line, or individual before they become a staffing crisis.
Skills
Skill Utilization Mapping
A live view of which certified skills are deployed where, so a shortage on one line and idle expertise on another are visible in the same picture instead of two disconnected facts.
Overtime
Overtime & Schedule Adherence
Real-time tracking of planned versus actual hours worked, with early alerts when overtime trends toward budget-breaking levels before the shift, not after the payroll run.
Cost
Labor Cost Per Unit
Labor spend connected directly to production output, so cost per unit is visible by line and by shift, revealing exactly where efficient staffing is happening and where it is not.
See Your Own Numbers
Bring Your Last Month of Attendance and Overtime Data to the Demo
We will show you what a live workforce analytics view looks like using patterns similar to your own plant's data, so you can see exactly what surfaces that a spreadsheet or a monthly report never would have shown you in time.
What It Looks Like Day to Day
One Live View Instead of Three Disconnected Systems
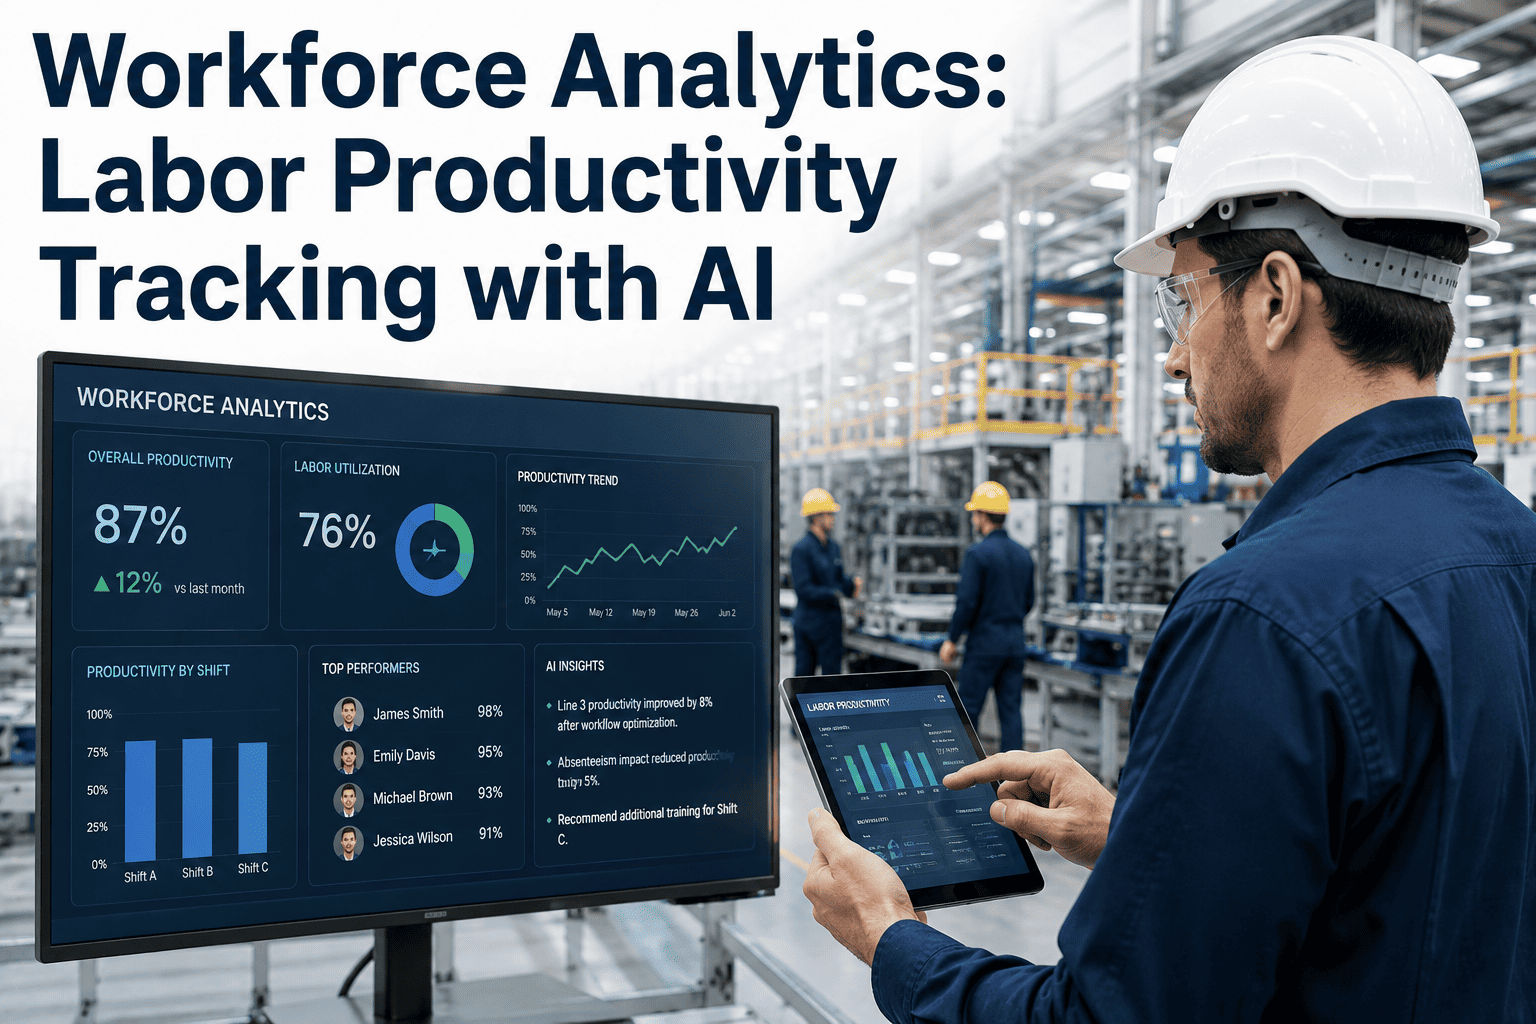
A widget view like this is only useful if the numbers behind it update continuously rather than once a month, which is the core difference between a workforce analytics platform and a static HR report. Managers can query the same data in plain language — asking what overtime exposure looks like for the week ahead, or which shift is carrying the highest labor cost per unit — and get an answer immediately instead of waiting for someone to pull and reconcile three separate spreadsheets.
The Practical Difference
Manual Labor Tracking vs. AI Workforce Analytics
| Factor | Manual Tracking (Spreadsheets & Timecards) | AI Workforce Analytics |
|---|---|---|
| When a labor cost problem is visible | Weeks later, at the monthly review | Same shift, as the trend forms |
| Overtime pattern detection | Noticed after payroll is already run | Flagged before the shift ends |
| Skill utilization visibility | Tracked separately from scheduling | Mapped directly against live schedules |
| Absence pattern detection | Requires manual review to spot trends | Automatically flagged by shift and line |
| Reporting effort | Hours spent reconciling multiple sources | Live dashboard, no manual reconciliation |
Why This Matters at Scale
The Numbers Behind AI-Driven Workforce Management
Up to 25%
Workforce productivity improvement reported by organisations using AI-driven labor management, according to industry research on workforce optimization.
18-22%
Reduction in scheduling-related labor waste for organisations using AI-powered demand forecasting for staffing compared to traditional methods.
10-30%
Range of labor cost reduction achievable through AI-optimized staffing, scheduling, and overtime management across reported deployments.
These figures describe the ceiling of what is achievable, not a guaranteed outcome for every plant on day one. The organisations that see results closest to these numbers are the ones that treat workforce analytics as an ongoing operating habit — checking overtime exposure weekly, reviewing skill coverage gaps before they cause a shortage — rather than a report generated once and then set aside until the next quarterly review.
Getting It Right
Making Workforce Analytics Something Your Team Actually Uses
Start With One Pain Point, Not All Four
Plants that begin by tackling their single biggest known problem, most often overtime, build trust in the data faster than those trying to roll out every metric at once across every shift.
Give Supervisors the View, Not Just Central HR
The supervisor on the floor is best positioned to act on an attendance or overtime trend in real time, so the analytics view needs to reach them directly rather than staying locked inside a corporate dashboard.
Connect It to Existing Attendance and Payroll Systems
Analytics built on top of the systems you already run avoids a duplicate data-entry burden and ensures the numbers supervisors see match what actually appears on the payroll.
Review Trends Weekly, Not Just Monthly
A weekly rhythm of checking overtime exposure and attendance patterns catches problems while they are still small, rather than after they have compounded into a full monthly variance.
Plant Operations Perspective
For years, labor cost was something we explained after the fact, not something we managed in the moment. The shift that actually changes behaviour on the floor is when a supervisor can see overtime exposure building on their own shift in real time, instead of finding out from a finance report three weeks later that a line has been running hot all month. The data itself does not fix anything — what it does is give the person closest to the problem enough lead time to make a different decision before the cost is locked in.
Rutger Femsdal-Achebe
Director of Workforce Operations · 17 years across automotive and consumer goods manufacturing · Led labor analytics rollout across a six-plant production network
Workforce Analytics Questions
Frequently Asked Questions
Does this replace our existing attendance and payroll systems?
No, workforce analytics is designed to sit on top of the attendance, timekeeping, and payroll systems you already run, pulling data from them rather than replacing them outright. This approach avoids duplicate data entry and ensures the numbers your supervisors see on a dashboard match exactly what eventually appears on payroll, which is essential for the analytics to be trusted rather than treated as a second, disconnected source of truth. Book a demo to see how integration with your specific systems would work.
How is skill utilization actually measured and tracked?
Skill utilization is tracked by mapping each employee's certified skills and qualifications against where they are actually scheduled and working, then comparing that against where those skills are most needed across the plant at any given time. This surfaces both shortages, where a line lacks a certified operator it needs, and underutilization, where a skilled employee is scheduled somewhere their expertise is not required, in a single connected view rather than as two separate reports.
Will employees feel like this is a surveillance tool rather than a productivity tool?
This concern is worth taking seriously, and the plants that get the most value from workforce analytics are generally transparent with employees about what is being tracked and why, framing it around fairer scheduling, reduced burnout from unmanaged overtime, and better skill-matched assignments rather than individual monitoring. The strongest deployments focus the dashboard on shift, line, and plant-level patterns for planning purposes, not on ranking or penalising individual workers. Contact support to discuss how this is typically positioned during rollout.
How quickly can we expect to see overtime or labor cost improvements?
Visibility into overtime patterns and cost drivers typically appears within the first few weeks of live data flowing through the system, since the analytics layer does not need months of historical data to start flagging real-time trends like a line trending over its overtime budget. Measurable cost reduction usually follows over subsequent months as supervisors build the habit of acting on weekly trends rather than waiting for a monthly review, with reported reductions in labor cost commonly falling in a broad but meaningful range once the habit is established.
Can this work across multiple plants with different shift structures and labor rules?
Yes, the analytics layer is built to accommodate different shift patterns, labor rules, and overtime policies across sites, so a multi-plant network can view labor cost and productivity on a comparable basis without forcing every site into an identical schedule structure. This is particularly useful for identifying which plant's staffing approach is producing the lowest labor cost per unit, so proven practices can be shared across the wider network. Book a session to see how a multi-plant rollout is typically structured.
Stop Explaining Labor Cost After It Happens
See Attendance, Skills, Overtime, and Cost in One Live View
iFactory's workforce analytics turns attendance records, skill certifications, and scheduling data into a real-time picture your supervisors can act on today, not a report finance reviews next month.