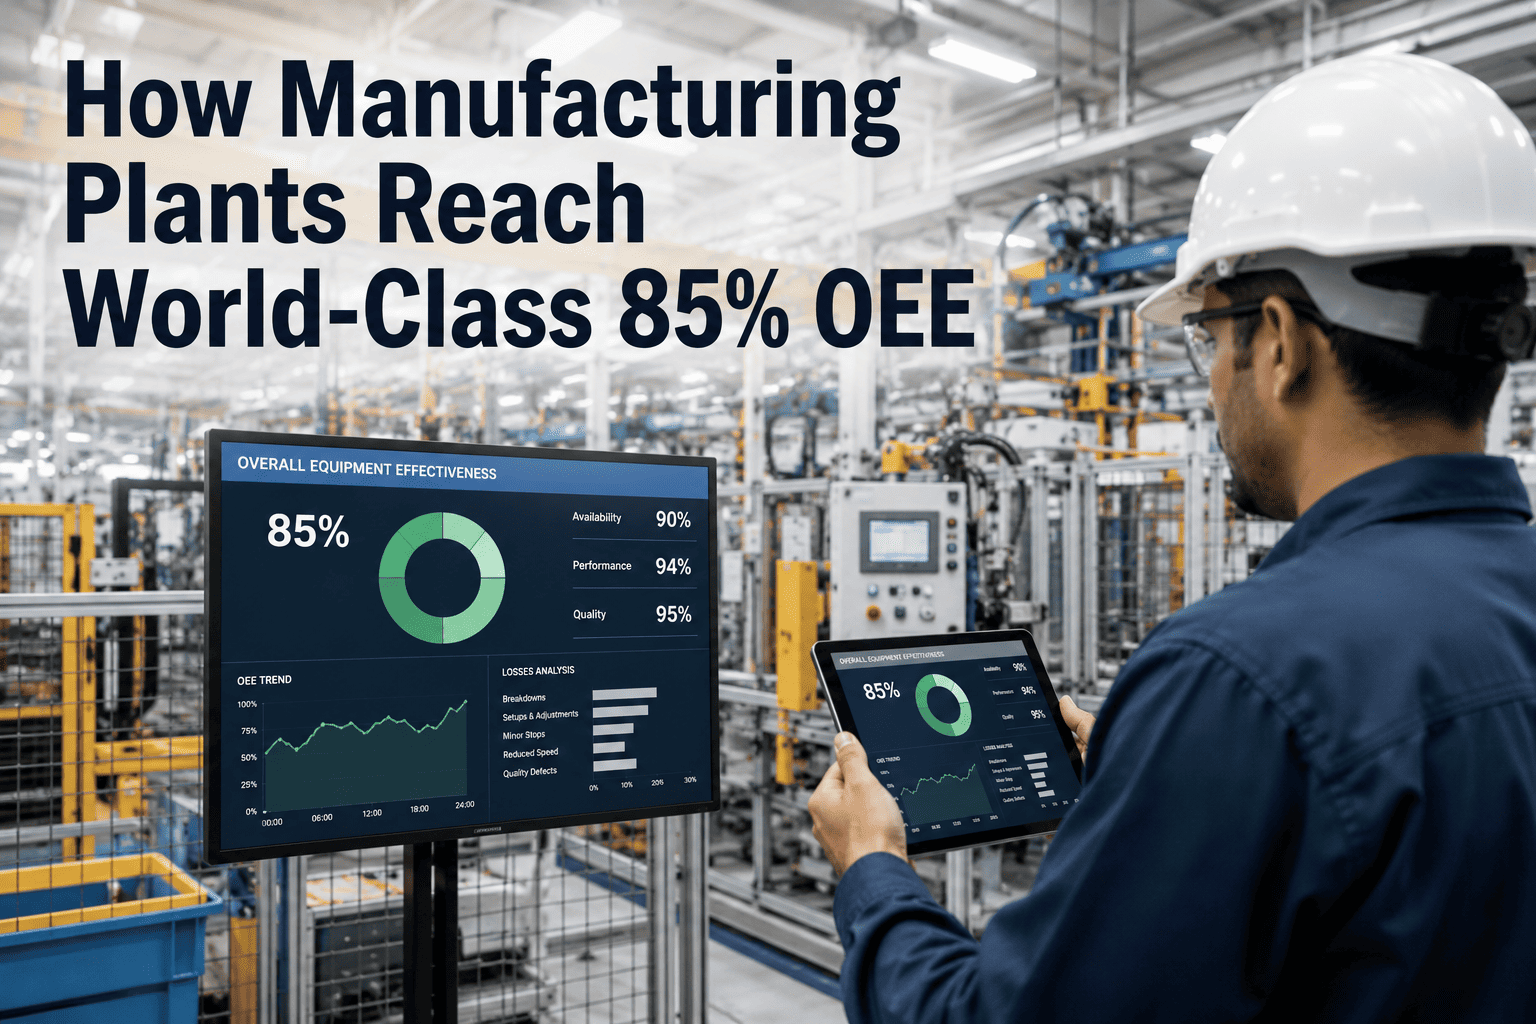
For decades, the manufacturing industry has revered 85% Overall Equipment Effectiveness (OEE) as the gold standard of operational excellence. Yet, the harsh reality is that the vast majority of plants globally languish between 50% and 65%, leaving substantial value trapped on the factory floor. This gap isn't merely a metric; it represents billions in lost throughput, inflated maintenance costs, and missed revenue opportunities. Closing this chasm requires more than just incremental improvements—it demands a fundamental shift from reactive firefighting to predictive, data-driven operations. In this comprehensive guide, we dissect the anatomy of world-class OEE, revealing the exact strategies, technologies, and cultural shifts that propel plants from average to top-quartile performance. From leveraging artificial intelligence for predictive maintenance to implementing real-time analytics for loss elimination, we provide a technical blueprint for the journey. Book a Demo to see how iFactory's AI platform accelerates this transformation.
Ready to Close the OEE Gap?
Transform your plant's performance with AI-driven insights. Achieve 85% OEE faster than you thought possible.
The World-Class OEE Benchmark: A Deep Dive
Understanding the 85% OEE benchmark requires dissecting its three core components: Availability, Performance, and Quality. World-class plants achieve Availability above 90%, Performance above 95%, and Quality above 99.9%. This trifecta ensures that equipment runs when needed, at optimal speed, and without defects. However, reaching this level is not a linear path. It involves systematically eliminating the six big losses: breakdowns, setup/adjustments, idling/minor stops, reduced speed, process defects, and reduced yield. Each loss category requires distinct analytical and technological interventions. For instance, reducing minor stops (often the most elusive loss) demands real-time cycle time analysis and root cause correlation. The journey from 60% to 85% OEE typically spans 18-24 months, with the first 6 months focused on data accuracy and baseline establishment. Advanced analytics, particularly machine learning models trained on historical sensor data, can compress this timeline by identifying hidden patterns in downtime and quality deviations. iFactory's platform, for example, uses unsupervised learning to cluster stop events and automatically classify losses, eliminating manual data entry errors. This foundational layer of accurate, granular data is the bedrock upon which all OEE improvement initiatives rest. Without it, even the best-intentioned kaizen events can miss the mark.
The 18-24 Month Roadmap to 85% OEE
Phase 1: Data Foundation & Baseline
Establish accurate OEE calculation by connecting machine sensors (PLC, SCADA) to a centralized data lake. Validate availability, performance, and quality data streams. Set up automated loss categorization using AI to eliminate human bias. Typical outcome: baseline OEE within 2% accuracy.
Phase 2: Loss Identification & Prioritization
Deploy machine learning models to identify the top 3 loss categories by impact. Use Pareto analysis with real-time dashboards. Implement root cause correlation (e.g., temperature spikes preceding bearing failures). Target: reduce top loss by 20%.
Phase 3: Predictive Maintenance & Optimization
Integrate predictive maintenance models for critical assets. Reduce unplanned downtime by 40% through early anomaly detection. Optimize changeover procedures using digital twins. Performance improvements from speed loss analysis.
Phase 4: Sustained Excellence & Continuous Improvement
Embed OEE KPIs into daily management systems. Use AI to recommend improvement actions. Achieve and sustain 85%+ OEE with automated monitoring and alerts. Foster a culture of data-driven decision making.
Accelerate Your OEE Journey
Cut the timeline by 6 months with AI-powered predictive analytics. See how in a personalized demo.
Six Big Losses: AI-Powered Elimination Strategies
Breakdowns
Unplanned stops due to equipment failure. AI predictive models analyze vibration, temperature, and current signatures to forecast failures 2-4 weeks in advance, enabling just-in-time maintenance. Typical reduction: 50%.
Setup & Adjustments
Changeover time between products. Digital twins simulate optimal changeover sequences. AI recommends parameter adjustments to reduce trial-and-error. Typical reduction: 30%.
Idling & Minor Stops
Short, frequent stops (often <5 minutes). Machine learning clusters stop patterns and correlates with upstream/downstream conditions. Real-time operator alerts reduce frequency by 40%.
Reduced Speed
Operating below design speed. AI analyzes historical performance data to identify optimal speed profiles for each product, balancing throughput and quality. Typical gain: 10-15%.
Process Defects
Scrap or rework during production. AI vision systems detect defects in real-time, while predictive quality models adjust process parameters to prevent defects. Typical reduction: 60%.
Reduced Yield
Startup waste or transition losses. AI models optimize startup sequences and predict optimal transition points between batches. Typical reduction: 25%.
OEE Benchmarking by Industry
| Industry | Average OEE | World-Class OEE | Primary Loss | AI Opportunity |
|---|---|---|---|---|
| Automotive | 65% | 85% | Minor Stops | Real-time cycle time analysis |
| Food & Beverage | 55% | 80% | Changeover | Digital twin simulation |
| Pharmaceutical | 60% | 85% | Quality Defects | Predictive quality control |
| Electronics | 70% | 90% | Speed Loss | Optimal speed profiling |
| Metal Fabrication | 50% | 80% | Breakdowns | Predictive maintenance |
The Role of AI in Closing the OEE Gap
Artificial intelligence is not a silver bullet, but it is the most powerful lever for accelerating the journey to world-class OEE. Traditional OEE initiatives rely heavily on manual data collection, subjective loss categorization, and reactive analysis. AI flips this paradigm. Machine learning models can ingest thousands of data points per second from sensors, PLCs, and MES systems, automatically classifying losses with 95%+ accuracy. More importantly, AI excels at uncovering hidden correlations that human analysts miss. For example, a subtle increase in motor current combined with a slight ambient temperature rise might precede a bearing failure by 72 hours. A neural network can detect this pattern and trigger a maintenance alert, preventing a catastrophic breakdown. Furthermore, reinforcement learning algorithms can optimize production schedules in real-time, balancing throughput, energy consumption, and quality constraints. The result is not just higher OEE, but a more resilient and adaptable manufacturing operation. iFactory's AI platform specifically addresses the three pillars of OEE: Availability (predictive maintenance), Performance (speed optimization), and Quality (defect prediction). By providing a unified, real-time view of these metrics, the platform enables plant managers to make data-driven decisions that compound over time.
The 10-Point World-Class OEE Checklist
- Real-time OEE dashboards with automated loss classification
- Predictive maintenance models for top 5 critical assets
- Digital twin for changeover optimization
- AI-driven root cause analysis for minor stops
- Quality prediction using machine learning on process parameters
- Real-time operator alerts via mobile devices
- Automated Pareto analysis for loss prioritization
- Continuous improvement tracking with AI recommendations
- Integration with existing MES, ERP, and CMMS systems
- Monthly OEE reviews with cross-functional teams
Frequently Asked Questions
What is the exact definition of world-class OEE?
World-class OEE is generally defined as 85%, which is derived from the product of world-class Availability (90%), Performance (95%), and Quality (99.9%). However, this benchmark can vary by industry; for example, discrete manufacturing often targets 85%, while continuous process industries may aim for 90% or higher. The 85% figure represents a level where losses are minimized and operations are highly efficient. Achieving this requires systematic elimination of the six big losses through data-driven methods. For a detailed assessment of your plant's current OEE, Book a Demo to see how iFactory's analytics can benchmark your performance.
How long does it take to go from 60% to 85% OEE?
The typical journey from 60% to 85% OEE spans 18 to 24 months, but this timeline can be compressed with the right technology and focus. The first 6 months are critical for establishing accurate data and baseline metrics. Subsequent phases involve loss identification, predictive maintenance deployment, and continuous improvement. AI-powered platforms can accelerate this by automating data collection and loss classification, potentially reducing the timeline by 6-8 months. The key is to prioritize high-impact losses first. To discuss a realistic timeline for your facility, contact our support team for a personalized roadmap.
What are the biggest barriers to achieving 85% OEE?
The most common barriers include poor data quality (manual entry, inconsistent definitions), lack of real-time visibility, and resistance to change from operators and maintenance teams. Additionally, many plants focus on only one OEE component (e.g., availability) while neglecting performance and quality. Another major barrier is the absence of predictive capabilities; reactive maintenance leads to unplanned downtime that erodes OEE. Overcoming these barriers requires a combination of technology (AI, IoT sensors) and cultural change (training, incentives). iFactory's platform addresses these by providing automated data collection and user-friendly dashboards. For a deeper dive into overcoming these barriers, Book a Demo to see how we simplify the journey.
Can small and medium manufacturers achieve world-class OEE?
Absolutely. While world-class OEE is often associated with large enterprises, small and medium manufacturers (SMMs) can achieve it by focusing on targeted improvements and leveraging affordable technology. Cloud-based AI platforms like iFactory are designed to be scalable and cost-effective, requiring minimal IT infrastructure. SMMs often have the advantage of agility, allowing them to implement changes faster. The key is to start with a single, high-impact production line, establish a baseline, and then scale. With the right tools, even a 50-person plant can reach 85% OEE. To explore a solution tailored for your size, visit our support page for case studies from similar manufacturers.
How does AI improve OEE compared to traditional methods?
Traditional OEE improvement relies on manual data collection, periodic audits, and reactive problem-solving. AI transforms this by providing real-time, automated data collection with 95%+ accuracy in loss classification. Machine learning models can predict failures before they happen, optimize speed settings dynamically, and detect quality deviations in real-time. AI also uncovers hidden correlations that humans miss, such as the interplay between temperature, humidity, and defect rates. The result is a 30-50% faster improvement trajectory. iFactory's AI platform integrates all these capabilities into a single dashboard. To see the difference AI can make in your plant, Book a Demo today.
Your 85% OEE Journey Starts Now
Don't let another month of lost productivity pass. iFactory's AI platform is the fastest path to world-class performance.