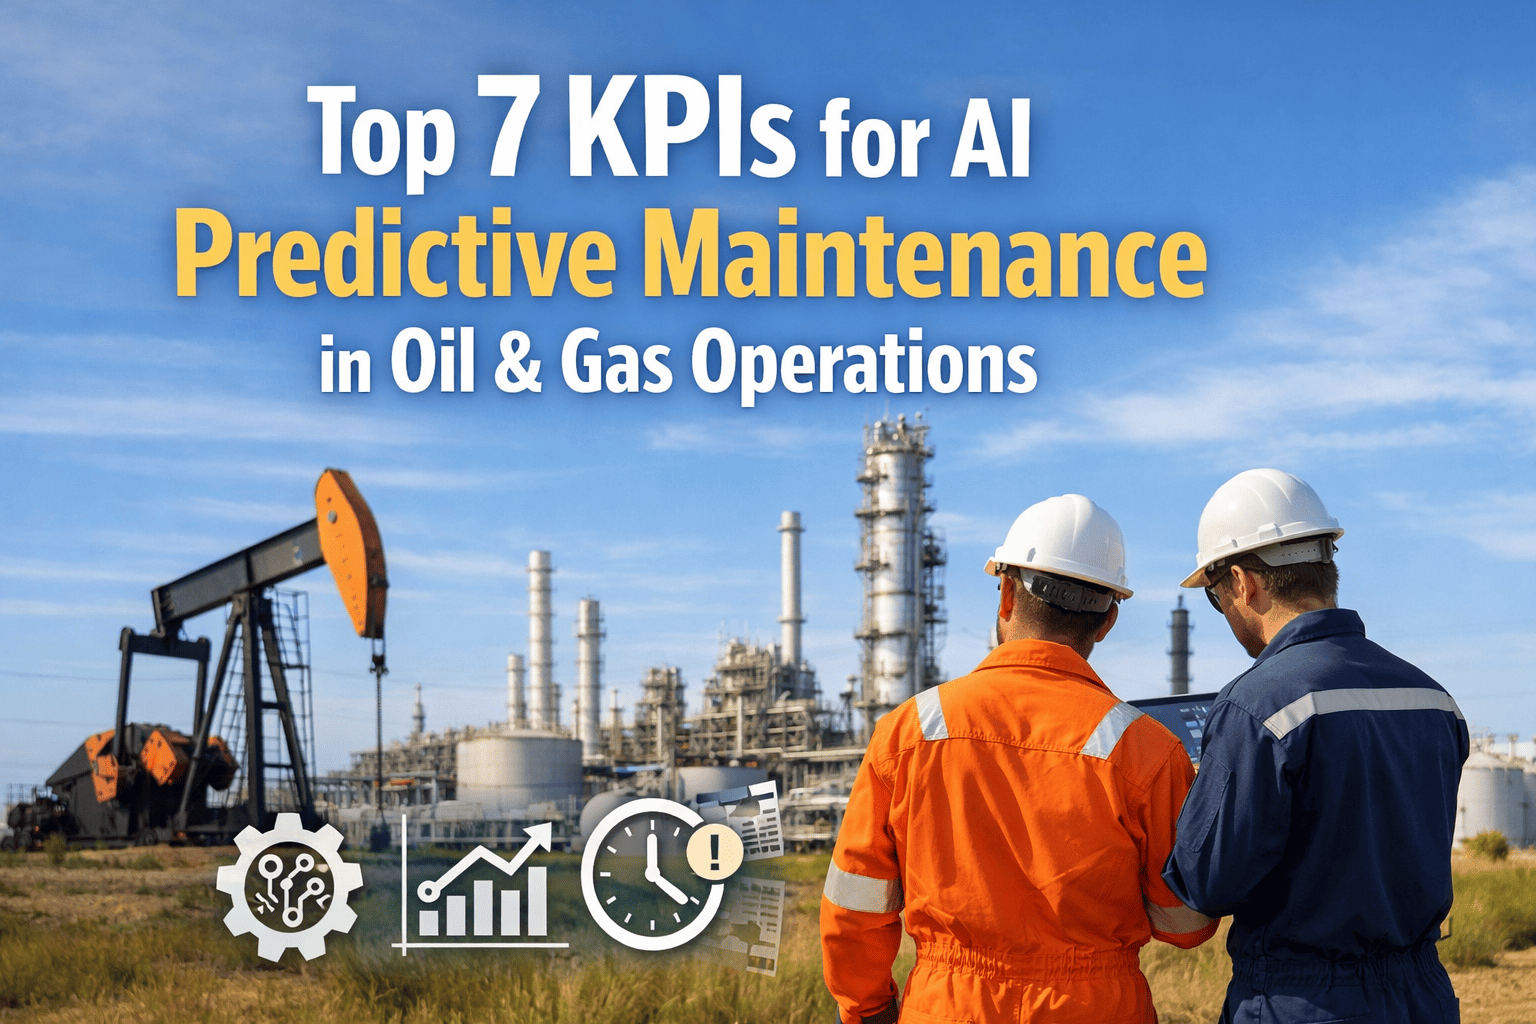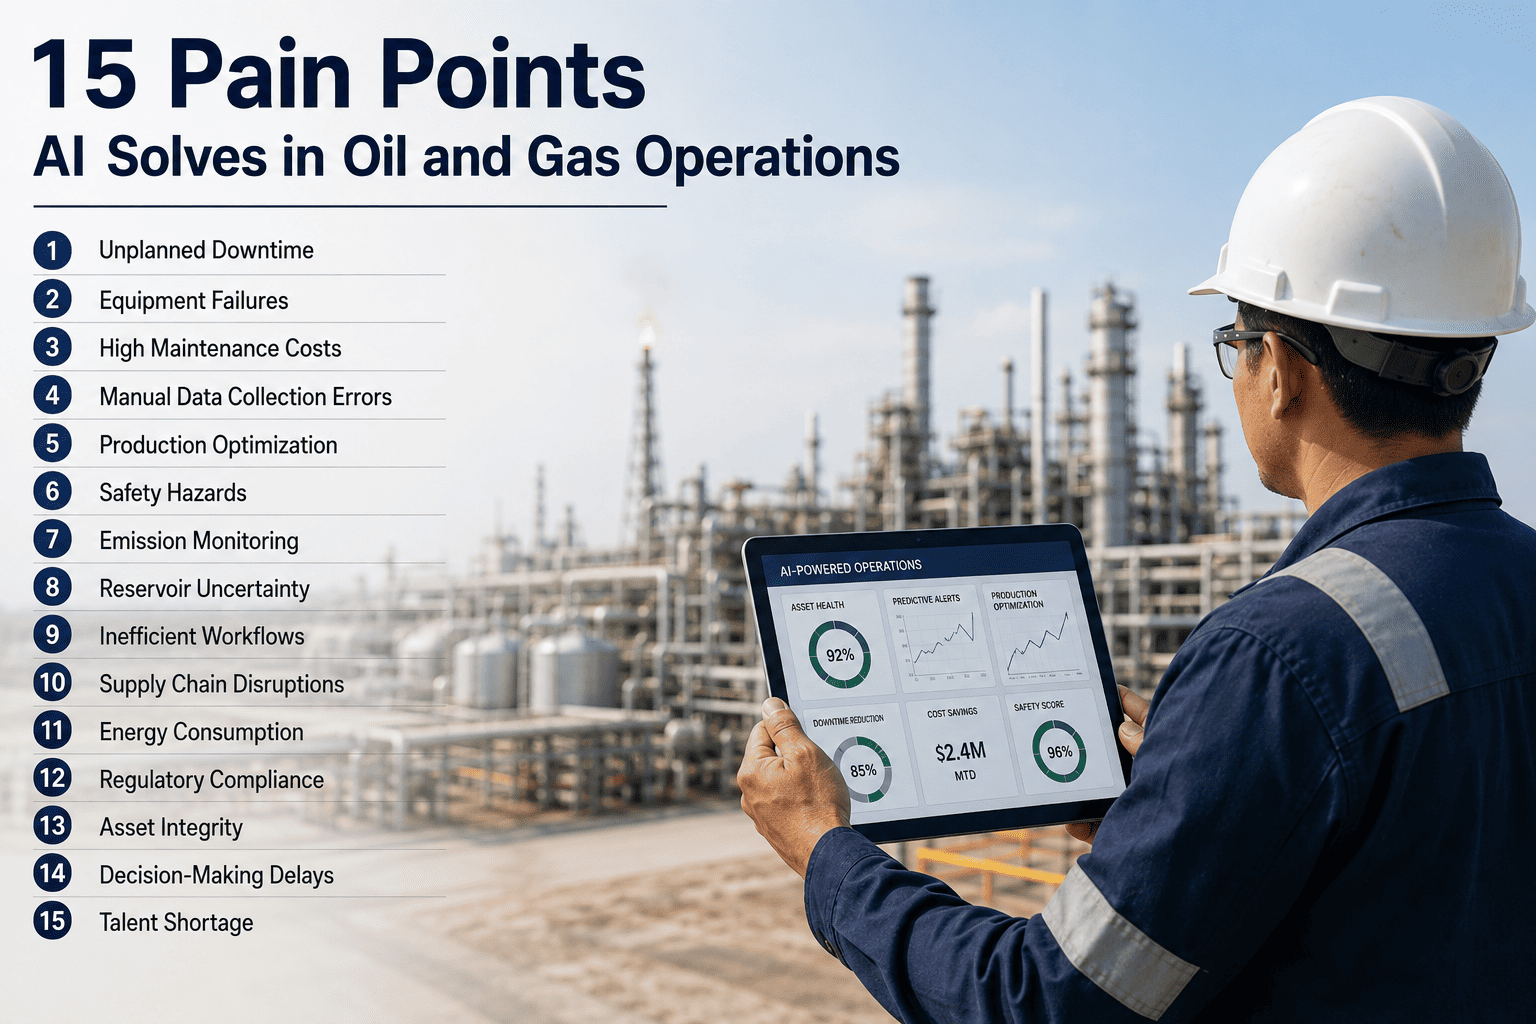
Every oil and gas operation carries the same handful of costly blind spots, whether the asset is a rod pump in a remote field, a pipeline crossing three states, or a crude unit running a turnaround. Unplanned downtime alone costs the sector close to fifty billion dollars a year, and most of it traces back to the same fifteen recurring problems: failures nobody saw coming, inspections that happen too late, and schedules built on guesswork instead of data. AI does not fix all fifteen with one tool, but it fixes each one the same way, by turning sensor data that already exists into a warning early enough to act on. Book a 30-minute scoping call to see which of these fifteen are costing your operation the most.
15 Costly Blind Spots, Solved the Same Way
Upstream, midstream, and downstream operations each have their own version of the same failure: a condition that was visible in sensor data for days or weeks before anyone noticed, because nobody was watching continuously. iFactory correlates the vibration, pressure, flow, and inspection data your operation already generates into early, specific warnings across all three segments, from a single rod pump to a full refinery turnaround.
The Scale of the Problem, Segment by Segment
Unplanned downtime, reactive maintenance, and delayed detection show up differently in each segment of the business, but every figure below points at the same root cause: a warning sign that existed in the data long before it became an incident.
estimated annual cost of unplanned interruptions across the global oil and gas sector
of refinery unplanned shutdowns that trace back to reactive, rather than predictive, maintenance
of total production cost that maintenance alone represents, depending on asset type
typical detection lag on a conventional pipeline leak alarm before a significant release is confirmed
Five Pain Points in Exploration & Production
Upstream assets sit in remote, often unmanned locations, where a technician visit is expensive and a failure can go unnoticed for days.
Rod pump & artificial lift failures
A worn valve, a parting rod, or a fluid pound condition often runs for days before anyone reviews the dynamometer card. AI reads every stroke automatically, classifying the downhole card shape and flagging degrading conditions while there is still time to adjust rather than replace.
Slow drilling penetration rates
Rig time is one of the most expensive line items in a drilling program, and manual parameter adjustment leaves performance on the table. AI-guided automated drilling controls have delivered penetration-rate gains of roughly 30 percent in reported deployments, translating directly into fewer days on location.
Slow production-optimization decisions
Deciding how to adjust choke settings, injection rates, or well allocation used to take days of manual review. Integrated production-optimization models compress that decision cycle from days to hours, so a producing asset responds to changing conditions instead of lagging behind them.
Wellhead & instrumentation wear
Stuffing box leaks, worn rod guides, and misaligned pumpjacks are common failure points that develop gradually and are easy to miss on an infrequent field visit. Continuous condition data lets an AI model flag the gradual drift toward failure long before a leak or a broken polished rod forces an emergency call.
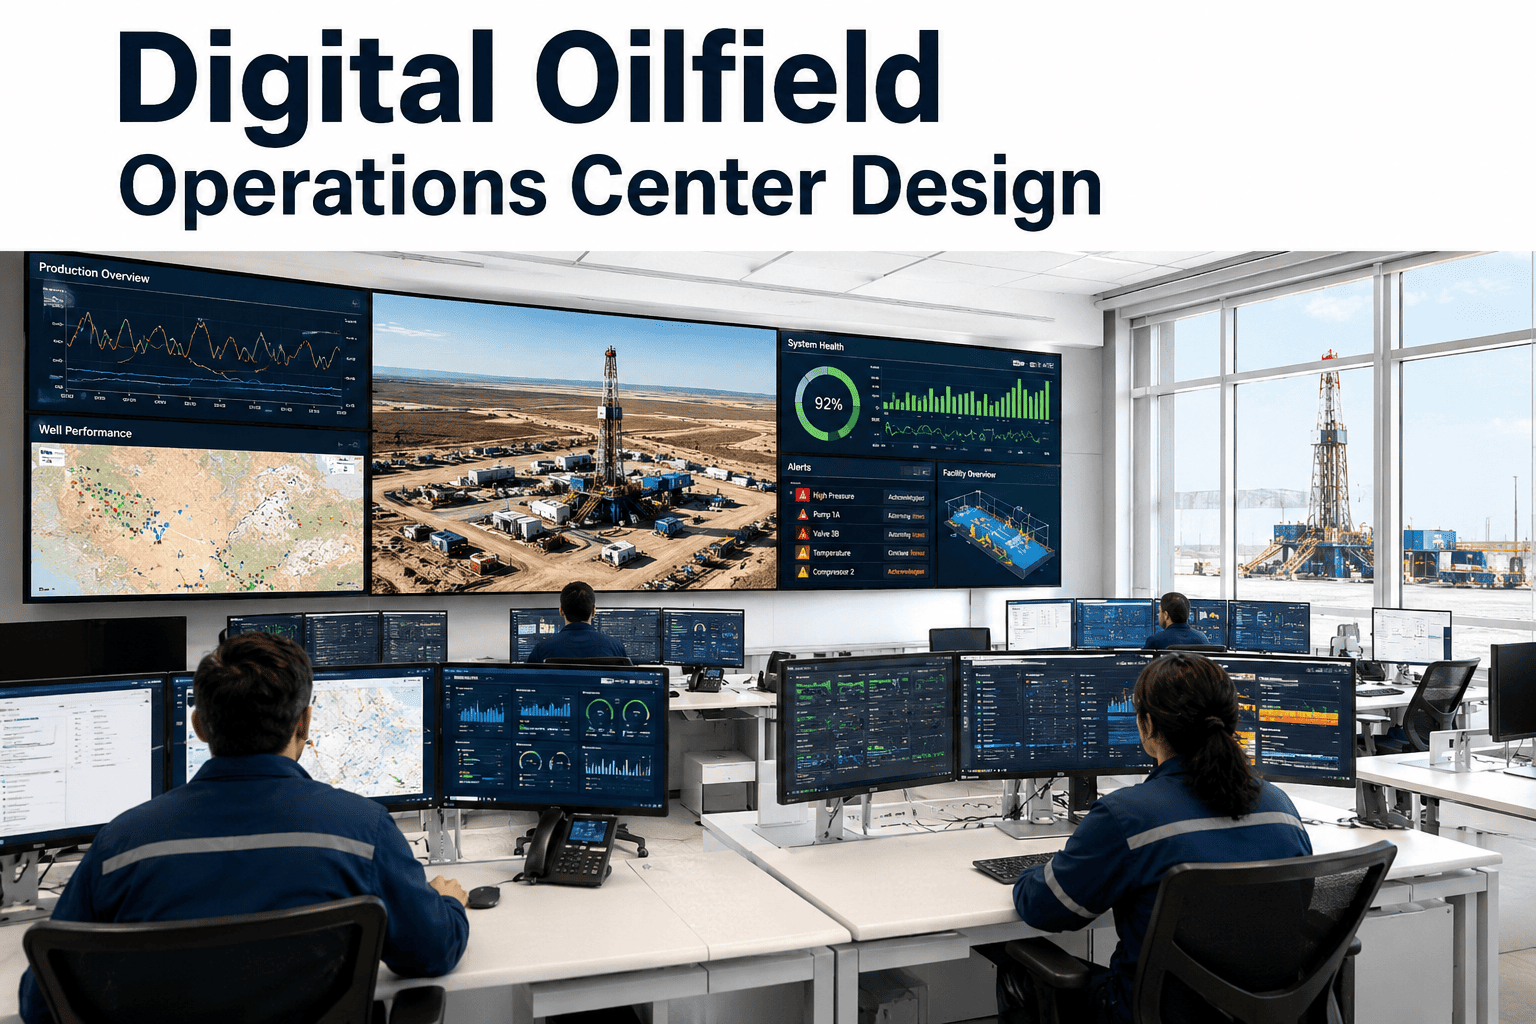
Poor visibility into remote, unmanned fields
Sending a technician to check on a single well is rarely economical, which means most remote assets are checked far less often than a producing well actually needs. Remote monitoring keeps every well under continuous watch and routes a technician only when the data actually calls for one.
Five Pain Points in Pipelines & Transport
Midstream assets span hundreds or thousands of miles, operate underground or underwater, and cannot be physically inspected continuously.
Slow pipeline leak detection
Conventional pressure-balance detection only catches leaks above roughly 1 to 3 percent of throughput and typically lags a real event by 30 to 60 minutes. AI acoustic and pressure-fusion monitoring has cut that detection time to under 12 minutes in tested deployments, a difference that matters both operationally and for regulatory reporting.
Corrosion and deposit buildup between inspections
Corrosion probes, particle counters, and water analyzers often run as three separate systems, reviewed on three separate schedules, so a developing deposit trend goes unnoticed until a pig run confirms it. Correlating the three streams together turns three quiet instruments into one early, specific warning.
Compressor station unplanned downtime
A single compressor failure can cost $500,000 or more once lost production, emergency repair, and environmental remediation are factored in. Vibration, temperature, and pressure trending flags the deterioration pattern days or weeks ahead, turning an emergency repair into a scheduled one.
Distinguishing real threats from normal variation
Not every pressure or acoustic anomaly is third-party interference or mechanical damage; many are ordinary variation in flow or ambient conditions. AI pattern recognition trained on labeled event history separates a real threat from background noise far more reliably than a fixed alarm threshold.
Inefficient logistics and distribution routing
Truck and rail scheduling built on static routes leaves capacity and fuel cost on the table when demand or terminal conditions shift. Dynamic route optimization adjusts continuously to demand, terminal capacity, and delivery windows instead of running a route plan built once a quarter.
Which of These 15 Are Already Costing You?
Bring your existing sensor and inspection data to the call. iFactory maps which of these fifteen pain points are already showing up in your own operation, and what an early warning would have looked like.
Five Pain Points in Refining & Processing
Refineries run thousands of interconnected, high-temperature, high-pressure processes where a single unplanned shutdown can cost over two million dollars a day.
Reactive maintenance driving unplanned shutdowns
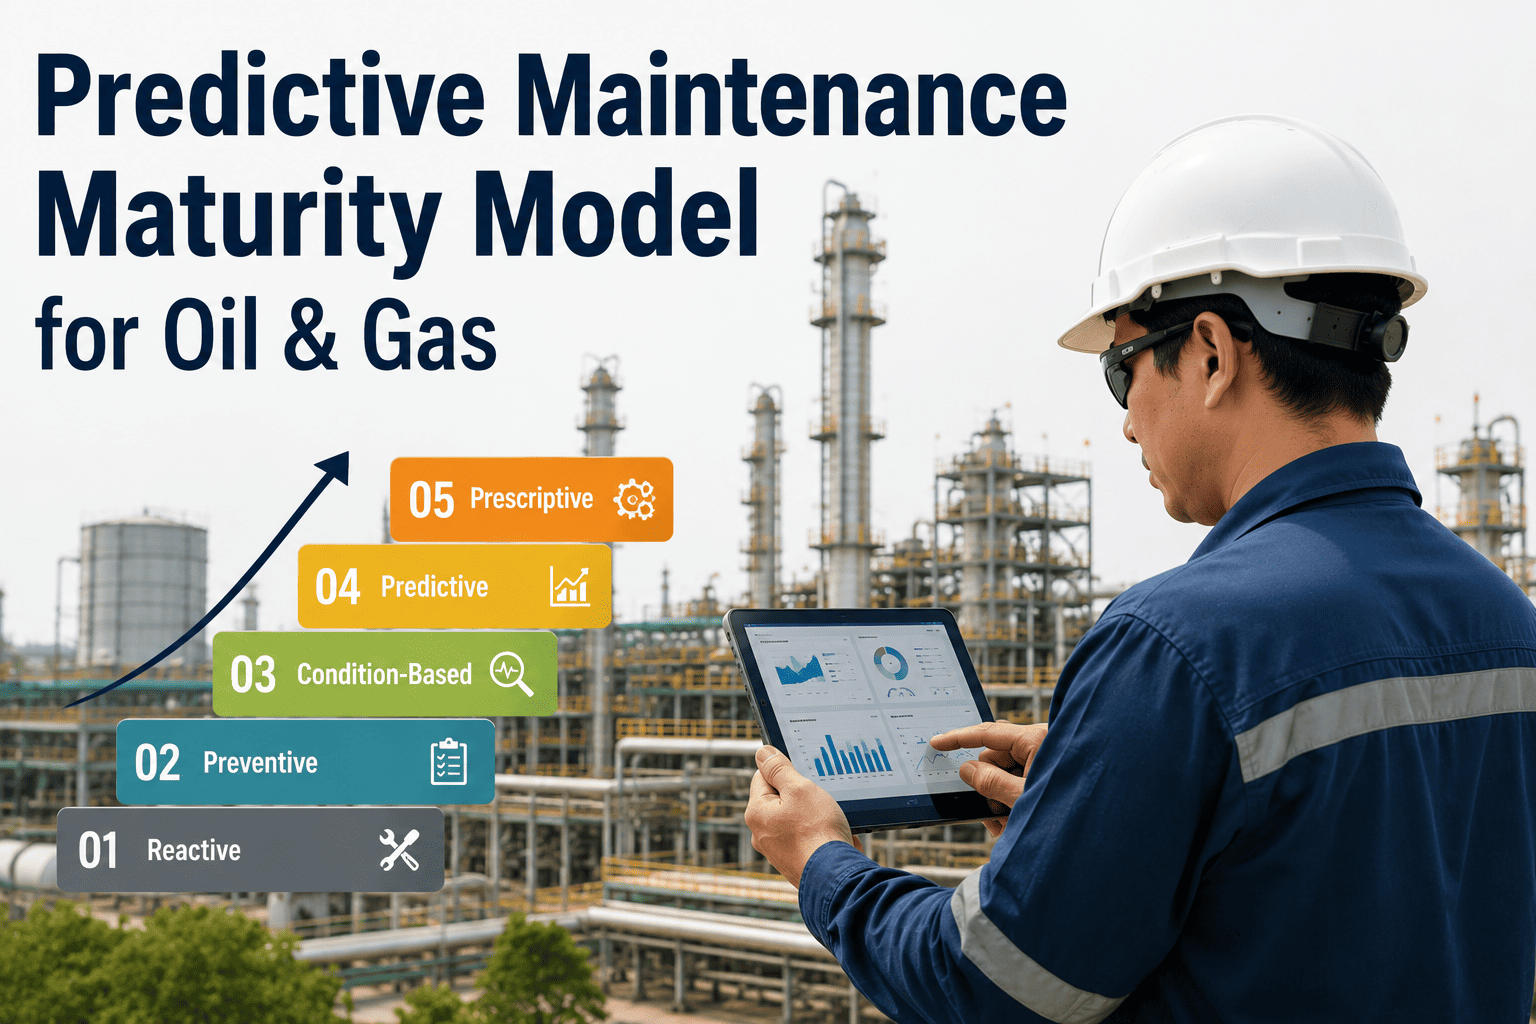
Reactive approaches are behind 52 percent of refinery unplanned shutdowns, each costing between $800,000 and $2.1 million a day in lost production and off-spec penalties. Predictive models trained on vibration, temperature, and pressure data flag bearing and pump degradation days or weeks before a forced trip.
Heat exchanger fouling
Fouling builds gradually inside a heat exchanger, quietly eroding thermal efficiency long before it forces an unplanned cleaning cycle. Continuous trending of approach temperature and pressure drop flags the fouling rate early enough to schedule cleaning during planned downtime instead of an emergency one.
Turnaround scaffolding & schedule delays
Turnaround schedules routinely slip when scaffolding, permits, and work-package sequencing are tracked on spreadsheets that cannot react to a delayed delivery or a re-prioritized job. AI-optimized turnaround sequencing re-plans the critical path automatically as conditions change, keeping the highest-cost days of the year on schedule.
Catalyst degradation & yield loss
Catalyst activity declines gradually across a run length, and a fixed replacement schedule either wastes remaining catalyst life or runs too long and loses yield. AI models trained on feed quality and conversion data predict remaining catalyst life and recommend the replacement window that protects yield.
Inconsistent product blending & quality
Manual blend adjustment leaves quality variability that shows up as give-away or, worse, an off-spec batch caught only after the fact. Predictive quality control during blending flags a drifting property in real time, before the batch is finished, not after a lab sample comes back.
All 15 Pain Points at a Glance
A quick reference across all three segments, for teams comparing where to start.
What Changes When These Are Solved Together
Figures reported across predictive maintenance and AI monitoring deployments spanning upstream, midstream, and downstream operations.
We used to treat rod pumps, pipeline integrity, and refinery reliability as three completely separate problems handled by three separate teams. What changed our thinking was realizing every one of them fails the same way: the data showed the problem forming days or weeks before anyone acted on it. Once we started treating early detection as one capability instead of fifteen separate tools, the whole reliability program got simpler to run, not more complicated.
annual industry-wide cost of unplanned interruptions this addresses
recurring pain points across upstream, midstream, and downstream operations
early-detection approach applied consistently across every one of them
Frequently Asked Questions
Do we need to solve all 15 pain points at once, or can we start with one?
Most operators start with whichever pain point is currently the most expensive, whether that is rod pump failures in the field, pipeline leak detection lag, or refinery unplanned downtime. The underlying approach, correlating existing sensor and inspection data into early, specific warnings, carries over cleanly from one pain point to the next, so an early win in one segment builds directly toward the others. Book a scoping call to identify which of the fifteen is costing you the most right now.
Do we need new sensors and instrumentation for each of these, or can this run on what we already have?
The large majority of these fifteen pain points can be addressed using data your existing load cells, corrosion probes, vibration sensors, and process instrumentation are already producing. The gap is almost always correlation and continuous review, not missing hardware, though a specific gap in coverage is sometimes identified and filled during onboarding.
How is this different from the point solutions we already have for leak detection or predictive maintenance?
Most operators already run individual tools for individual problems, a leak detection system here, a vibration monitoring platform there, each isolated from the others. iFactory is built to correlate data across asset types and segments under one platform, so a pattern that spans a pipeline, a compressor station, and a downstream unit is visible as one connected picture instead of three unrelated alerts.
Can this scale from a single upstream field to a full integrated operation?
Yes. The platform is built to onboard one segment or one asset class first, whether that is a single field's rod pumps or one refinery's rotating equipment, and expand outward once the model is validated. Integrated operators typically start upstream or downstream, wherever the largest cost currently sits, and add segments as each one proves out.
What does it take to get started on our highest-priority pain point?
A scoping call reviews your current instrumentation, identifies which of the fifteen pain points is showing up most clearly in your own data, and outlines a fixed-timeline pilot for that specific asset class or segment. Talk to a specialist to walk through your current setup before the call.
Find Out Which Pain Points Are Costing You
Book a 30-minute scoping call and bring your current sensor and inspection data. iFactory maps which of these fifteen pain points are already showing up in your operation and builds a fixed-timeline pilot proposal for the one costing you the most.