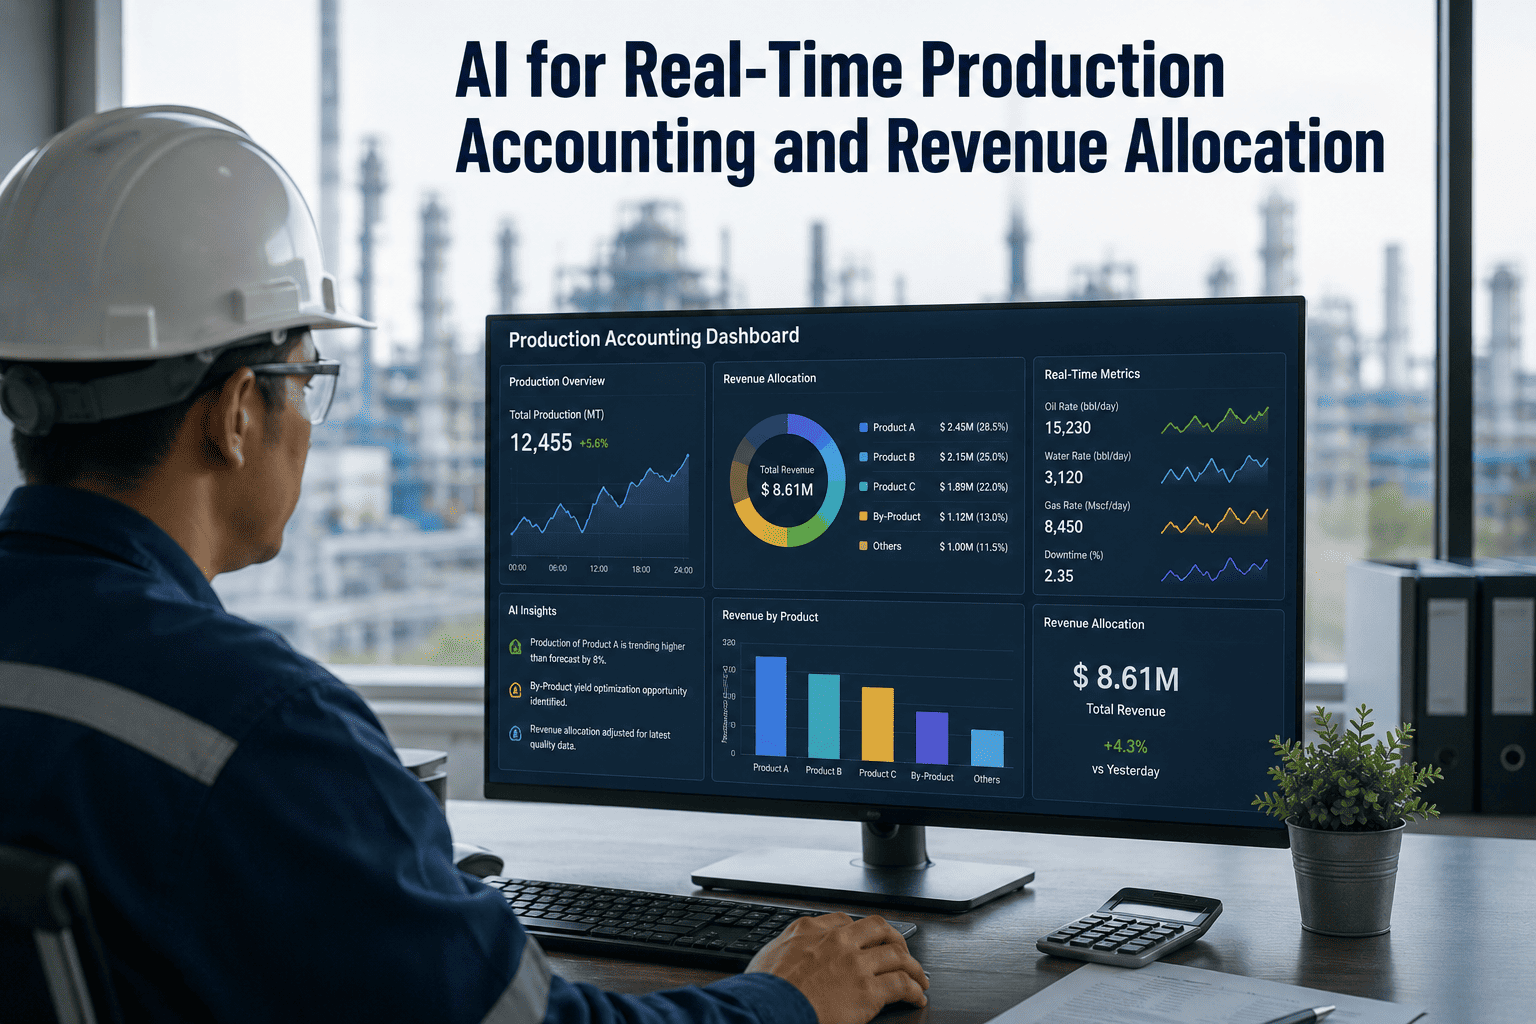
Month-end production close is one of those upstream rituals that everyone accepts as broken and nobody has time to fix. Field data trickles in from wellheads, test separators, and pipeline meters over 30 days. Someone reconciles it against sales meter totals in a spreadsheet. Allocation factors get applied — usually from a well test that ran three weeks ago. Partners dispute the results. Adjusted entries reopen prior periods. By the time revenue statements land, the underlying production data is already 45 days old and any discrepancy has 30 days of financial exposure baked in. Real-time production accounting collapses that entire cycle. Instead of reconciling at month-end, AI reconciles continuously — well tests, separator measurements, and pipeline metering all cross-checked as the data arrives, imbalances flagged the same day they happen, and validated volumes handed straight to revenue and joint interest billing. To model what this shift means for your operations, the iFactory support team can walk through your current allocation architecture.
Upstream Intelligence · Real-Time Allocation
Reconcile Every Well, Every Meter, Every Day — Not on the 15th of Next Month.
AI reconciles well test data, separator measurements, and pipeline metering in real time. Imbalances surface within hours. Revenue allocation runs on validated volumes. Month-end close stops being a fire drill and becomes a formality.
30 days
Financial exposure eliminated per cycle
1-2%
Typical imbalance tolerance enforced
Same-day
Discrepancy detection vs. month-end
50%+
Reduction in adjusted entries
Why Month-End Breaks
Five Places Production Accounting Fails on the Old Model
Every operator with more than a handful of wells has seen these failure modes. They are not isolated — they compound. A test that has drifted feeds a stale allocation factor, which pushes a bad volume into revenue, which surfaces as a partner dispute 45 days later, long after anyone remembers the source. The pattern below is what real-time reconciliation is built to break. Each of these five failure modes has been documented across dozens of upstream operations in the industry literature, and each one persists for the same reason: the reconciliation cadence does not match the rate at which the underlying data actually changes. Monthly reconciliation was designed for a world where field data arrived on paper tickets. That world is gone; the reconciliation model that grew up around it has not caught up.
01
Well Test Drift
Allocation factors are set from a well test that ran days or weeks ago. Reservoir performance moves. Choke settings change. Water cut climbs. By the time the factor is applied to the current month, it is describing a different well than the one currently producing.
02
Meter Calibration Drift
Coriolis, turbine, and multiphase meters drift out of calibration over time. Correction factors go stale. Nobody flags it because nobody is monitoring the correction factor trend systematically, so the drift shows up as unexplained imbalance months after it started.
03
Spreadsheet Reconciliation
Month-end reconciliation happens in a spreadsheet, done by one person, checked by another, subject to formula errors and copy-paste mistakes at every step. Detailed audit trails exist only if someone remembered to save the intermediate files.
04
PVT and Sample Currency
Allocation calculations depend on PVT properties and fluid samples that were characterized months or years ago. As reservoir depletion progresses, the numbers stop matching physical reality — but the allocation math keeps producing outputs anyway.
05
Delayed Partner Disputes
By the time a working-interest partner disputes an allocation, the underlying data is 45 to 60 days old, everyone involved has moved on to the current month, and the reconciliation requires reopening prior periods. Adjusted entries proliferate.
The Reconciliation Loop
How Continuous Reconciliation Actually Works
Real-time reconciliation is not just faster reporting. It is a fundamentally different data flow — one where discrepancies get caught in the same window they occur, not 30 days after. Here is how the loop runs. The important distinction is that each of the five layers below is running continuously against live data rather than being executed once per month. The traditional workflow batched all of them into a single month-end sequence, which is what created both the 30-day exposure window and the intense fire drill around the close date. Continuous processing eliminates both the exposure and the fire drill without changing the underlying calculations or the audit standards those calculations have to meet.
Layer 1
Continuous Ingestion
SCADA and field data captured minute-by-minute from wellheads, test separators, group separators, tank batteries, and pipeline meters. No monthly batch. No manual re-entry.
Layer 2
Validation and Anomaly Detection
AI cross-checks measurements against expected ranges, historical patterns, and physical constraints. Meter drift, dead-band anomalies, and impossible readings flagged within hours rather than at month-end.
Layer 3
Allocation Engine
Well-level volumes back-allocated using current test data, refreshed correction factors, and up-to-date PVT properties. Ownership structures applied. Contract terms and division-order logic enforced.
Layer 4
Imbalance Alerting
When pad-level totals from individual well allocations diverge from sales meter totals beyond your contractual tolerance — typically 1 to 2 percent — the system alerts before month-end, not after.
Layer 5
Revenue and JIB Handoff
Validated allocated volumes flow directly into revenue distribution and joint interest billing. Month-end close runs on data that has already been reconciled, not on data waiting to be reconciled.
Allocation Methods
Which Allocation Approach Fits Your Operation — and How AI Improves Each One
There is no universal allocation method. Well test allocation dominates conventional operations. Continuous multiphase metering shows up on high-value wells. Back-allocation reconciles differences between measurement points. Each method has its own accuracy envelope, cost profile, and failure mode — and each one gets better when AI handles the reconciliation. Most operating portfolios end up using more than one method in parallel: well test allocation for the majority of conventional wells, multiphase metering on a handful of critical or regulator-required installations, and back-allocation for commingled streams at shared facilities. The reconciliation platform has to handle all three simultaneously and reconcile them against each other where they overlap, which is where a lot of manual reconciliation processes fall down.
Well Test Allocation
Conventional operations, most common approach
Each well routes through a test separator periodically — typically 12 to 24 hours — establishing an allocation factor that gets applied until the next test.
Where AI helps
Monitors test factor drift against continuous separator and pipeline readings. Flags when a well's real performance has diverged from its last test result, triggering re-test scheduling before allocation exposure builds up.
Continuous Multiphase Metering
High-value wells, regulatory installations
Individual multiphase flow meters deliver real-time rate measurements per well. More accurate than periodic testing but capital-intensive at $20K to $100K per well.
Where AI helps
Compares MPFM totals against pad sales meter totals continuously. Alerts on imbalances beyond contractual tolerance the same day. Tracks PVT update schedules against well performance milestones to keep correction factors current.
Back-Allocation
Shared facility, commingled streams
Total measured volume at a downstream point is apportioned back to contributing wells using allocation factors derived from tests, models, or network calculations.
Where AI helps
Runs network reconciliation continuously. Detects when back-allocation math no longer closes against measured totals. Surfaces which upstream measurement point is drifting, so the fix targets the actual source rather than proportionally spreading the error.
Get a Real-Time Audit of Your Current Allocation Accuracy
iFactory will connect to your existing SCADA and production accounting stack in a pilot window, run continuous reconciliation against your current month, and show where imbalances are hiding right now — before they surface as partner disputes at month-end.
The Revenue Math
Where Small Allocation Errors Become Large Revenue Numbers
A 1 percent allocation error sounds like rounding. Applied to a pad producing 10,000 barrels per day at typical price bands, it is a five-to-six-figure monthly exposure per pad. Applied across an operating portfolio, it is why "small" allocation issues consistently show up as material revenue restatements at year-end. The table below shows why the math forces the reconciliation cadence. It is worth noting that the numbers cut both ways — an operator with an undetected 1 percent error may be over-reporting to some partners while under-reporting to others, so the aggregate impact on revenue statements can look modest even when the individual partner exposures are significant. This is exactly the failure mode that generates the year-end disputes and adjusted entries that consume disproportionate accounting and legal time.
Scenario
Pad Production
Error Rate
Monthly Exposure
Small pad, tight tolerance
2,000 BOPD
1%
Mid five figures
Mid-size pad, average drift
10,000 BOPD
1.5%
Low six figures
Large pad, quarterly re-test cadence
25,000 BOPD
2%
Mid six figures
Full portfolio, meter drift undetected
100,000 BOPD
1%
Seven figures
Illustrative ranges at representative commodity price bands. The point is not the exact numbers — it is that the exposure scales linearly with production and the cadence of your reconciliation.
The Architecture
What Sits Between Your SCADA and Your Revenue System
A real-time production accounting layer is not a rip-and-replace. It sits between your existing data sources and your existing revenue and JIB systems, adding continuous reconciliation without breaking anything you already run. Here is what the stack looks like in a typical deployment. The three-tier structure below is what makes the deployment achievable in weeks rather than quarters — the source layer and the consumption layer both remain the systems your team already knows, and the reconciliation layer inserts between them without demanding process changes anywhere else in the workflow. This is the pattern that lets a production accounting group adopt continuous reconciliation without renegotiating vendor contracts, retraining on a new revenue platform, or changing how JIB statements get generated.
Source Layer
SCADA, Historians, Field Data Capture
Your existing measurement infrastructure. Wellhead meters, test separators, group separators, tank gauging, pipeline metering. No replacement — the platform reads from whatever you have.
Reconciliation Layer
iFactory AI Production Accounting
Continuous ingestion, validation, allocation, imbalance detection, and audit trail. Runs 24/7 against live field data. Feeds validated volumes to downstream systems.
Consumption Layer
Revenue Distribution, JIB, Regulatory Reporting
Your existing revenue, joint interest billing, division-order, and regulatory reporting systems. They receive validated volumes rather than raw meter data waiting to be reconciled.
From the Advisory Bench
What a Defensible Allocation Program Actually Requires
"What separates a defensible allocation program from one that generates regulatory findings is three things: a documented PVT update schedule tied to well performance milestones, a real-time comparison between MPFM reported totals and sales meter totals at the pad level, and an alert system that fires when the imbalance exceeds your contractual tolerance — typically 1 to 2 percent. Manual spreadsheet reconciliation at month-end catches problems after they've accumulated 30 days of financial exposure. A connected production intelligence platform catches them the same day."
Production Engineering Lead, Upstream Oil & Gas Operations, iFactory AI Advisory
Partner Impact
What Continuous Reconciliation Means for JIB and Working-Interest Partners
Production accounting does not live in isolation. Every allocation error, every stale factor, every delayed correction eventually shows up on a joint interest billing statement or a revenue check to a working-interest partner. Continuous reconciliation changes what those partners experience — not just what your internal team sees.
Faster JIB Cycles
Cost allocations to partners are tracked as transactions happen rather than reconstructed at month-end. JIB statements go out with validated volumes rather than volumes flagged for later correction. Partner disputes drop because the data behind the statement is defensible from day one.
Fewer Adjusted Entries
Reopened prior periods and adjusted entries are the traditional cost of monthly reconciliation. Continuous validation catches the discrepancies before they enter revenue systems in the first place, so the volume of corrections traveling backward through the books drops by half or more.
Defensible Dispute Position
When a partner does dispute an allocation, the operator's response is a query against an immutable audit trail rather than a spreadsheet archaeology project. The calculation history exists at the time of the dispute, complete with source measurements, applied factors, and validation results.
Regulatory Confidence
State severance tax authorities and federal regulators receive supporting data that is generated continuously and archived automatically. Audit responses shift from weeks of preparation to hours of documented output, and the record itself is stronger because it was captured in real time.
Turnkey AI Deployment
How iFactory Ships a Real-Time Production Accounting Program
A real-time reconciliation platform is not something you install off a disc. It is data connectors, allocation engines, validation models, and integrations to your revenue stack. iFactory delivers this as a turnkey system so your first pad is running continuous reconciliation inside eight weeks — no multi-quarter integration project required. The four cards below cover the actual deployment scope so nothing about connectivity, model tuning, or user training sits outside the program. This turnkey model is why operators can move from "we should look at real-time reconciliation" to "we are running it on a pilot pad" inside a single quarter instead of the multi-year timelines that used to define production accounting modernization projects.
Hardware and Software Bundled
Pre-configured NVIDIA AI server for reconciliation processing ships racked and ready. Data connectors for common SCADA and historian platforms pre-configured. AI allocation and validation models tuned to your operation during pilot. Rack it, plug power and Ethernet, and the AI is live.
Full Integration Scope
SCADA and historian connectors, PLC integration, connectors to Quorum, W Energy, or your existing production accounting stack, revenue system handoff, JIB integration, operator training, and 24 by 7 remote monitoring. Included in scope.
Live in 6 to 12 Weeks
Three-phase rollout — pilot pad in six weeks, expansion to full operating area by week ten, autonomous reconciliation loop live by week twelve. Trusted by 1,000+ clients with 99.9 percent uptime across the platform stack.
Operator-Friendly AI
Your production accountant types: "Show me pad-level imbalances above tolerance for this week." The system returns wells, meters, factor deltas, and suggested corrective actions. No data-science expertise required to run day to day.
Buyer Questions
Real-Time Production Accounting — Common Questions
Do we have to replace our existing production accounting system to run real-time reconciliation?
No. Real-time reconciliation sits between your data sources and your existing production accounting, revenue, and JIB systems. iFactory reads from your SCADA and historians, runs continuous validation and allocation, and hands validated volumes to whatever system you already use for revenue distribution and joint interest billing — Quorum, W Energy, or a custom stack. The point is not to rip out infrastructure that works; it is to eliminate the 30-day gap between when discrepancies happen and when someone notices them. Most deployments preserve every existing downstream system while replacing only the reconciliation layer.
Book a demo to see how it fits your architecture.
How does the AI actually decide when to flag an imbalance?
The alerting logic runs against your contractual and internal tolerance thresholds, which are typically 1 to 2 percent for pad-level imbalances between allocated well totals and sales meter totals. Beyond simple threshold checks, the AI monitors trend behavior — a 0.5 percent imbalance that has been growing for two weeks matters more than a 1.2 percent one-day spike from a known cause. The system distinguishes between measurement noise, meter drift, allocation-factor staleness, and physical operational changes so alerts land with a probable root cause rather than a raw imbalance number. Alerts route to production accountants and engineers based on the underlying failure mode.
What data quality is required from our SCADA to get real-time reconciliation working?
Baseline requirements are lower than most operators expect. The platform tolerates missing data, sensor gaps, and inconsistent time bases better than manual reconciliation does, because the validation layer is built to flag and route around bad measurements rather than propagating them. What matters is that measurement points exist at the boundaries — wellhead, test separator, group separator, sales meter — and that the SCADA is accessible via standard protocols. Meter drift and calibration issues are surfaced by the platform rather than assumed away, so poor-quality data becomes a visible operational problem rather than a hidden financial one.
How does this affect the regulatory reporting and audit trail we have to maintain?
The audit trail actually improves. Every allocation calculation, every applied factor, every reconciliation step is logged automatically with timestamp, source data, and the rules applied. Regulatory reports and partner statements can be traced back to source measurements through the platform without reconstructing anything from scattered spreadsheets. When state severance tax authorities or working-interest partners request supporting data for a specific volume, the answer is a query, not a file archaeology project. The immutable audit record also strengthens the operator's position on any allocation dispute, because the calculation history is available at the time of the dispute rather than reconstructed after the fact.
Contact support for a walkthrough of the audit trail structure.
What is the honest deployment timeline, and what does our team need to do?
A pilot on one pad or one operating area runs live in about six weeks from kickoff. Full field or operating-region coverage typically lands between weeks ten and twelve. On your side, we need a production accounting lead to coordinate on allocation rules and tolerance thresholds, someone from IT for the SCADA and historian connectivity, and one or two production engineers who become day-to-day users of the reconciliation dashboard. The turnkey scope includes hardware, software, connectors, integration, and operator training, so the internal effort is coordination and rule-setting rather than building the technical stack. Most operators see a full return on the platform cost inside the first two quarters through eliminated adjusted entries and reduced revenue leakage.
Stop Reconciling on the 15th. Start Reconciling on the Day It Happens.
AI-powered real-time production accounting — continuous ingestion, validation, allocation, and imbalance alerting between your SCADA and your revenue stack. Book a demo to see it running on a pilot pad, or contact support for an allocation architecture assessment built from your current measurement infrastructure, reconciliation cadence, and partner reporting requirements.