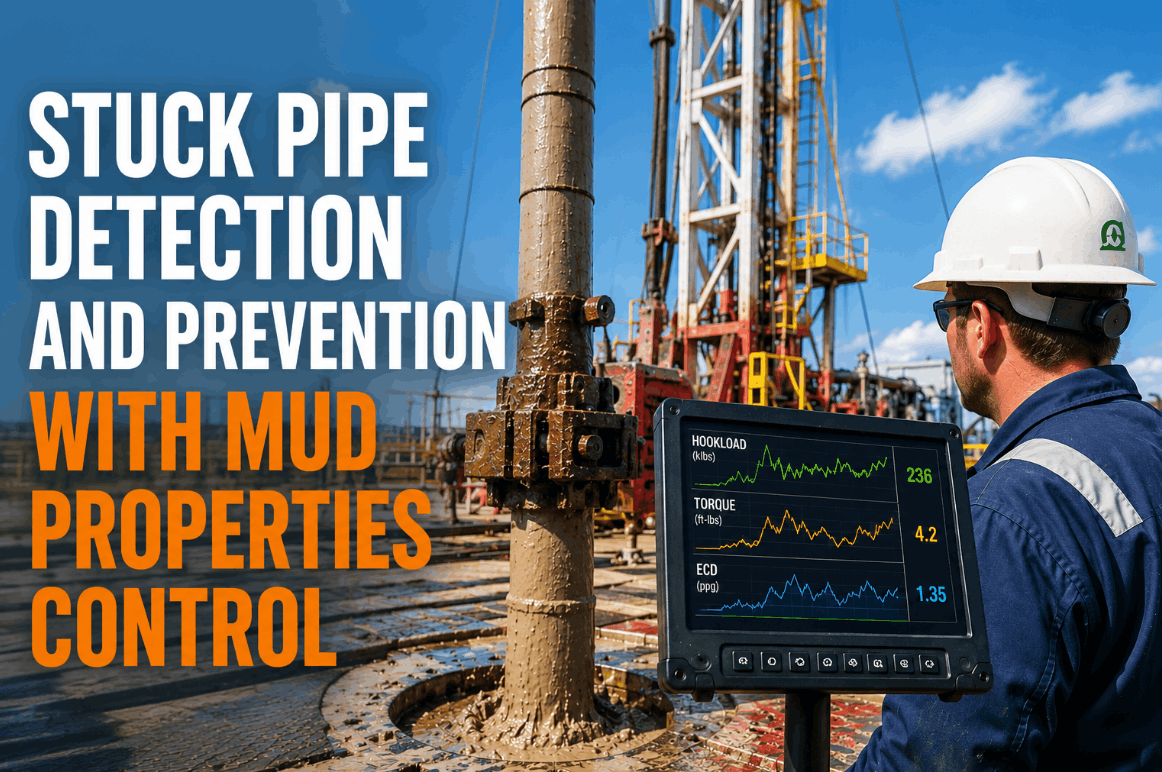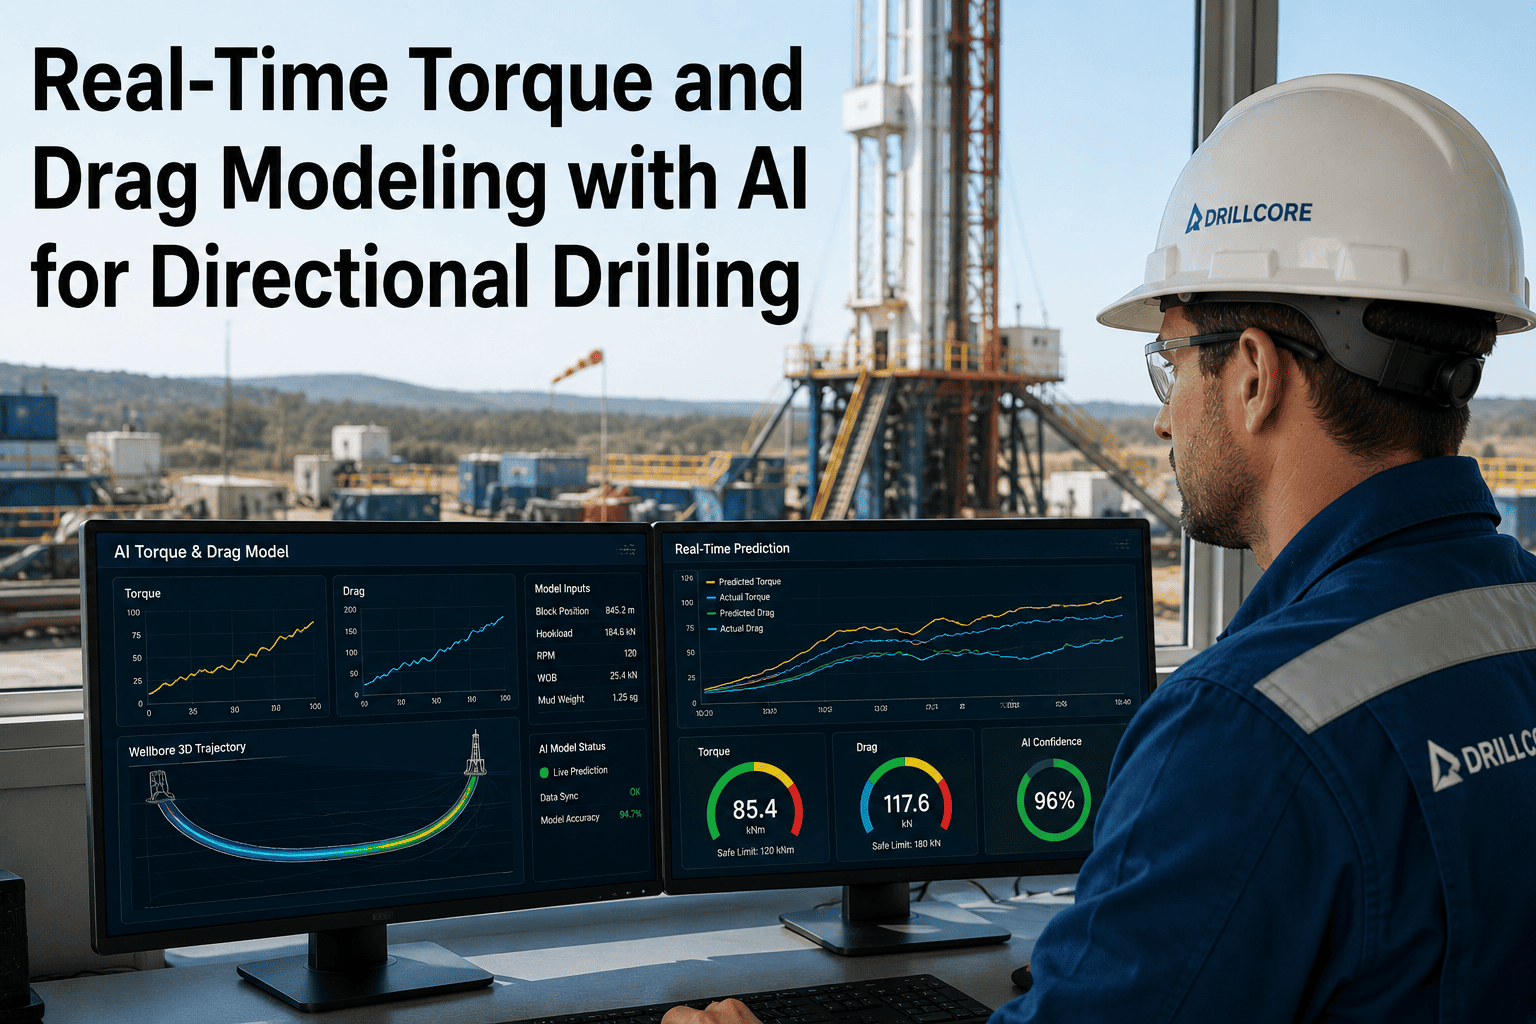
A torque and drag model gets built during well planning, calibrated against assumed friction factors and an idealized wellbore trajectory — and it starts drifting from reality the moment bit meets rock. Formation changes, cuttings accumulate in the annulus, mud properties shift, and the actual friction the drill string encounters rarely matches the number a planning engineer assumed weeks earlier. Most rigs still compare live hookload and torque against that same static plan for the rest of the well, which means a rising drag trend can climb for hours before anyone notices it's no longer tracking the model it was supposed to. Recalibrating that model continuously, rather than leaving it fixed from spud day, is what turns a plan-day estimate into a live decision-support tool the rig floor can actually trust. Visit iFactory's support page to see how this comparison typically works in practice.
Your Torque and Drag Model Was Accurate at 8 AM — Is It Still Accurate Now?
A planning-stage T&D model is built once and rarely touched again. AI rebuilds it continuously from live surface measurements and MWD data, comparing actual hookload and torque against a model that updates with every stand rather than a static assumption from the well program.
Why a Static Model Goes Stale Long Before the Well Is Finished
A torque and drag model is only as good as the friction assumptions it was built on, and those assumptions are a snapshot of what engineers expected before the bit ever touched the target formation. Stuck pipe accounts for a substantial share of total lost drilling time industry-wide, and in the cases where warning signs existed, they were often visible in the data well before the pipe actually stuck — the gap wasn't a lack of data, it was a model that never got updated to reflect what the well was actually doing. That gap compounds across a multi-well drilling program: the same friction miscalibration that costs a few rig hours on one well can repeat, largely unaddressed, on every subsequent well drilled through similar formation until someone specifically goes back and reviews the pattern.
The Planning-Day Assumption Trap
Friction factors chosen during well planning reflect offset well data and formation expectations, not the specific hole condition, mud losses, or cuttings load the current well is actually experiencing hour by hour.
The Single-Indicator Blind Spot
Watching hookload or torque in isolation misses the pattern — research into stuck pipe incidents consistently finds no single leading indicator present in every case, which is why a rising trend across multiple parameters together matters more than any one gauge.
What Feeds a Continuously Updated Torque & Drag Model
Recalibrating a T&D model in real time means pulling from the same surface and downhole data streams already flowing to the rig floor and the mud logging unit — the shift is in comparing them against a model that updates every stand instead of a plan that was finalized before spud.
| Data Source | Parameters | Role in the Model |
|---|---|---|
| Surface Measurements | Hookload, surface torque, rotary speed, pump pressure, flow rate | Provides the real-time signal compared continuously against model predictions |
| MWD Downhole Data | Downhole WOB, downhole torque, equivalent circulating density | Refines the friction calculation with actual downhole conditions rather than surface estimates alone |
| Directional Surveys | Inclination, azimuth, dogleg severity along the wellbore path | Defines the actual trajectory the model must calculate drag and torque against |
| Static Configuration | BHA design, drillstring components, casing and open-hole geometry | Sets the mechanical baseline the friction factor calibration is layered onto |
Two Signals, One Early Warning
The methodology behind automated stuck pipe prediction combines two distinct types of analysis running in parallel, and neither one alone is as reliable as the two together — which is exactly why an AI layer that can watch both continuously, across every parameter, catches what a driller scanning a few gauges is more likely to miss. This dual-signal approach also reduces false alerts, since a value that spikes briefly on deviation alone but shows no sustained trend behind it is far less concerning than one where both signals agree.
Deviation Analysis
Live hookload and torque are compared directly against what the continuously recalibrated model predicts for the current depth and trajectory — a growing gap between actual and predicted values is the first sign the wellbore condition has changed.
Trend Analysis
The rate of change across pump pressure, torque, hookload, and drag is tracked stand over stand, since a slow but steadily accelerating trend often precedes a stuck pipe event well before any single reading crosses an alarm threshold.
See Your Own Well's Drag Trend Against a Live-Recalibrated Model
iFactory connects to your existing surface and MWD data feeds and rebuilds the torque and drag model continuously — so a deviation gets flagged the stand it starts, not the shift it becomes obvious.
Friction Factor: The Number That Actually Drives the Risk
Case studies on torque and drag modeling consistently point to the friction coefficient as the parameter to watch most closely, with values approaching or exceeding roughly 0.4 associated with a meaningfully elevated stuck pipe risk. A continuously recalibrated model recalculates this coefficient from live data rather than holding it fixed at the planning-stage assumption, which is what allows a rising friction trend to be caught while there's still room to adjust mud properties or drilling parameters. The three ranges below aren't rigid, universal thresholds — the specific values that matter shift with mud system, formation, and well profile — but the general pattern of escalating response as friction climbs holds across most directional and extended-reach applications.
Friction consistent with planning assumptions and offset well data; standard drilling parameters continue without adjustment.
Friction trending above plan; mud weight, lubricity additives, or rotary parameters typically get reviewed at this stage.
Friction approaching levels associated with stuck pipe in case study data; active mitigation is generally warranted before continuing.
From First Deviation to Stuck Pipe: The Escalation Window
Stuck pipe rarely happens without warning — it happens without a warning system watching closely enough, continuously enough, to catch the escalation while there's still time to act. Understanding the typical progression is what turns a real-time deviation alert into an actual mitigation decision instead of just another number on a screen. Each stage below narrows the window for a low-cost intervention, which is exactly why the value of continuous monitoring concentrates so heavily in the earliest two stages rather than the last.
Early Deviation
Hookload or torque begins drifting slightly from the recalibrated model's prediction — often within normal noise range, but the direction is consistent rather than random.
Confirmed Trend
The deviation holds across multiple stands and shows up in more than one parameter at once — friction factor, drag, and torque trending together rather than an isolated blip in a single reading.
Elevated Risk Window
Friction factor approaches the critical range and the model's confidence in an impending stuck pipe event rises — this is typically the window where mud weight, hole cleaning, or trip planning decisions still have room to change the outcome.
Imminent Stuck Pipe
Torque or drag spikes sharply against the model prediction — by this stage, options narrow quickly, and the difference between catching it here versus two stages earlier is usually measured in rig days and cost.
Manual Gauge Watching vs. AI-Recalibrated T&D Monitoring
The underlying instrumentation on the rig is largely unchanged between these two approaches — what changes is how continuously the data gets compared against an accurate model, and how many parameters get checked together rather than one gauge at a time. The table below reflects the practical difference crews report once a continuously recalibrated model replaces gauge-by-gauge monitoring as the primary reference during directional sections.
| Aspect | Manual Gauge Watching | AI-Recalibrated Monitoring |
|---|---|---|
| Model Baseline | Static plan-day T&D model, rarely revised during the well | Recalculated continuously from live surface and MWD data |
| Parameters Watched | A driller scanning a handful of gauges at a time | Hookload, torque, pump pressure, friction factor, and trend rate together |
| Detection Method | Relies on an individual noticing a value looks off against experience | Deviation analysis and trend analysis run automatically, every stand |
| Warning Lead Time | Often only clear once a value crosses an obvious alarm threshold | Flagged at the earliest consistent deviation, before thresholds are breached |
What Changes When the Model Updates in Real Time
Directional drilling teams that move from a static plan-day model to a continuously recalibrated one typically report a shift in when problems get caught, not just whether they get caught at all — and catching a friction trend one stage earlier tends to be the difference between a mud weight adjustment and a fishing job. These shifts compound across a drilling campaign more than they show up on any single well, since the earlier-catch pattern repeats well after well once the monitoring becomes continuous rather than a one-off save.
Deviation and trend analysis together typically surface a developing risk stands before it would cross a fixed alarm threshold on a single gauge.
Catching an elevated friction trend early gives the drilling team room to adjust mud properties or parameters instead of tripping out reactively once torque spikes.
A continuously updated friction factor gives the mud engineer a current number to react to, rather than relying on a plan-day estimate that no longer reflects hole conditions.
Since stuck pipe accounts for a meaningful share of total lost drilling time industry-wide, catching the early stages consistently compounds into fewer NPT days across a well program.
Who Actually Uses This Data on a Live Well
A continuously recalibrated torque and drag model isn't a single-user dashboard — it's a shared reference that the directional driller, the mud engineer, and the drilling engineer onshore all need to be looking at the same way, at the same time, for the early warning to actually translate into a decision.
Directional Driller & Company Man
Uses the live deviation and trend signal to decide, in real time, whether to adjust rotary parameters, back off weight on bit, or pause to reassess before continuing into a section showing a rising friction trend.
Onshore Drilling Engineer
Reviews the same continuously updated model remotely, comparing the current well's friction trend against offset wells and flagging when a pattern warrants escalation beyond what the rig crew can decide alone.
Without both perspectives looking at a consistent, continuously updated model, a genuine early warning can still get lost in translation — the rig floor sees a number trending up, but the onshore team reviewing well-to-well patterns is the one positioned to recognize when that trend matches the early signature of a stuck pipe event on a nearby offset well.
Common Mistakes in Real-Time T&D Monitoring
Moving to a continuously recalibrated model introduces its own pitfalls, and most of them come from treating the automated output as a replacement for directional drilling judgment rather than a way to apply that judgment sooner and more consistently.
Watching One Parameter in Isolation
Reacting only to torque or only to hookload misses the cases where the strongest signal is a friction factor trend building quietly across several parameters at once.
Never Recalibrating the Baseline
Comparing live data against the original plan-day model throughout the entire well defeats the purpose — the model has to update as the wellbore condition genuinely changes, not stay fixed at spud-day assumptions.
Setting Alarm Thresholds Too Late
Waiting for a value to cross a dramatic, obvious threshold before flagging it discards the entire advantage of trend analysis, which is built specifically to catch a developing problem earlier than a threshold breach would.
Ignoring MWD Data When Available
Relying on surface measurements alone when downhole WOB, torque, and ECD are already being logged leaves real accuracy on the table — downhole data consistently improves how closely the model tracks actual conditions.
Frequently Asked Questions
Does this replace the torque and drag software used during well planning?
No. The planning-stage model still defines the well design and the friction assumptions used to size equipment and set initial parameters. What changes is that the same modeling approach keeps running once drilling starts, continuously recalibrated against live data rather than left as a fixed reference document from before spud. Visit support to see how a continuous model typically connects to an existing T&D software workflow.
What data does the rig need to already be capturing for this to work?
Standard surface measurements — hookload, torque, rotary speed, pump pressure, and flow rate — along with directional surveys and BHA configuration are the baseline requirements most rigs already log. MWD downhole data, where available, improves accuracy further but isn't required to get a meaningful continuous model running. Book a demo to see typical data connection requirements for your rig instrumentation.
How early can a stuck pipe risk actually be flagged before it happens?
It depends heavily on the specific mechanism at play, but combining deviation analysis with trend analysis across multiple parameters together generally surfaces a developing risk stands before a single gauge would cross an alarm threshold. Research into historical stuck pipe incidents consistently finds that some combination of indicators was already trending before the event, which is exactly the pattern continuous monitoring is designed to catch.
Can this help with mud weight optimization, or is it only for stuck pipe prevention?
Both. A continuously updated friction factor gives the mud engineer a genuinely current number to react to rather than a plan-day estimate, which directly informs mud weight and lubricity decisions well before friction reaches a level associated with stuck pipe risk. Contact support to see how friction trend data typically feeds into mud program adjustments.
Does this work across different well types — vertical, high-angle, and extended reach?
Yes, though the specific friction behavior and risk thresholds differ meaningfully between well types, since high-angle and extended reach wells generally carry higher baseline torque and drag than a vertical section. The model calibrates to the actual trajectory being drilled rather than applying one uniform threshold across every well type.
Catch the Drag Trend Before It Becomes a Stuck Pipe Report
iFactory rebuilds your torque and drag model continuously from live surface and MWD data — so friction trends, hookload deviation, and stuck pipe risk surface stands before they become a fishing job.