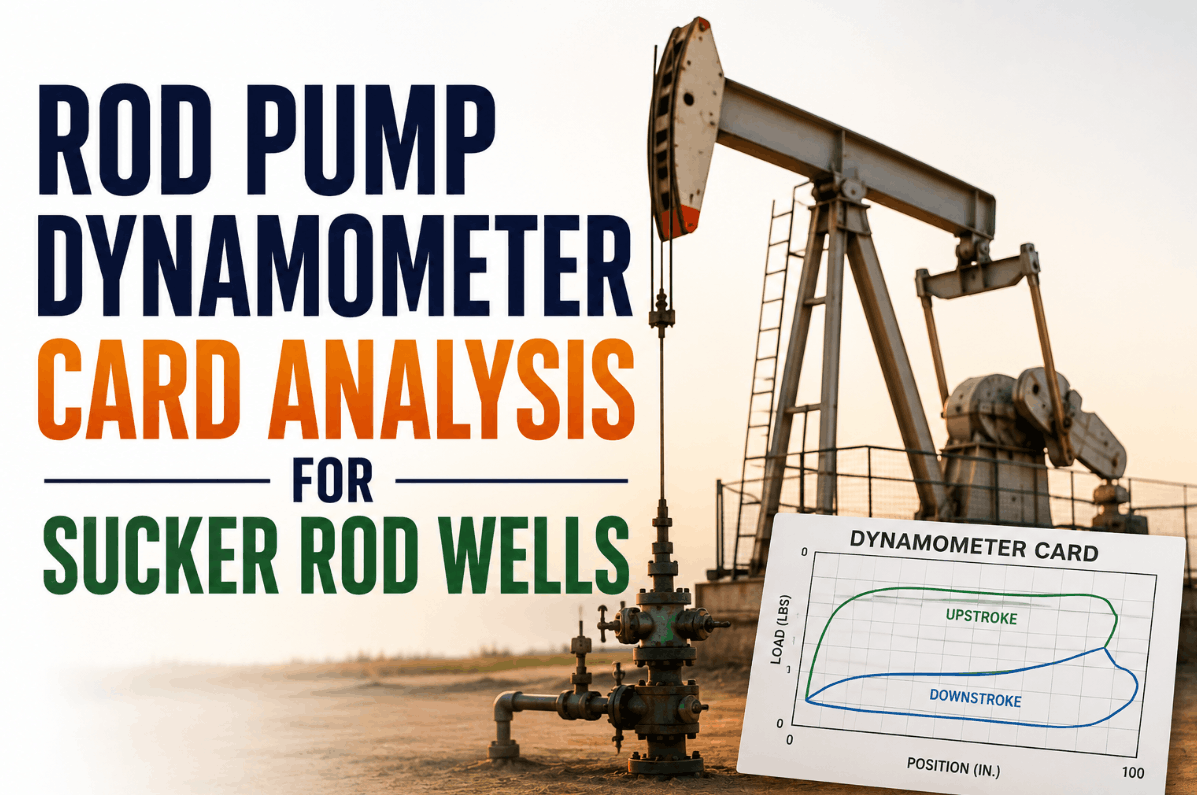
A dynamometer card is one of the richest diagnostic signals a sucker rod pump ever produces, plotting rod load against position to trace out a shape that quietly encodes whether the pump is filling properly, whether a valve is leaking, or whether a rod is about to part. The problem is that reading it well has always depended on an experienced pumper glancing at a plot and recognizing a pattern from memory, across dozens or hundreds of wells, on a schedule that rarely matches when a fault actually starts. AI classification changes that by scoring every card shape the moment it is captured. See how that works at ifactory support.
Every Card Shape Is Telling You Something. Most Go Unread.
AI that classifies dynamometer card shape in real time, catching gas interference, fluid pound, valve leaks, rod failures, and pump-off conditions the moment the pattern appears, not whenever a pumper next has time to look.
A Card Gets Captured Every Stroke. Almost None of Them Get Read.
Most rod pump installations already have the hardware to generate a dynamometer card on every stroke, and most of those cards are never actually looked at. A pumper managing a large lease has too many wells and too little time to open a card viewer for each one daily, so the routine becomes reactive: something is captured, but nobody looks until a well underperforms, stops producing, or trips out entirely. By the time that happens, the fault that would have been visible in the card shape weeks earlier has often progressed into a full failure, a stuck pump, or a parted rod string sitting at the bottom of the wellbore.
The shape itself is not subtle to a trained eye, but it is easy to miss on a glance and genuinely hard to standardize across a workforce with mixed experience levels. A slightly rounded corner where the standard valve card is expected to be sharp, or a card that fails to fully open on the downstroke, can mean the difference between a well that just needs a stroke-speed adjustment and one that needs a workover crew dispatched before the situation gets worse. AI removes the dependency on someone happening to look at the right moment.
The Card Shapes AI Is Trained to Recognize
A dynamometer card's shape is essentially a fingerprint of what the pump is actually doing downhole. Each fault condition distorts that fingerprint in a distinct, repeatable way, which is exactly what makes shape classification reliable once it is done consistently.
The card shapes above are the most common patterns, but severity within a single fault type also matters. A traveling valve leak that is barely detectable in the card shape and stable across weeks calls for a different response than the same leak type showing a steep week-over-week trend toward total failure. Classification that only labels the fault category without tracking how it is trending over time misses half of the diagnostic value, since the trend line is often what determines whether the right response is watchful monitoring or an immediate technician dispatch.
Surface Card vs Downhole Card: Why Both Matter
The card captured at surface is not identical to what is happening at the pump itself, especially in deeper or highly deviated wells where rod stretch and friction distort the signal on its way up. A surface-to-downhole transformation, typically based on the wave equation, reconstructs the actual downhole card shape from the surface measurement, and that reconstructed card is often where a fault pattern becomes unambiguous.
| Aspect | Surface Card | Downhole Card |
|---|---|---|
| Measured Directly | Yes, from the polished rod load cell | No, calculated via wave-equation transformation |
| Distortion From Rod Stretch | Present, more pronounced in deep or deviated wells | Removed, isolating actual pump behavior |
| Best For | Quick stroke-speed and load range checks | Confirming subtle valve leak or gas interference patterns |
Visual Review vs Continuous AI Classification
The difference between the two approaches is not accuracy on a single well someone actually chose to review, it is coverage across every well, every day, without depending on whoever happens to have time that shift.
| Factor | Manual Visual Review | Continuous AI Classification |
|---|---|---|
| Cards Actually Reviewed | A fraction, usually only on flagged wells | Every card, on every well, every stroke cycle |
| Consistency | Varies with individual experience | Same classification standard fleet-wide |
| Detection Timing | Usually after a production drop is noticed | As soon as the fault pattern first appears in the shape |
| Prioritization | Whichever well was checked, not necessarily the worst one | Ranked list of wells by fault severity and trend |
Find Out What Your Current Card Data Is Already Showing
Bring a sample of recent card data from your artificial lift fleet to the call. We will walk through how AI classification would score those cards and what it would have flagged first.
How AI Turns a Card Shape Into an Action
Classification alone does not fix a well, the value comes from what happens between the shape being recognized and the right response being taken.
None of these fault categories exist in complete isolation either. A well showing early gas interference is also a well where fluid pound can develop if stroke speed is not adjusted in response, and a valve leak left unaddressed accelerates wear on the opposing valve as it compensates for lost efficiency. Classifying the primary pattern is the starting point, but the more useful output is often the combination: which secondary pattern is likely to emerge next if the current one is left unaddressed, so the response can head off the following failure rather than just the one already visible.
Not Every Card Alert Needs the Same Response
Treating every flagged card the same way either buries the team in false urgency or lets a genuinely serious pattern sit in a queue behind minor ones. Severity tiering is what keeps the response proportional.
What Continuous Card Classification Actually Changes
Curious what your current card data would show once classified? Talk to our team and we will help you find out.
A Common Starting Point: The Fleet Nobody Ranks by Card Health
Most operators approaching this are not starting from zero, they already have card capture hardware on the majority of their rod pumps, they simply have never had that data reviewed as a ranked, fleet-wide picture. A typical starting point looks like this: a lease has one hundred or more rod-pumped wells, a handful get flagged for card review each week based on whichever production numbers looked off, and the rest sit unreviewed until something forces the question. Nobody can say with confidence which ten wells across the fleet are showing the earliest signs of a developing valve leak or gas interference problem, because that would require someone opening and interpreting every card individually.
The shift that actually changes outcomes starts with classifying every card across the full fleet rather than waiting for a production-based trigger. Once every well's card shape is scored and trended against its own history, a ranked list emerges showing exactly which wells have a pattern worth acting on this week, ordered by fault type and how quickly it appears to be progressing. That ranked list is what turns card data from a diagnostic tool used occasionally into a standing early-warning system the whole team works from every day.
Four Mistakes That Undercut Card-Based Diagnostics
Why Card-Based Diagnostics Pay for Themselves Quickly
It is tempting to treat card classification as a nice-to-have monitoring layer on top of production data that already gets tracked anyway, but the actual value case is more direct than that. A rod part left undetected does not just cost the workover to fix it, it costs every day of lost production between when the rod actually failed and when someone happened to notice the well had stopped producing. A valve leak caught early is a stroke-speed or timer adjustment; the same leak caught late is a pulled pump and a full rod string inspection. Framed that way, the cost of continuous classification is small relative to even a single deferred failure it catches early, and most fleets have far more than one such event sitting undetected at any given time.
Frequently Asked Questions
Get Every Card on Your Fleet Classified in Real Time
Bring a sample of your current dynamometer card data to the call. We will walk through how AI classification would score it today, and what it would have flagged first.