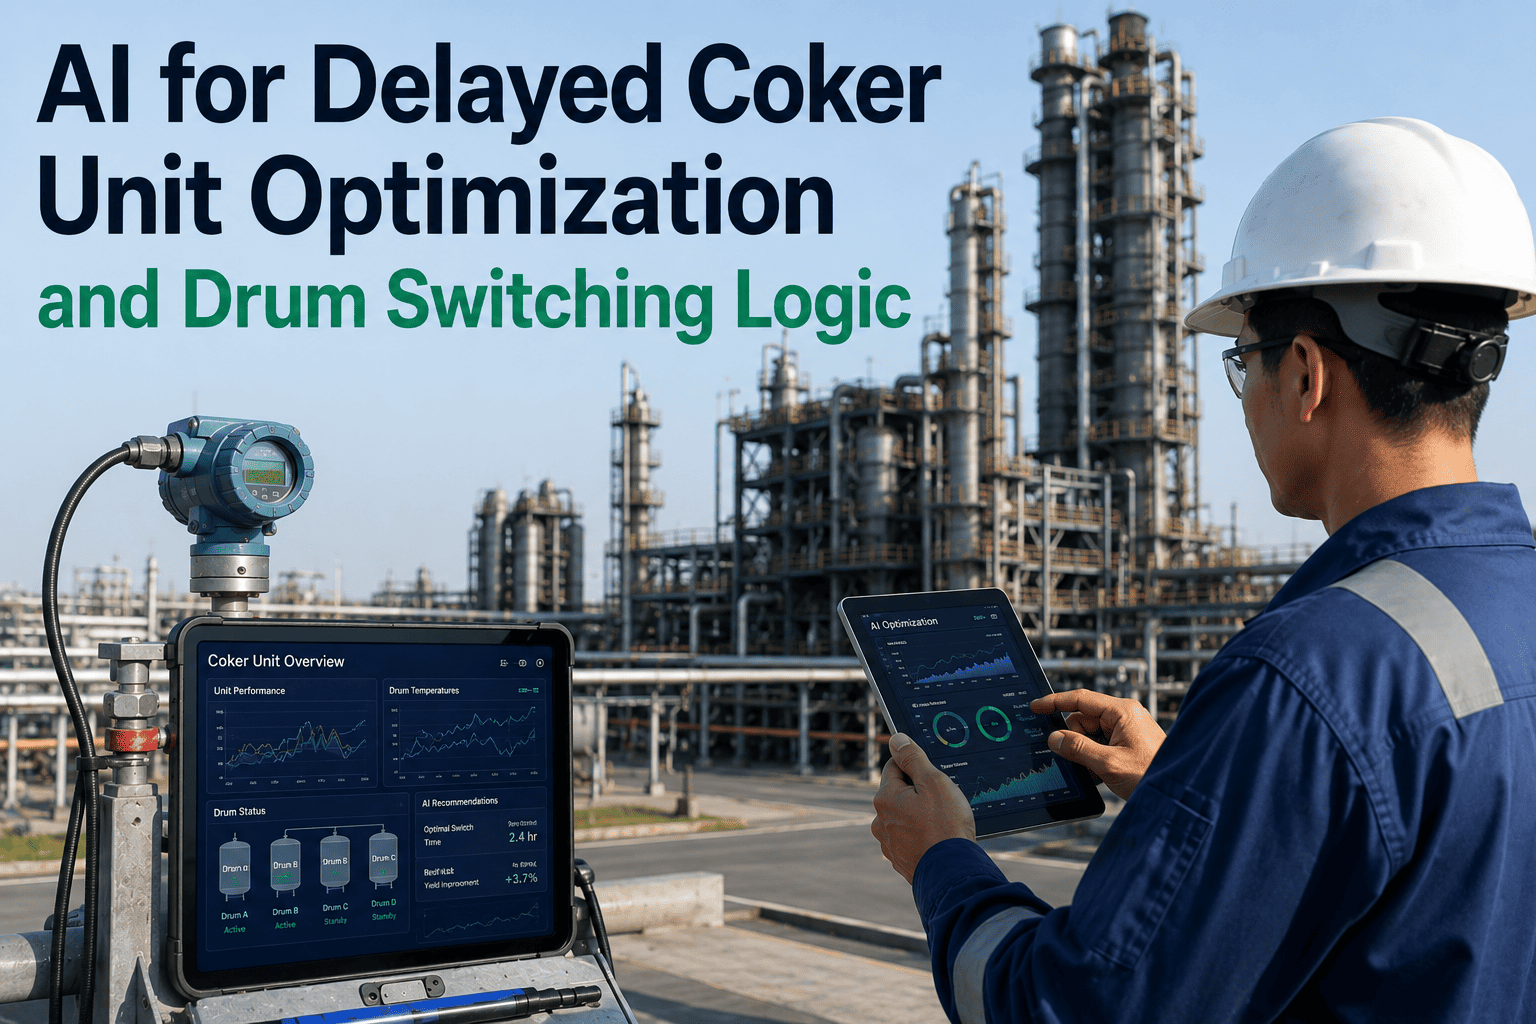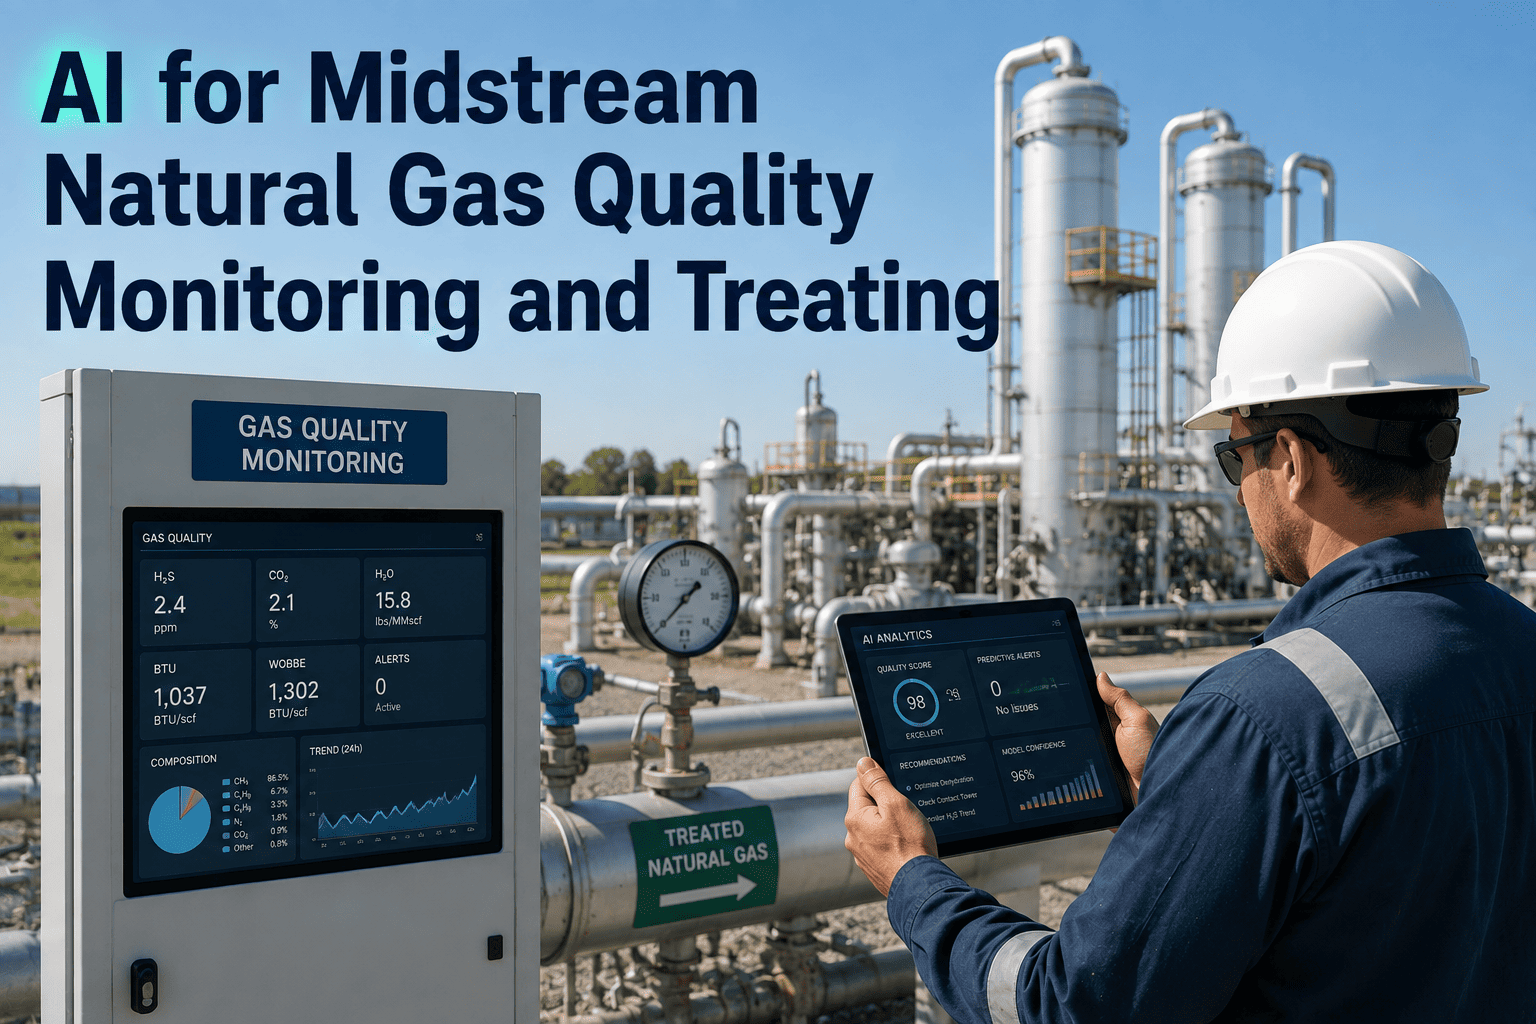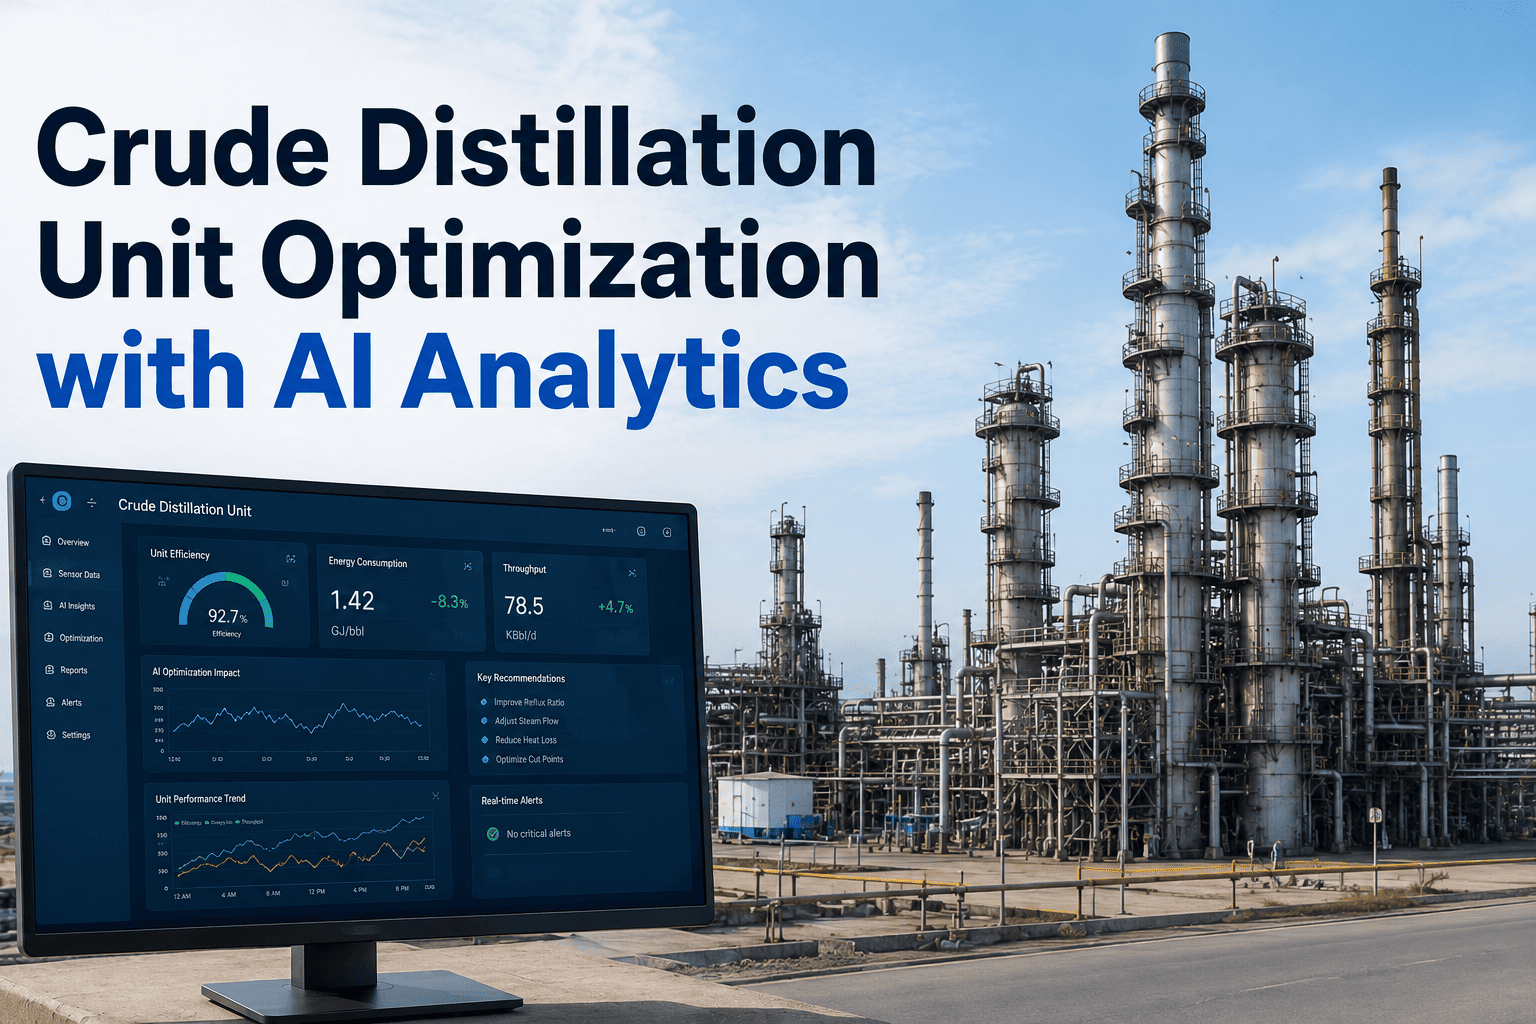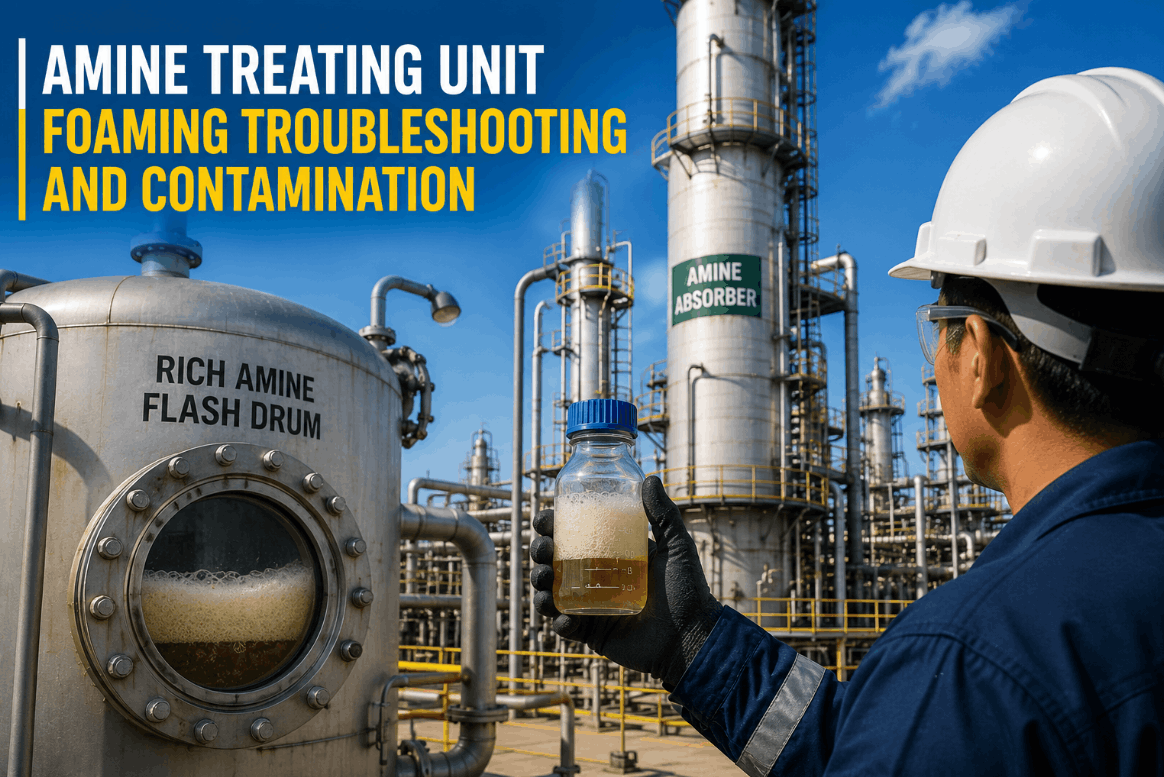
Amine treating unit foaming is not a nuisance event — it is a process integrity failure with a predictable escalation sequence that too many U.S. refineries and gas plants manage reactively, one antifoam shot at a time. The foaming mechanism is well understood: contaminants in the recirculating amine solution — liquid hydrocarbons from inadequate inlet separation, iron sulfide particulates from corrosion, heat-stable amine salts accumulating from degradation reactions, surfactants introduced through well-treating chemicals or corrosion inhibitors in the feed — reduce surface tension and stabilize foam that the absorber column was never designed to carry. When foam forms, the absorber differential pressure climbs, lean amine carryover to the treated gas increases, H₂S slip begins its march toward spec breach, and the acid gas stream delivered to the sulfur recovery unit carries entrained amine and hydrocarbons that create their own set of downstream upsets. The classical response — inject antifoam, watch dP drop, log the event, move on — addresses the symptom without touching the causative agent. The surfactant concentration in the circulating solution remains unchanged. The next foaming episode is not a question of if; it is a question of when. iFactory's amine unit analytics platform changes that response entirely — continuously tracking the multivariate signature of foaming onset across absorber dP, temperature profile shifts, downstream knockout drum levels, and amine solution quality indicators to detect the contamination buildup that drives foaming before it becomes a column upset.
Stop Managing Amine Foaming with Antifoam Shots. Detect the Contamination Source Before the Column Upsets.
iFactory AI monitors absorber differential pressure trends, HSAS accumulation, particulate loading, temperature profile shifts, and downstream carryover indicators — delivering foaming onset alerts before treated gas H₂S begins its climb toward spec breach.
The Four Contamination Pathways That Drive Amine Foaming in U.S. Gas Processing
Post-incident investigations at U.S. refinery and gas plant amine units consistently identify the same contamination sources in different combinations — and the most operationally damaging foaming events are almost always compound: two or more contamination pathways active simultaneously, each individually manageable, together producing foam stability that antifoam cannot suppress. iFactory's amine analytics framework addresses all four primary contamination pathways with dedicated monitoring logic, accumulation rate tracking, and source-specific alert thresholds calibrated to each unit's baseline amine quality parameters. Process engineers who Book a Demo consistently identify contamination accumulation trends in their own historian data that were never visible at the shift-level review.
Liquid Hydrocarbon Ingress
The most common foaming root cause across documented U.S. incidents. Liquid hydrocarbons entering through inadequate inlet separation coat absorber packing and trays, reducing interfacial surface tension and generating stable foam structures. iFactory monitors feed gas KO drum levels, inlet separator differential, and absorber bottom temperature profile to detect hydrocarbon carryover before the absorber column reaches foaming threshold.
Heat-Stable Amine Salts (HSAS)
HSAS form when strong acids — formic, acetic, oxalic, thiocyanic — react irreversibly with the amine molecule, removing it from active service and increasing solution viscosity. Elevated HSAS concentration increases solution surface-active behavior and directly promotes foam stability. iFactory tracks HSAS accumulation rate between reclaimer cycles and alerts when solution loading approaches the 1–2 wt% threshold where foaming risk materially increases for MDEA and DEA systems.
Iron Sulfide and Fine Particulates
Corrosion products — primarily iron sulfide — accumulate in the circulating amine solution and physically stabilize foam by retarding liquid drainage from the foam film structure. Particulate concentrations above 200–400 ppm by weight are a documented foaming trigger. iFactory integrates mechanical filter pressure differential trending and particulate lab results into a solution cleanliness index that alerts maintenance when filter replacement is required before particulate loading reaches the foaming threshold.
Water-Soluble Surfactants
Corrosion inhibitors, well-treating chemicals, H₂S scavengers (particularly glyoxal-based formulations used upstream), and production chemicals dissolve in the amine solution and reduce surface tension directly. These surfactants do not degrade under normal operating conditions — once introduced, they remain in the circulating solution until removed by reclaiming. iFactory correlates foaming onset events with upstream chemical injection records and feed composition changes to identify surfactant ingress episodes at their source.
The Foaming Onset Sequence: What the Data Shows Before the Column Upsets
Foaming events in amine absorbers do not arrive without warning — they arrive with a predictable multi-signal sequence that begins well before differential pressure reaches the value that triggers an operator response. Understanding this sequence is the foundation of early detection. Most refinery amine units rely on a single univariate dP alarm as their foaming indicator — a threshold-based approach that, by design, fires only after foaming is already established in the column. The five-stage onset sequence below is visible in the process historian of virtually every unit that has experienced a documented foaming event; iFactory's multivariate monitoring platform tracks all five indicators simultaneously and escalates when the compound pattern indicates foam formation in progress.
Absorber Level Control Valve Begins Closing to Maintain Setpoint
The first observable signal in documented foaming cases — a slight closure of the absorber level control valve as foam begins to displace liquid volume in the column sump. This precedes dP rise by 10–20 minutes in typical foaming events and is almost always misclassified as a level control transient without a multivariate context layer.
Flash Drum Pressure Increase and Rich Amine Flow Irregularity
As foam carries gas through the absorber bottom, the flash drum sees increased vapor loading and pressure rise. Rich amine flow rate becomes erratic as the foam-liquid interface in the absorber bottom disrupts normal withdrawal. iFactory monitors flash drum pressure trend rate and rich amine flow deviation from the expected rate-to-level correlation.
Treated Gas CO₂ Decline — Then H₂S Rise
A sharp decline in treated gas CO₂ concentration is the second major indicator in documented sequences — foam flooding disrupts mass transfer distribution and temporarily drives CO₂ removal higher before absorption capacity loss causes H₂S slip to begin rising toward the spec limit. The window between H₂S starting to rise and reaching the 4 ppmv action threshold is typically 10–15 minutes.
Absorber Differential Pressure Bounce and Escalation
The column dP begins fluctuating before settling into a sustained upward trend — the single signal most refinery units use as their foaming indicator, at a point in the event sequence where the foaming is already established across multiple trays or packed sections. iFactory detects the dP fluctuation pattern characteristic of early-stage foam formation, not just the high-dP threshold breach.
Amine Carryover to Downstream Knockout Drums
The final and most consequential signal — amine entrained in the treated gas or acid gas stream reaching downstream KO drums, scrubbers, or the SRU inlet. At this stage, the foaming event is severe and the risk of SRU feed contamination with hydrocarbons and amine is active. iFactory monitors downstream KO drum levels for abnormal accumulation rate as a carryover detection mechanism independent of the absorber column instrumentation.
How iFactory Monitors Amine Solution Quality and Foaming Risk Continuously
The fundamental limitation of reactive foaming management — antifoam injection triggered by high dP — is that it addresses the foam without touching the contamination that made the foam stable. The surfactant concentration in the circulating solution remains unchanged after every antifoam dose. The next episode is closer, not further away. iFactory's amine analytics platform replaces this cycle with a contamination tracking framework that monitors solution quality indicators between lab sample cycles, detects accumulation trends before they reach foaming thresholds, and connects contamination events to their upstream sources so the root cause can be addressed. Book a Demo to see the foaming onset detection dashboard on live amine unit historian data.
| Monitoring Parameter | Traditional Approach | iFactory AI Approach | Foaming Prevention Benefit |
|---|---|---|---|
| Absorber Differential Pressure | Single high-dP alarm; fires when foaming is established | dP fluctuation pattern detection; identifies foaming onset 10–30 min earlier than threshold alarm | Antifoam dosed at onset, not after column is flooding |
| HSAS Accumulation | Monthly or quarterly lab sample; no trend between samples | Accumulation rate model updated each lab cycle; alert when trajectory projects >1 wt% before next scheduled reclaimer | Reclaimer scheduled before foaming threshold reached |
| Particulate Loading | Filter change on fixed interval; no accumulation rate visibility | Filter dP trending combined with lab particulate results; replacement alert before 200 ppm threshold | Particulate-driven foam events eliminated by condition-triggered filtration |
| Absorber Temperature Profile | Reviewed on shift — profile shift not systematically tracked | Continuous profile shape monitoring; bulge temperature migration from lower to upper trays flagged automatically as foaming indicator | Early-stage foam formation identified before dP responds |
| Downstream KO Drum Levels | Checked on rounds; carryover confirmed after it has occurred | Abnormal accumulation rate detection in treated gas and acid gas KO drums; carryover alert before SRU feed is contaminated | SRU protected from hydrocarbon and amine carryover events |
| Feed Gas Inlet Separator Performance | Level alarms only; liquid hydrocarbon carryover not quantified | Inlet separator level pattern analysis and feed rate correlation to identify high-carryover-risk operating conditions | Hydrocarbon ingress — the most common foam root cause — detected at source |
Protecting the Sulfur Recovery Unit from Amine Unit Foaming Consequences
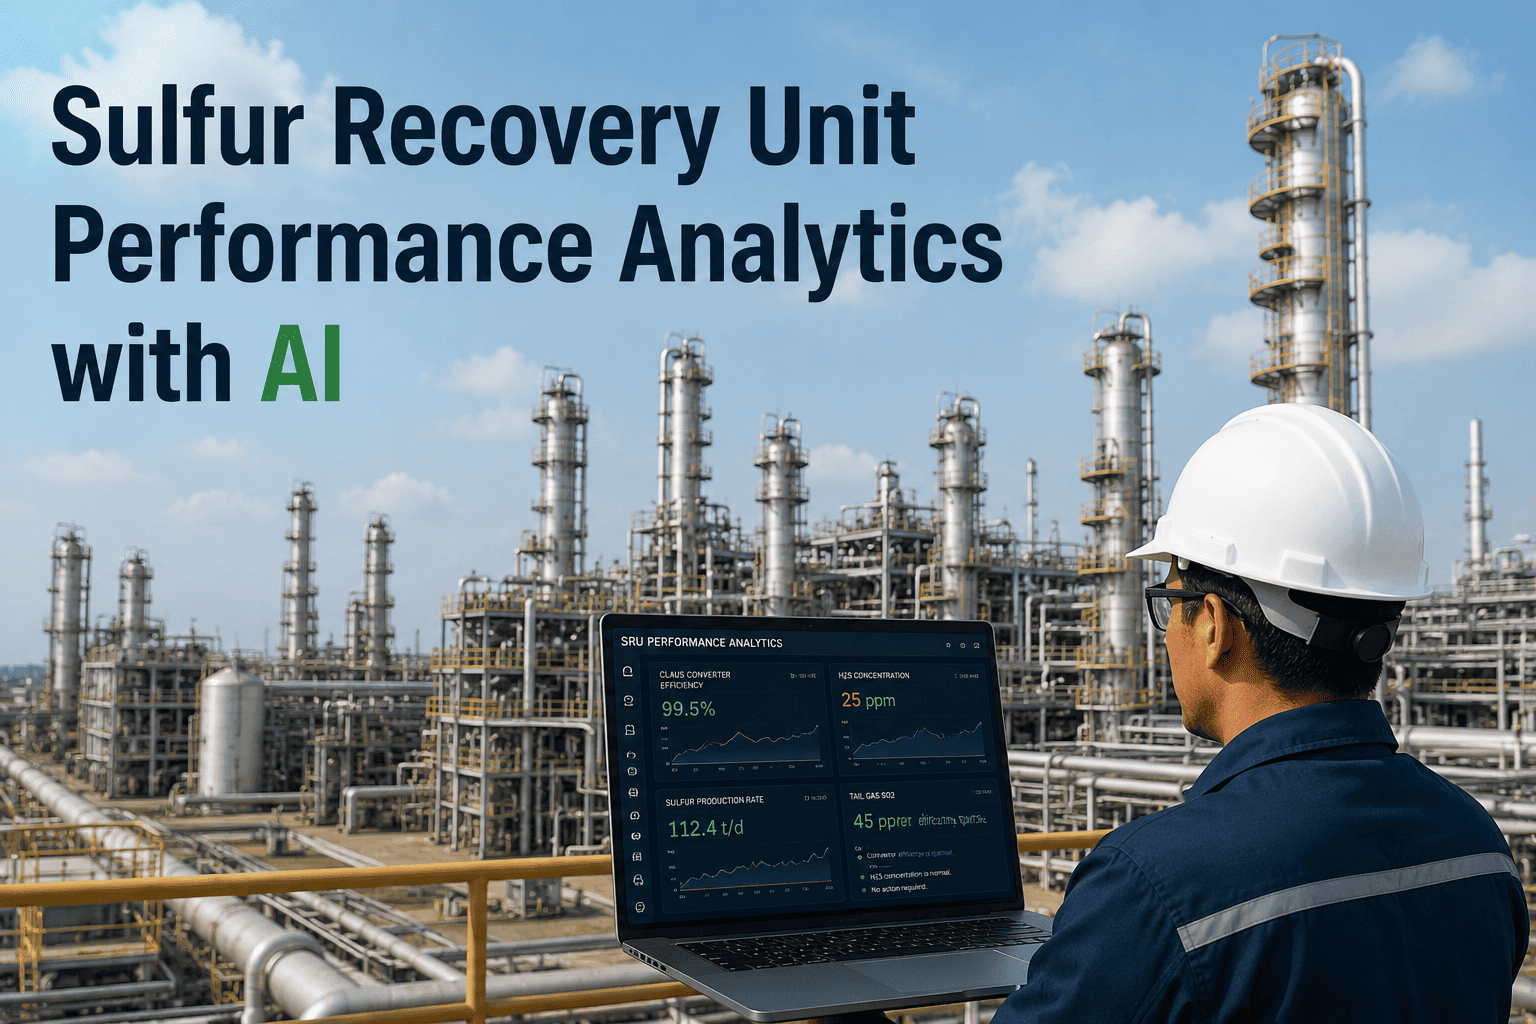
The downstream consequence of amine unit foaming that carries the highest operational and regulatory cost is not the H₂S spec breach in the treated gas — it is the acid gas stream contamination that reaches the sulfur recovery unit. Hydrocarbons entrained in the acid gas feed to the SRU react in the thermal section at temperatures that can produce soot, which physically blocks Claus catalyst active sites, increases catalyst bed pressure drop, and reduces sulfur conversion efficiency. Amine carried over in the acid gas introduces nitrogen compounds — particularly ammonia from MDEA systems with upstream ammonia disposal through the sulfur unit — that can deposit ammonium salts in cooler sections of the SRU, creating plugging, pressure drop, and localized corrosion. iFactory monitors the acid gas stream quality indicators that signal amine unit carryover before the SRU is impacted, and correlates SRU performance deviations — catalyst bed dP trending, sulfur conversion efficiency decline, thermal reactor temperature profile shifts — with upstream amine unit condition to identify the foaming event as the causal source. Book a Demo to see how the cross-unit correlation dashboard connects amine unit foaming events to SRU performance impact in real time.
Liquid hydrocarbons in acid gas feed combust incompletely in the thermal reactor, producing carbonaceous soot that deposits on and blocks active sites in the Claus catalyst beds — reducing sulfur conversion efficiency and increasing bed pressure drop toward shutdown limits.
Amine carryover in the acid gas introduces nitrogen and ammonia that can form ammonium polysulfide salts in cooler SRU sections — creating plugging, elevated pressure drop across condenser sections, and localized corrosion underneath deposits.
Sudden hydrocarbon slug delivery to the SRU acid gas burner — from a severe foaming carryover event — can drive thermal reactor temperatures above design limits, threatening refractory integrity and burner hardware life.
Reduced sulfur conversion efficiency from catalyst contamination directly affects tail gas SO₂ concentration — creating regulatory compliance exposure under Title V and state air permits that requires immediate corrective action and documentation.
Why Antifoam Management Is Not an Amine Foaming Strategy
In 22 years of amine unit troubleshooting across U.S. and Canadian refineries and gas plants, the pattern that repeats without exception is this: every facility that manages foaming primarily through antifoam injection eventually reaches a point where antifoam is becoming less effective, injection frequency is increasing, and nobody on the operations team can tell you what the current HSAS loading is or when the mechanical filters were last changed based on particulate results rather than a calendar. The reason antifoam appears to become less effective over time is not that the chemistry has changed — it is that the surfactant concentration in the circulating solution has increased to a level where the antifoam dosage rate is no longer sufficient to maintain equilibrium. The solution is foaming because of what is in it, not because of what has not been injected into it. Every foaming event that gets managed with antifoam without identifying and removing the causative contaminant makes the next episode more likely and more severe. The data required to identify the source is almost always available — inlet separator performance, absorber temperature profile shape, filter differential, amine lab results, upstream chemical injection records. What is missing in most facilities is a platform that integrates those data streams, applies the contamination physics of the specific amine system, and tells the process engineer what is building up and where it is coming from before the column is foaming. Once you have that analytical layer, the path to clearing a foaming problem is straightforward. Without it, you are always one antifoam shot behind.
Clearing Your Amine Unit Fast Requires Tracking What Is Building Up, Not Just What Is Happening Now
Amine treating unit foaming is a contamination management problem, not an antifoam management problem. The surfactants, particulates, HSAS, and hydrocarbon films that stabilize foam in the absorber column are detectable, trackable, and — with the right analytical framework — preventable from reaching foaming threshold. The multivariate onset sequence that precedes every documented foaming event is already encoded in the process historian: level control valve behavior, flash drum pressure, treated gas composition trends, absorber temperature profile shape, downstream KO drum accumulation rate. What is absent in most U.S. refinery and gas plant amine programs is the platform that integrates these signals, applies contamination-specific detection logic, and delivers actionable intelligence to the process engineer with enough lead time to intervene at the source rather than manage the consequence.
iFactory's amine unit analytics platform provides exactly that capability — continuous foaming onset detection, HSAS and particulate accumulation tracking, inlet separator performance monitoring, and SRU cross-unit impact correlation — deployed on your existing SCADA historian without requiring new instrumentation. The economic case is clear: a single prevented foaming event that avoids SRU catalyst contamination and a Title V compliance incident recovers the platform investment many times over. The operational case is equally clear: process engineers should be managing amine solution quality proactively, not responding to column upsets reactively.
Deploy iFactory Amine Analytics on Your Unit — Stop Managing Foaming and Start Preventing It
Continuous multivariate foaming onset detection, contamination accumulation tracking, and SRU protection analytics — connected to your existing historian in 6–8 weeks, without a DCS replacement.
Amine Unit Foaming and Contamination — Questions Answered
How does iFactory detect foaming onset earlier than a standard differential pressure alarm?
iFactory monitors five leading indicators simultaneously — absorber level valve behavior, flash drum pressure, treated gas composition trends, temperature profile shape, and downstream KO drum levels — and escalates when the compound pattern matches documented foaming onset sequences, typically 10–30 minutes before the column dP high alarm fires.
Can iFactory track HSAS accumulation between scheduled lab sample cycles?
Yes — iFactory builds an HSAS accumulation rate model from lab sample history and operational parameters (feed gas composition, oxygen ingress indicators, reboiler temperature) to project solution loading between lab cycles and alert when the trajectory is approaching the foaming risk threshold ahead of the next scheduled reclaimer run.
How does iFactory integrate with our SRU to detect amine carryover impact?
iFactory connects to both the amine unit and SRU historian streams, correlating downstream KO drum accumulation events with SRU thermal reactor temperature profiles and Claus catalyst bed dP trends to identify carryover impact at the SRU before it manifests as sulfur conversion efficiency loss or an emission compliance event.
Does the platform require new instrumentation on our amine unit?
For most units with existing SCADA historian coverage of absorber dP, temperature profile, and downstream KO drum levels, no new instrumentation is required — iFactory connects via OPC-UA or REST API to the existing historian and delivers foaming onset detection using the data already being collected.
How does iFactory identify whether hydrocarbon ingress or HSAS is the primary foaming driver?
iFactory's contamination source discrimination logic uses the foaming onset pattern — specifically, whether the temperature profile shift precedes or follows the dP event, and whether inlet separator performance correlates with the timing — to distinguish hydrocarbon carryover events from solution quality degradation events, directing the corrective action to the correct root cause.