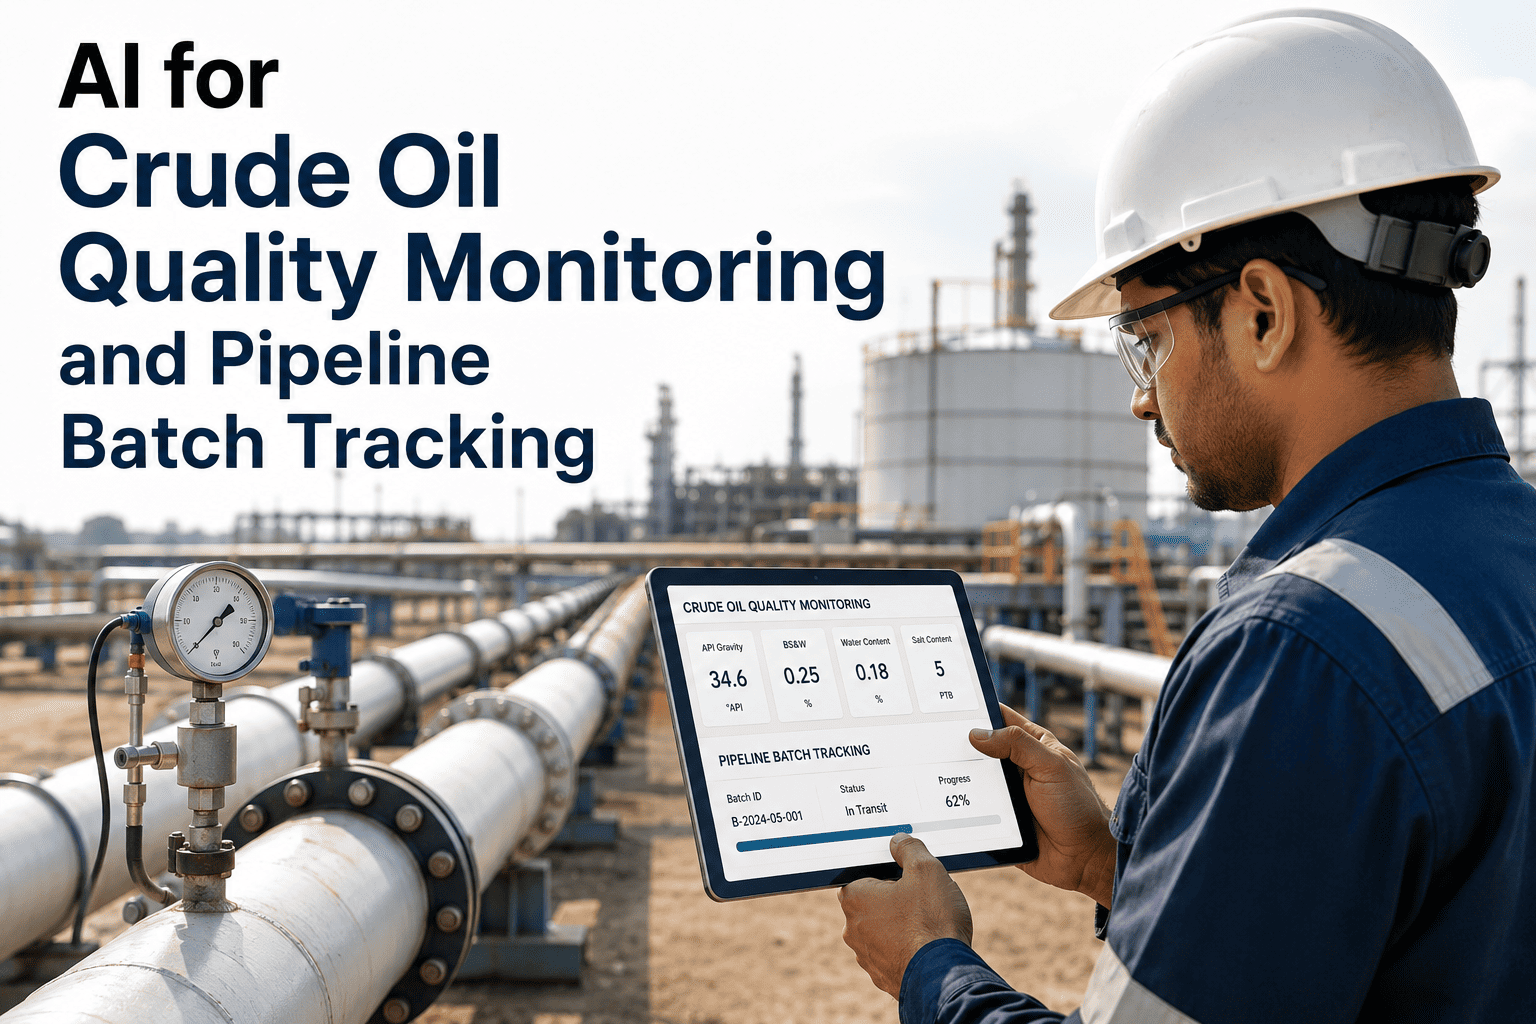
Every multi-product pipeline creates interfaces — the mixed-product zones that form at the boundary between consecutive batches of crude, distillates, gasoline, diesel, or jet fuel. Those interfaces are unavoidable physics. What is not inevitable is how much of them ends up as downgraded product, disputed delivery volume, or off-spec material requiring reprocessing. In U.S. petroleum pipeline operations, interface management is one of the few remaining areas where better data and faster decision-making directly translate into recovered revenue — without any capital investment in new pipe. A 100-mile products pipeline running 15 batches per month generates interface volumes in the range of 500 to 2,000 barrels per interface depending on flow regime, batch sequencing, and contamination threshold. At current distillate margins, that is a measurable line item. The operators managing it best are the ones with real-time density, color, and online analyzer data feeding interface detection algorithms that tell their console operators exactly when to switch tanks — not when the lab report comes back. Book a Demo to see how iFactory AI's pipeline analytics platform integrates real-time quality data with batch tracking and interface volume optimization.
500–2,000
Barrels of interface volume per batch transition on a 100-mile multi-product pipeline
3–5%
Typical downgrade loss as percentage of interface volume without real-time quality monitoring
±0.5 kg/m³
Online density meter precision enabling real-time interface detection at product specification limits
30–60%
Interface volume reduction achievable through optimized batch sequencing and flow velocity control
Managing batch interfaces across multiple pipeline segments and delivery terminals?
Book a Demo with iFactory AI's pipeline quality analytics team to see real-time interface tracking and downgrade volume optimization in action.
The Physics of Pipeline Interfaces: Why Mixing Happens and How Much It Costs
Interface formation in multi-product pipelines is governed by turbulent diffusion, axial dispersion, and the Reynolds number of the flowing stream. In fully turbulent flow — the normal operating regime for liquid petroleum products at typical pipeline velocities of 1–3 m/s — the interface grows proportionally to the square root of pipeline length. A 50-mile pipeline generates an interface roughly 1.4 times larger than a 25-mile segment under identical flow conditions. This has a direct implication for system design: long trunk lines with multiple delivery points accumulate interface volume as the batch travels, making early interface detection — at the upstream end of the system — more valuable than detection at the terminal.
The economic cost of interface mismanagement has three components. First, the direct downgrade cost: interface volume that cannot be allocated to either the leading or trailing batch specification is downgraded to a lower-value product, blended to specification, or returned for reprocessing — all of which erode the margin on the transition volume. Second, the commercial dispute cost: when interface volume is not tracked accurately against contractual specification tolerances, shippers and consignees dispute delivery quality and volume allocation, generating claims that consume commercial and operations staff time. Third, the terminal tank management cost: interface material received into the wrong tank contaminates a full tank of on-specification product, converting a 1,000-barrel interface problem into a 50,000-barrel quality incident.
DIRECT COST
Downgrade Loss
Interface volume allocated to lower-specification product at reduced margin. For gasoline-to-distillate interfaces, downgrade to fuel oil represents 15–25% margin loss on the contaminated volume.
COMMERCIAL COST
Delivery Disputes
Volume and quality disputes with shippers when interface allocation is based on estimated rather than measured contamination levels. Disputed deliveries generate claims averaging $15,000–$45,000 per incident to resolve.
OPERATIONAL COST
Tank Contamination
Interface material received into the wrong storage tank contaminates full tank inventories, requiring reprocessing or downgrade of 30,000–100,000 barrels of on-specification product at significant margin cost.
THROUGHPUT COST
Reprocessing Delay
Interface material requiring reprocessing occupies tankage, delays next batch receipt, and reduces effective pipeline throughput capacity — a hidden capacity cost that compounds across high-frequency batch schedules.
Interface Detection Technology: Density, Color, and Online Analyzers
Accurate real-time interface detection requires at least one continuous quality measurement at the pipeline delivery point, with the measurement update rate matched to the pipeline flow velocity and the desired interface volume resolution. Three primary measurement technologies are deployed in U.S. products pipeline operations, each with distinct performance characteristics and installation requirements.
| Technology |
Measured Parameter |
Detection Sensitivity |
Products |
Best Application |
| Coriolis / Vibrating Tube Density |
Mass density (kg/m³) |
±0.1–0.5 kg/m³; response time <1 sec |
Gasoline, diesel, jet, naphtha, crude |
Primary interface cut decision for density-differentiated product pairs (gasoline/diesel, diesel/jet) |
| Online Colorimeter |
Optical transmittance / color value |
Detects dye contamination at ppm concentrations |
Gasoline, diesel, heating oil with tracer dyes |
Regulated product differentiation (tax-dyed diesel); batch validation independent of density |
| NIR / NMR Online Analyzer |
Compositional properties (cetane, RON, flash point) |
Property-level detection; update rate 30–120 sec |
Gasoline blends, distillates, jet fuel |
Specification validation beyond density — flash point, freeze point, and octane tracking at terminal |
| Viscosity (Coriolis / Inline) |
Dynamic viscosity (cP) |
Differentiates similar-density products by rheology |
Crude blends, fuel oil, heavy distillates |
Crude-to-crude or heavy product interface detection where density differences are <2 kg/m³ |
| Pipeline Simulation Tracking |
Calculated interface position via hydraulic model |
Position uncertainty ±0.5–2% of pipeline length |
All liquid products |
Interface arrival time prediction; advance warning for tank switching and operator preparation |
The most reliable interface management programs combine at least two measurement approaches — typically density plus pipeline simulation tracking — so the real-time meter provides the cut decision while the simulation model provides advance warning of interface arrival. Book a Demo of iFactory AI's pipeline quality analytics platform to see how density, colorimetry, and hydraulic model outputs are integrated into a single interface tracking dashboard with automated tank switching recommendations.
Batch Sequencing Strategy: How to Minimize Interface Volume Before It Forms
The most effective interface management technique is not better detection — it is better batch sequencing that minimizes the contamination generated by each transition. The compatibility matrix of product pairs determines which sequences produce the smallest and most manageable interfaces. Experienced U.S. pipeline schedulers apply a set of rules that reduce interface volume and simplify disposition without sacrificing throughput flexibility.
01
Sequence by Density Proximity
Batch products in order of increasing or decreasing density to minimize the density differential at each interface. Gasoline (720–750 kg/m³) → jet fuel (775–840 kg/m³) → diesel (820–870 kg/m³) produces smaller, more easily detectable interfaces than alternating high- and low-density products across consecutive batches.
02
Match Batch Size to Interface Growth Rate
Interface volume grows with pipeline length regardless of batch size, but the contamination as a fraction of total batch volume decreases as batch size increases. Minimum economic batch size for a given pipeline system is typically defined as the batch size at which interface downgrade cost equals the carrying cost of the additional batch volume — usually 5,000–30,000 barrels depending on pipeline diameter and length.
03
Use Compatible Product Buffers for Critical Interfaces
For incompatible product pairs — aviation fuel following diesel, or gasoline following crude — insert a small compatible buffer batch (a "transmix buffer" or degraded product from the previous cycle) between the two products to absorb the contamination zone. The buffer batch accepts the mixed interface volume on both sides and is reprocessed rather than the primary product batches.
04
Optimize Flow Velocity for Turbulent Diffusion Control
Maintaining flow velocity above the critical Reynolds number for turbulent flow (Re > 10,000) actually reduces interface growth rate compared to transitional or laminar flow by suppressing gravity segregation effects. Pipelining products at reduced velocity to cut energy costs can inadvertently increase interface volume — a tradeoff that should be quantified in the operating cost model.
05
Automate Interface Cut Decisions with Real-Time Quality Feedback
Manual tank switching based on operator judgment introduces 200–500 barrel errors compared to automated switching driven by real-time density or analyzer output. Automated interface cut systems tied to the online density meter reduce the interface volume received into primary product tanks by 40–60% and eliminate operator-to-operator variation in cut decisions across shifts.
Book a Demo to see iFactory AI's automated interface cut recommendation engine integrated with terminal control systems.
Integrate Real-Time Quality Data with Batch Tracking Across Your Pipeline System
iFactory AI connects online density meters, analyzers, pipeline simulation models, and terminal control systems into a single interface tracking dashboard — giving your console operators the right cut decision at the right moment, with every event documented for shipper invoicing and regulatory reporting.
Transmix Management and Interface Disposition: Converting a Cost into a Revenue Stream
The interface volume that cannot be allocated to either primary product batch — the transmix — is the residual cost of batch pipeline operations. How that transmix is handled determines whether interface management is a pure cost line or a partially recovered value stream. U.S. petroleum pipeline operators have three primary transmix disposition strategies, each with different economics and operational requirements.
A
In-Line Blending to Specification
Transmix volume blended back into a primary product at a ratio that keeps the blend within specification. Requires accurate transmix composition data (from the online analyzer), a receiving batch large enough to absorb the dilution, and a blending calculation that accounts for each product's specification limits. This approach recovers the full product margin on the transmix volume but requires real-time composition data that many operators currently lack.
B
Transmix Tank and Third-Party Processing
Transmix collected into a dedicated tank and sold to a third-party transmix processor who fractionates it into specification products. This approach converts a cost into a revenue stream at a discount to component product value — typically 30–50% of the weighted average product value depending on composition. The economics favor this approach for operators with high interface volumes but limited blending capability at their terminals.
C
Refinery Return for Reprocessing
Transmix returned to a connected refinery for reprocessing into specification products. This option recovers the highest product value but requires pipeline connectivity to a refinery, scheduling coordination for the return batch, and acceptance of the transmix composition by the refinery operations team. For operators with direct refinery connections, this is typically the highest-value transmix disposition, recovering 70–85% of primary product value.
D
Downgrade to Lower-Specification Product
Transmix between diesel and fuel oil, or between specification gasoline and a lower-octane application, can be downgraded to the lower product specification if composition allows. This is the lowest-recovery option but requires no additional infrastructure, making it the default fallback when blending or processing options are unavailable. Accurate composition data reduces the volume unnecessarily downgraded by allowing more precise specification limit evaluation.
Expert Perspective: What Separates Best-in-Class Interface Management from Average
"The gap between average and best-in-class interface management is almost entirely a data latency problem. Average operators are making tank switching decisions on 2-hour lab turnaround times or on the pipeline simulation model alone. Best-in-class operators have a Coriolis density meter reading every second at the delivery point, a colorimeter confirming dye content in real time, and a hydraulic model that predicted the interface arrival 45 minutes ago so the terminal crew was already staged. The transmix volume from the best-in-class approach is 30–50% lower than the average, not because the pipeline is shorter or the products are more compatible, but because the cut decision is more precise. That precision is worth $1–4 million per year on a major products pipeline, and it does not require any new infrastructure — just better data integration between the analyzer skid and the terminal control system."
— Pipeline Operations and Quality Management Consultant, 21 Years — API 1110 and ASTM D4177 Specialist, Gulf Coast and Midcontinent Products Systems
40–60%
Interface volume reduction from automated vs. manual tank cut decisions
$1–4M
Annual downgrade loss recovery on a major products pipeline with real-time quality integration
API 1110
ANSI/API standard governing pressure testing and batch tracking documentation for liquid pipelines
Conclusion: Interface Management Is a Data Integration Problem
Batch interface losses in multi-product pipelines are a physics problem with a data solution. The contamination zone that forms at every product transition is governed by flow regime and pipeline geometry — neither of which operators can change. What operators can change is the precision of the cut decision at the delivery terminal, the accuracy of interface arrival prediction from the hydraulic model, and the speed at which transmix composition data is available for disposition decisions. The U.S. pipeline operators who have closed that data loop — integrating real-time density and analyzer outputs with pipeline simulation tracking and terminal control systems — consistently report 30–60% reductions in interface downgrade volumes and the elimination of the shipper disputes that arise from estimated rather than measured contamination levels. For operators still relying on lab turnaround and simulation models alone, the upgrade path is a software and instrumentation integration project, not a pipeline rebuild. iFactory AI's platform is built to close exactly that gap — connecting the quality data that already exists at most terminals with the batch tracking, interface cut logic, and commercial reporting that turns measurement into margin recovery.
Reduce Interface Downgrade Losses with Real-Time Pipeline Quality Analytics
iFactory AI integrates online density meters, colorimeters, NIR analyzers, and pipeline simulation models into a unified interface tracking platform — delivering automated cut recommendations, shipper-ready batch documentation, and transmix volume reporting across your entire pipeline system.
Real-Time Interface Detection
Automated Cut Recommendations
Transmix Volume Tracking
Shipper Dispute Documentation
Hydraulic Model Integration
Frequently Asked Questions
Interface volume between gasoline and diesel typically ranges from 500 to 2,000 barrels on a 100-mile pipeline segment, growing proportionally with the square root of pipeline length. Batch size, flow velocity, and pipe diameter all influence the final mixed volume at the delivery terminal.
Pipeline simulation predicts interface arrival time but cannot account for real composition variability within the batch. Real-time density measurement at the delivery point provides the actual contamination level at each moment, allowing the cut decision to be made at the precise specification limit rather than a conservative safety margin that inflates transmix volume.
Transmix is the mixed-product interface volume that cannot be allocated to either the leading or trailing batch specification. U.S. operators dispose of it through in-line blending to specification, sale to third-party transmix processors at a discount, refinery return for reprocessing, or downgrade to a lower-specification product — with economics favoring blending or refinery return where infrastructure allows.
Below the turbulent flow threshold (Re < 10,000), gravity segregation and laminar diffusion increase interface growth rate compared to fully turbulent flow. Reducing pipeline velocity to save energy can push the flow into the transitional regime, producing larger interfaces that offset the energy savings with higher downgrade losses.
iFactory AI integrates real-time density, colorimetry, and analyzer data with hydraulic model batch tracking to deliver automated interface cut recommendations, transmix volume logging, and shipper-ready quality documentation — replacing manual, lab-dependent cut decisions with continuous, data-driven interface management.