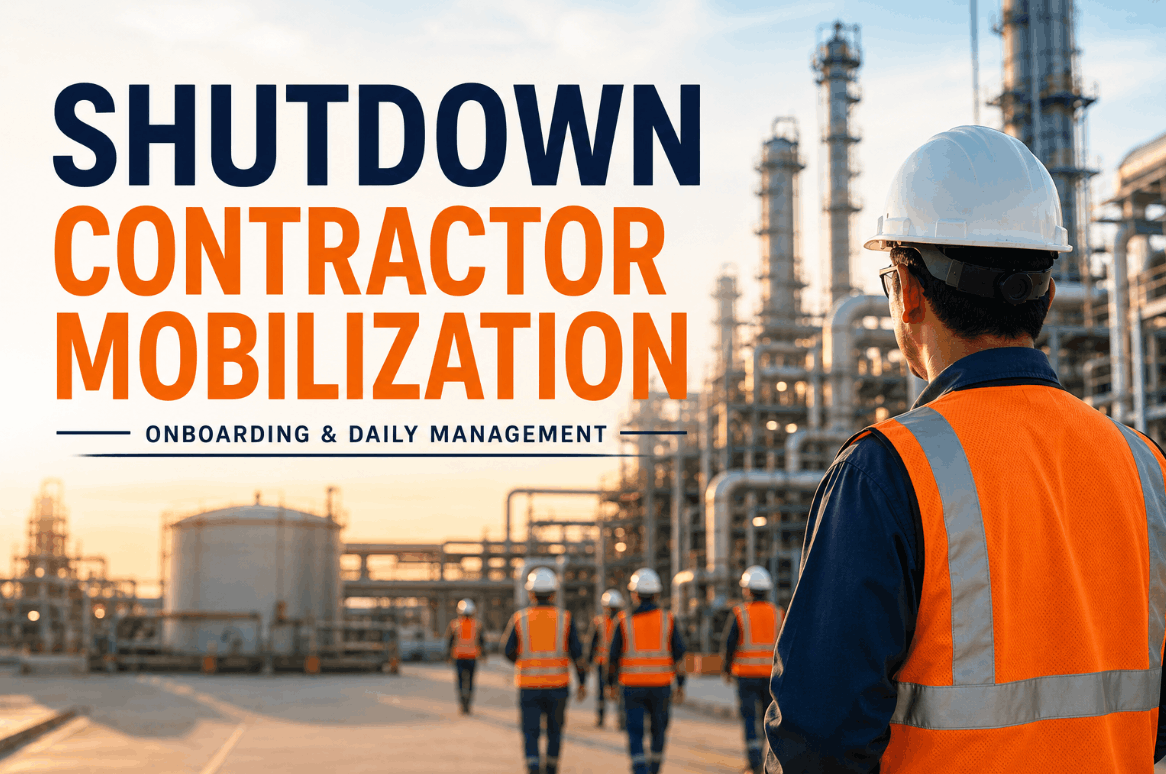
Every planned turnaround starts with a number on a spreadsheet — six hundred contractors, four weeks, one fixed completion date. What actually shows up on day one is a parking lot full of buses, a badge line stretching past the gate, and a workforce that planners can see arrive but cannot see work. Most facilities discover, usually around week two, that the crew they mobilized and the crew that is actually turning wrenches are two very different numbers. iFactory's AI Vision system closes that gap by tracking craft presence, zone activity, and idle time across the entire jobsite in real time, so turnaround leadership manages the workforce they actually have — Book a Demo to see it against your own site layout.
You Mobilized 600 Contractors. How Many Are Actually Working Right Now?
Badge scans confirm someone entered the site. They don't confirm anyone is at a work front, inside a permit boundary, or holding a tool. iFactory's cameras answer the question your headcount report can't.
Five Points Where Headcount Stops Meaning Productivity
Mobilization looks efficient on the org chart and falls apart on the ground. Orientation, badge verification, and craft assignment each introduce a gap between people arriving on site and people producing work, and that gap compounds every single shift of a compressed schedule.
Orientation Queues
New contractors unfamiliar with the site layout stack up at induction, and early-shift questions eat into the productive window before a single permit is issued.
Badge-to-Zone Mismatch
A badge scan at the gate confirms entry, not location. Crews assigned to Unit 3 can spend an hour walking, waiting, or standing at the wrong work front with nobody the wiser.
Headcount Reconciliation Gaps
Manual sign-in sheets and radio check-ins drift apart from actual site presence, so nightly reports understate or overstate who was truly on the tools.
Craft Misallocation
Welders wait on scaffold, scaffolders wait on permits, and permits wait on inspectors — a sequencing failure invisible until the schedule has already slipped.
Invisible Idle Time
Idle minutes never get logged anywhere, so the true cost of waiting for tools, materials, or access shows up only as an overrun at closeout.
See Your Own Jobsite's Idle Time, Quantified
iFactory turns camera footage you already have into a zone-by-zone productivity picture, updated through the shift instead of after it.
From Camera Feed to Craft Utilization Report
Detect
Cameras positioned across work fronts, laydown yards, and access points identify crew presence by zone, continuously and without contractor-side hardware.
Classify
Activity is classified against expected work patterns — active task, staged waiting, or unoccupied zone — building a real picture of time spent versus time logged.
Report
Turnaround leadership receives a daily utilization breakdown by contractor company, craft, and unit, ready for the morning coordination meeting.
Reallocate
Planners redirect idle craft toward ready work fronts same-shift instead of discovering the imbalance in a lagging end-of-week report.
Sign-In Sheets vs. Continuous AI Vision Tracking
| Tracking Metric | Manual Sign-In & Radio Checks | iFactory AI Vision |
|---|---|---|
| Crew Location Accuracy | Confirmed at gate only | Confirmed by zone, continuously |
| Idle Time Visibility | Rarely captured | Logged automatically by shift |
| Reporting Lag | End of shift or next day | Live, through the shift |
| Craft Reallocation Speed | Hours, via radio and walk-arounds | Minutes, from dashboard alerts |
| Contractor Hardware Needed | Badges, occasionally RFID | None beyond existing cameras |
Day 12 of a 28-Day Turnaround Looks Very Different Two Ways
Without Continuous Tracking
Reports show 580 badges scanned in that morning. Nobody can say how many crews were actually working versus waiting on scaffold access, so the schedule slip isn't visible until the weekly progress meeting flags it.
With iFactory AI Vision
The dashboard flags that Unit 3 mechanical crews have been idle for ninety minutes waiting on isolation sign-off. The planner reroutes two crews to a ready work front before lunch instead of losing the shift.
Built for Every Seat in the Turnaround Control Room
Turnaround Director
Gets a single view of craft utilization across every unit instead of piecing together radio reports from a dozen area coordinators.
Contractor Supervisor
Sees which of their own crews are productive and which are stalled, before the client's progress meeting raises the question first.
Cost Controller
Reconciles paid labor hours against verified working time, tightening the reconciliation that normally happens weeks after invoices are submitted.
Planning & Scheduling Lead
Feeds real utilization data back into the critical path model, replacing planning assumptions with what actually happened on the last shift.
We used to find out about craft imbalances three days after they started, once the weekly progress numbers came in. Now the coordinators see it on the same shift and move crews before it becomes a schedule problem. It changed how we run the morning meeting entirely.
Frequently Asked Questions
Q: Does this replace our badge access and time clock systems?
No. Badge and time systems remain the record of who was authorized on site and paid for a shift. iFactory's AI Vision adds the layer those systems cannot provide — verified physical presence and activity by zone, matched against the schedule so gaps between paid time and productive time surface immediately instead of at reconciliation. Most sites run both in parallel, with camera data supplementing the payroll record rather than replacing it. A Book a Demo session can show how the two data sets line up using your own site footage.
Q: How does the system distinguish idle waiting from legitimate downtime like a safety stand-down?
The classification model is configured against your turnaround schedule and known hold points, so a planned stand-down, shift change, or weather delay is tagged separately from unplanned idle time. This distinction matters because flagging every pause as inefficiency erodes trust with contractor crews and supervisors quickly stop checking the dashboard. Configuration is reviewed with your planning team before go-live to make sure the categories match how your site actually operates.
Q: Can this data be used against contractor companies in billing disputes?
It can be used that way, but most facilities find more value treating it as a shared planning tool rather than a punitive one. Contractors who see their own utilization data in real time tend to self-correct sequencing issues before a supervisor has to intervene. Facilities that want the data formatted for contract compliance or billing reconciliation can discuss reporting templates through Support Contact.
Q: How quickly can this be deployed for a turnaround that's already scheduled?
Deployment timing depends on existing camera coverage across your jobsite and laydown areas. Sites with cameras already in place for security or safety monitoring can typically have zone tracking configured within the pre-turnaround mobilization window. Sites needing additional camera placement should plan for that lead time separately, which is why an early site assessment is recommended well before the outage window opens.
Q: Does the system work across a large overland site with dozens of separate work fronts?
Yes, camera coverage scales to the number of active work fronts on your turnaround scope, and the dashboard aggregates activity across every zone into a single site-wide utilization view. Large multi-unit turnarounds typically prioritize coverage at the work fronts, laydown yards, and access chokepoints where craft imbalance is most likely to occur and hardest to catch manually.
Stop Estimating Wrench Time. Start Measuring It.
Bring footage from your last turnaround and see what iFactory would have flagged, zone by zone, shift by shift.