A turnaround does not fail during the shutdown window. It fails eighteen months earlier when scope creep goes unchallenged, twelve months earlier when a long-lead spare part misses its order window, and six months earlier when the contractor mobilization curve gets built on optimism instead of a resourced schedule. By the time the plant is actually down, the outcome has already been decided by two years of small planning decisions that either protected the critical path or quietly eroded it. A structured 24-month timeline with defined milestones and gate reviews is what separates a turnaround that finishes on schedule from one that discovers its problems mid-execution, when every extra day of downtime carries a cost nobody budgeted for. Talk to our turnaround planning support team about building that timeline for your next TAR.
The 24-Month Runway Every On-Time Turnaround Actually Follows
Why the Timeline Matters More Than the Budget
Every turnaround has a budget and a schedule, and operations teams tend to defend the budget more aggressively because it is easier to measure. But the schedule is the more fragile asset. A turnaround budget can absorb a cost overrun and still close the books; a turnaround schedule that slips by even three days on a large unit can cost more in lost production than the entire maintenance budget for the event. The 24-month timeline exists because the schedule has no slack to give back once the unit is down — every day of extension is a day the facility is not producing, and that number scales into the millions for a large refinery or gas plant train.
The reason a long runway is required at all is that turnarounds compress years of deferred work, engineering changes, and inspection findings into a fixed window measured in weeks. That compression only works if the scope, resources, materials, and contractor labor are locked in well before the plant comes down. A twenty-four month timeline gives enough runway to secure long-lead equipment, negotiate contractor rates before the market tightens, and run the scope challenge process that keeps the worklist from ballooning past what the schedule can absorb.
It also gives the organization enough time to make good decisions instead of forced ones. A capital project team asked to specify a replacement heat exchanger bundle in month six is making that decision under schedule pressure, with limited time to evaluate alternate metallurgy or a design upgrade that could extend run length past the next turnaround cycle. The same decision made in month eighteen, with the full procurement lead time still available, can be evaluated properly against reliability data and total cost of ownership rather than simply against what can be delivered in time. The runway is not just a buffer against delay — it is what preserves the option to make the turnaround an improvement event rather than a like-for-like replacement exercise.
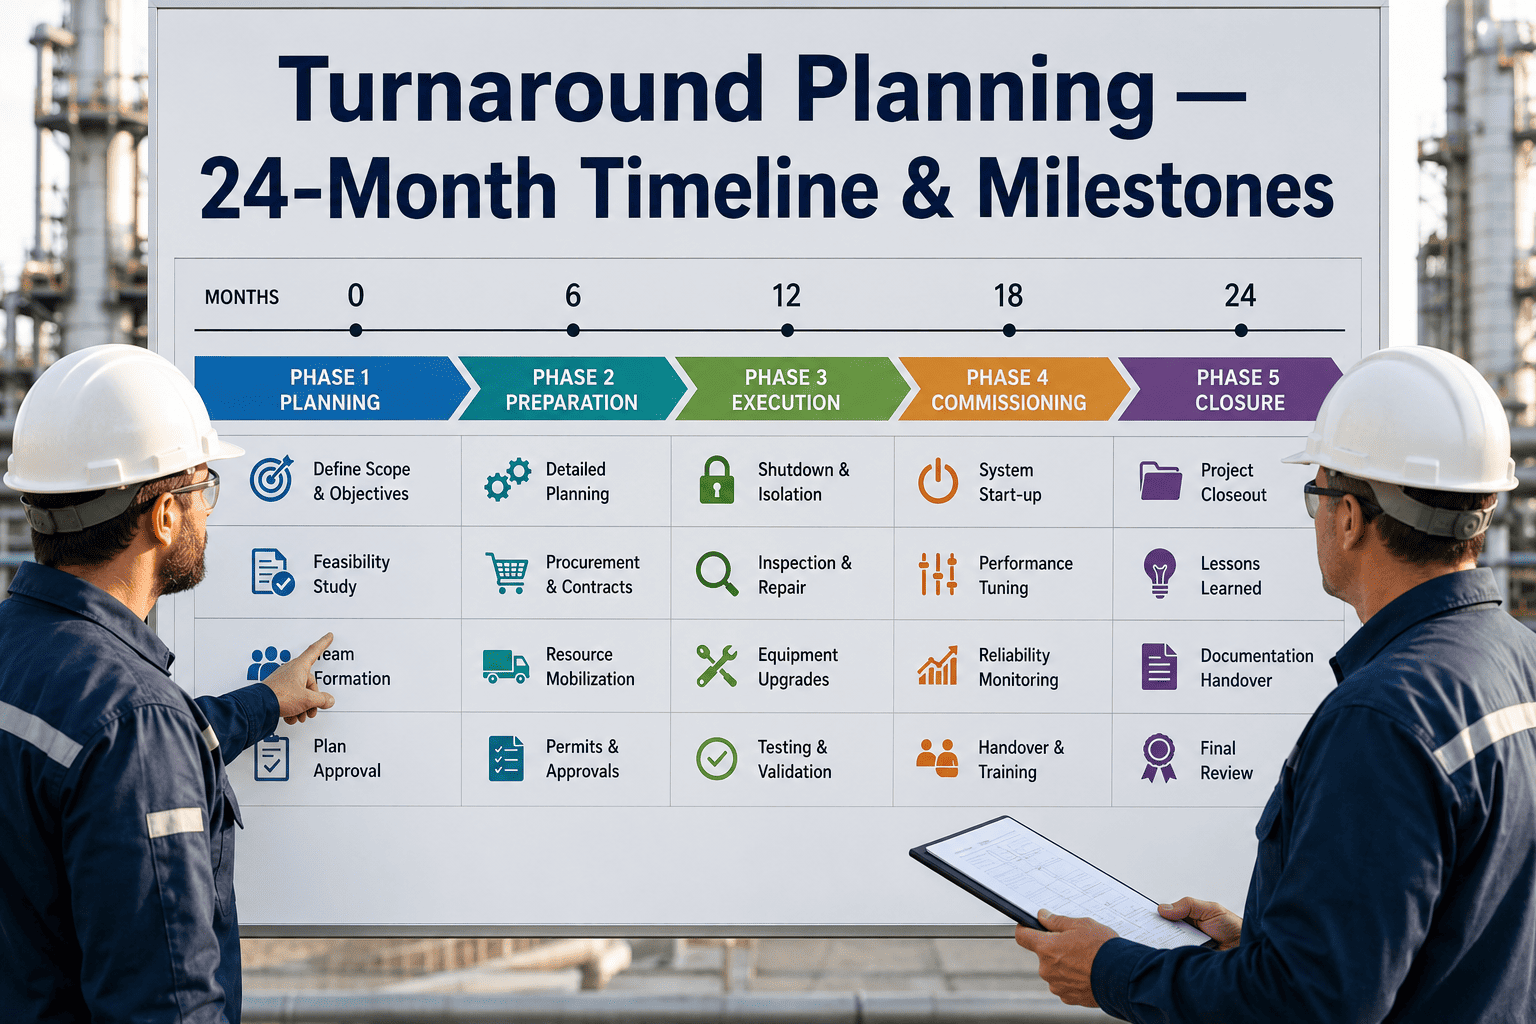
The 24-Month Timeline, Phase by Phase
The timeline below reflects how most mid-to-large refining, petrochemical, and gas processing turnarounds structure their planning cycle, adjusted for unit size and scope complexity. Smaller units can compress this to twelve to eighteen months; major integrated turnarounds with multiple units and heavy capital scope often extend it to thirty months. What stays constant across all of them is the sequence — each phase has to close before the next one can start without introducing risk into the schedule.
Six Gate Reviews That Keep the Schedule Honest
A timeline without checkpoints is just a wish. Gate reviews are the mechanism that forces a formal go/no-go decision at each major milestone, with leadership sign-off required before the project is allowed to proceed to the next phase. Turnarounds that skip or soften these gates are the ones that discover in month twenty that scope is still 40% undefined, or discover during execution week that the materials list was never fully reconciled against the actual worklist.
Resource and Contractor Mobilization Curve
One of the most common timeline failures has nothing to do with scope or materials — it is a mobilization curve that was never actually planned, just assumed. Contractor headcount does not ramp instantly on the first day of the shutdown; it builds through a mobilization sequence, peaks during the heaviest work-front days, and steps back down as work fronts close out. A schedule that assumes full crew availability from day one of the turnaround is a schedule that has already built in slippage risk without anyone deciding to accept it.
Planning the mobilization curve properly means booking contractor commitments in tiers rather than as a single lump order — a core crew locked early, a peak-week surge crew negotiated with defined start dates, and a close-out crew sized for punch-list and documentation work. Facilities that treat the whole workforce as one undifferentiated number typically overpay for idle labor in the early weeks and scramble for surge capacity during the peak, which is exactly the period when labor markets are tightest and rates are highest. Tracking the mobilization curve against actual headcount data during execution also gives the site leadership team an early warning signal — if the peak-week crew is arriving under-strength, that gap is visible in the numbers days before it shows up as a missed milestone on the critical path.
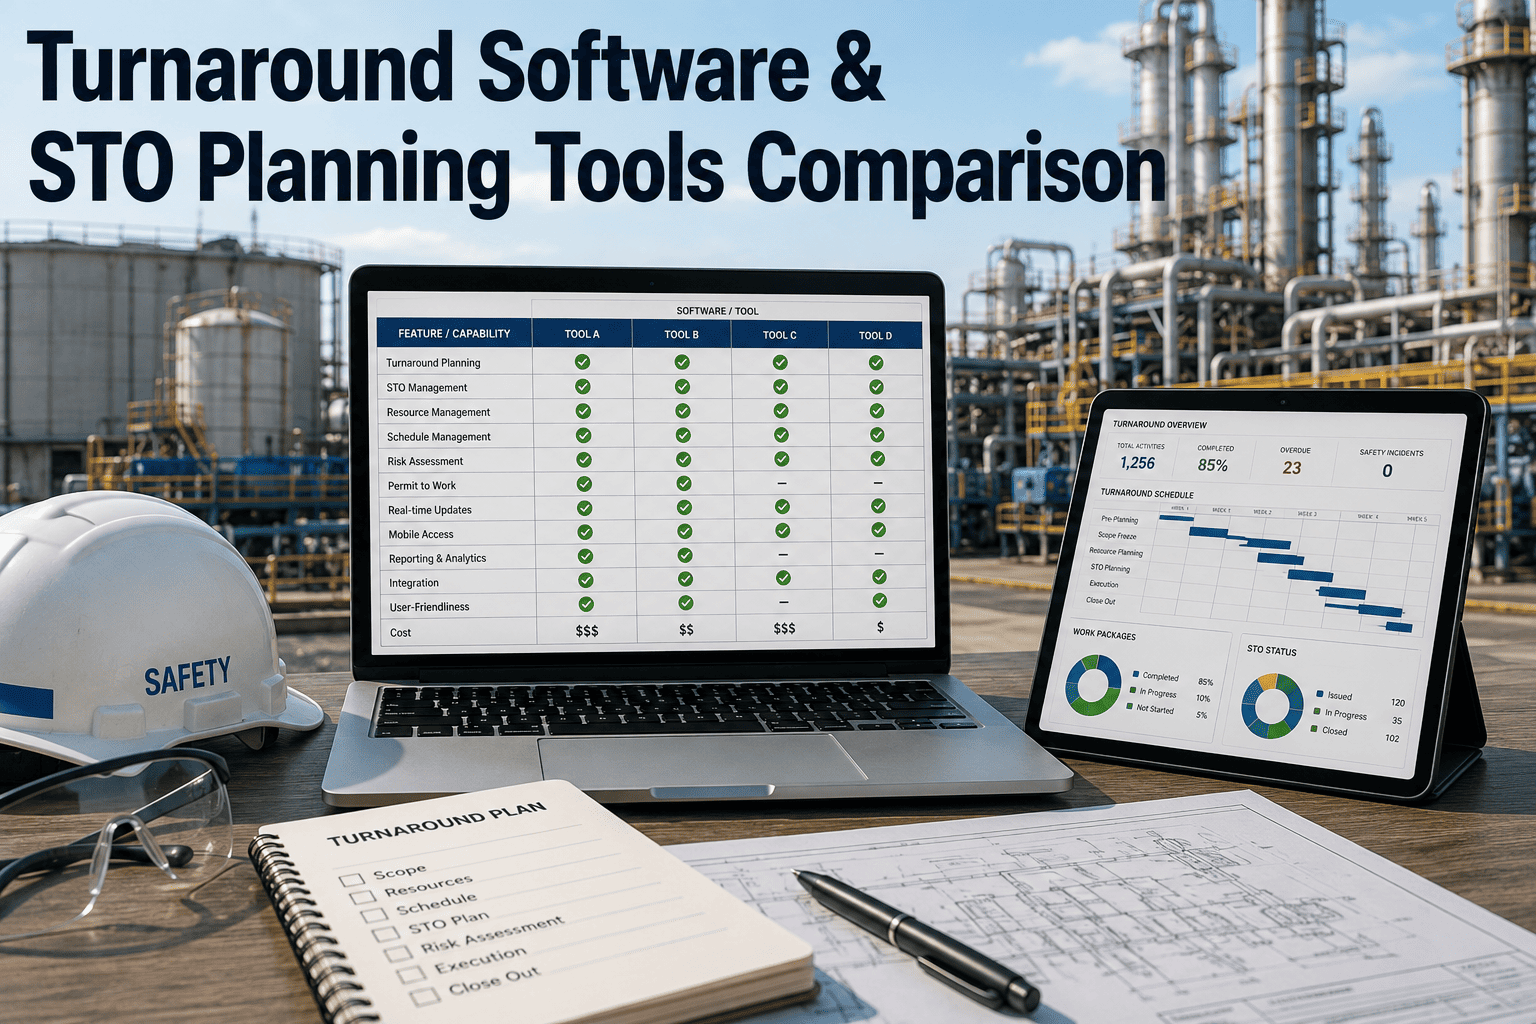
Turnaround Planning Software Comparison
The tool used to manage the timeline matters less than the discipline behind it, but the wrong tool makes that discipline much harder to sustain across a twenty-four month planning cycle involving dozens of contributors. The table below compares the three approaches most operations teams choose between when standing up their TAR planning process.
| Approach | Best Fit | Milestone Tracking | Key Limitation |
|---|---|---|---|
| Spreadsheet-based tracking | Small units, low scope count | Manual, prone to version conflicts | Breaks down past a few hundred worklist items |
| Primavera P6 / MS Project | Mid-to-large single-unit TARs | Strong critical path and resource leveling | Weak on live field data and gate-review evidence |
| AI-integrated planning platform | Multi-unit and integrated turnarounds | Automated milestone alerts tied to field data | Requires upfront integration with existing CMMS/EAM |
Common Timeline Slippage Points and How to Prevent Them
Most turnaround schedule slippage traces back to a small set of recurring failure points, and almost all of them are visible months before the shutdown window if someone is actually watching the milestone data rather than just the calendar date.
| Slippage Point | Typical Cause | Prevention |
|---|---|---|
| Scope creep after freeze | No formal scope challenge process or gate enforcement | Hard scope freeze gate with documented exception approval only |
| Long-lead equipment delay | Order placed after the 12-18 month lead-time window closed | Procurement trigger tied to the detailed planning gate, not a calendar reminder |
| Contractor availability gap | Labor market booked out by competing turnarounds in the region | Tiered contractor commitments locked at the schedule baseline gate |
| Materials reconciliation gap | Staged materials never verified against the actual work packages | Physical materials audit built into the readiness review gate |
| Emergent work overrun | No contingency reserve built into the critical path schedule | Dedicated emergent work float reserved and tracked separately from base scope |
What Changes When the Timeline Is Actually Tracked
Facilities that move from an informal, calendar-driven turnaround process to a structured 24-month timeline with enforced gate reviews consistently report the same pattern of improvement, even before any capital investment in new tools or systems. The discipline itself is what produces the result, and the tooling simply makes the discipline sustainable at scale across a large, multi-contributor planning effort.
Closing the Loop: Post-Turnaround Lessons Learned
The timeline does not actually end when the unit restarts. The final gate review, conducted roughly two weeks after startup, is where the planned schedule gets compared line by line against what actually happened, and this comparison is the single most underused source of improvement in most turnaround programs. Facilities that skip this step tend to repeat the same slippage points cycle after cycle, because the specific milestone that slipped last time was never formally captured anywhere beyond a few hallway conversations that fade before the next planning cycle begins.
A proper lessons-learned session pulls three data sets together: the baselined schedule from the schedule baseline gate, the actual milestone completion dates as they were tracked through execution, and the cost variance by work category. Comparing these side by side surfaces patterns that are invisible in isolation — a particular contractor consistently arriving a few days late to mobilize, a specific equipment category that always slips past its long-lead order window, or a work-front that has needed emergency contingency scope in three consecutive turnarounds. None of these patterns show up in a single event's post-mortem; they only become visible when the data is tracked consistently across cycles and fed forward into the opportunity gate of the next planning window.
The organizations that get the most value from this feedback loop treat it as an input to the next timeline rather than a filing exercise. Every milestone slip identified in the lessons-learned session becomes a specific line item in the next turnaround's risk register, with an owner and a mitigation plan attached before the opportunity gate closes. Over several turnaround cycles, this is what actually compounds into a shorter, more predictable planning process — not a new piece of software, but a timeline that gets measurably better informed by its own history each time it runs.