Refinery turnarounds rank among the most capital-intensive events in downstream operations — frequently running $200 million to $500 million in total cost exposure while determining a facility's annual profit margin. Yet industry benchmarking consistently shows that high-complexity shutdowns experience average cost overruns of 20% and schedule overruns of 30%, with scope creep after freeze dates as the primary driver. The Critical Path Method (CPM) is the scheduling backbone that separates facilities that execute on time and on budget from those that absorb losses that erase an entire year's margin. Book a Demo to see how iFactory's AI-driven analytics platform integrates with your TAR scheduling workflows to compress turnaround duration by 8–15%.
Turnarounds Cost $200M–$500M. CPM-Driven Planning Cuts Duration by 8–15% and Protects Every Dollar.
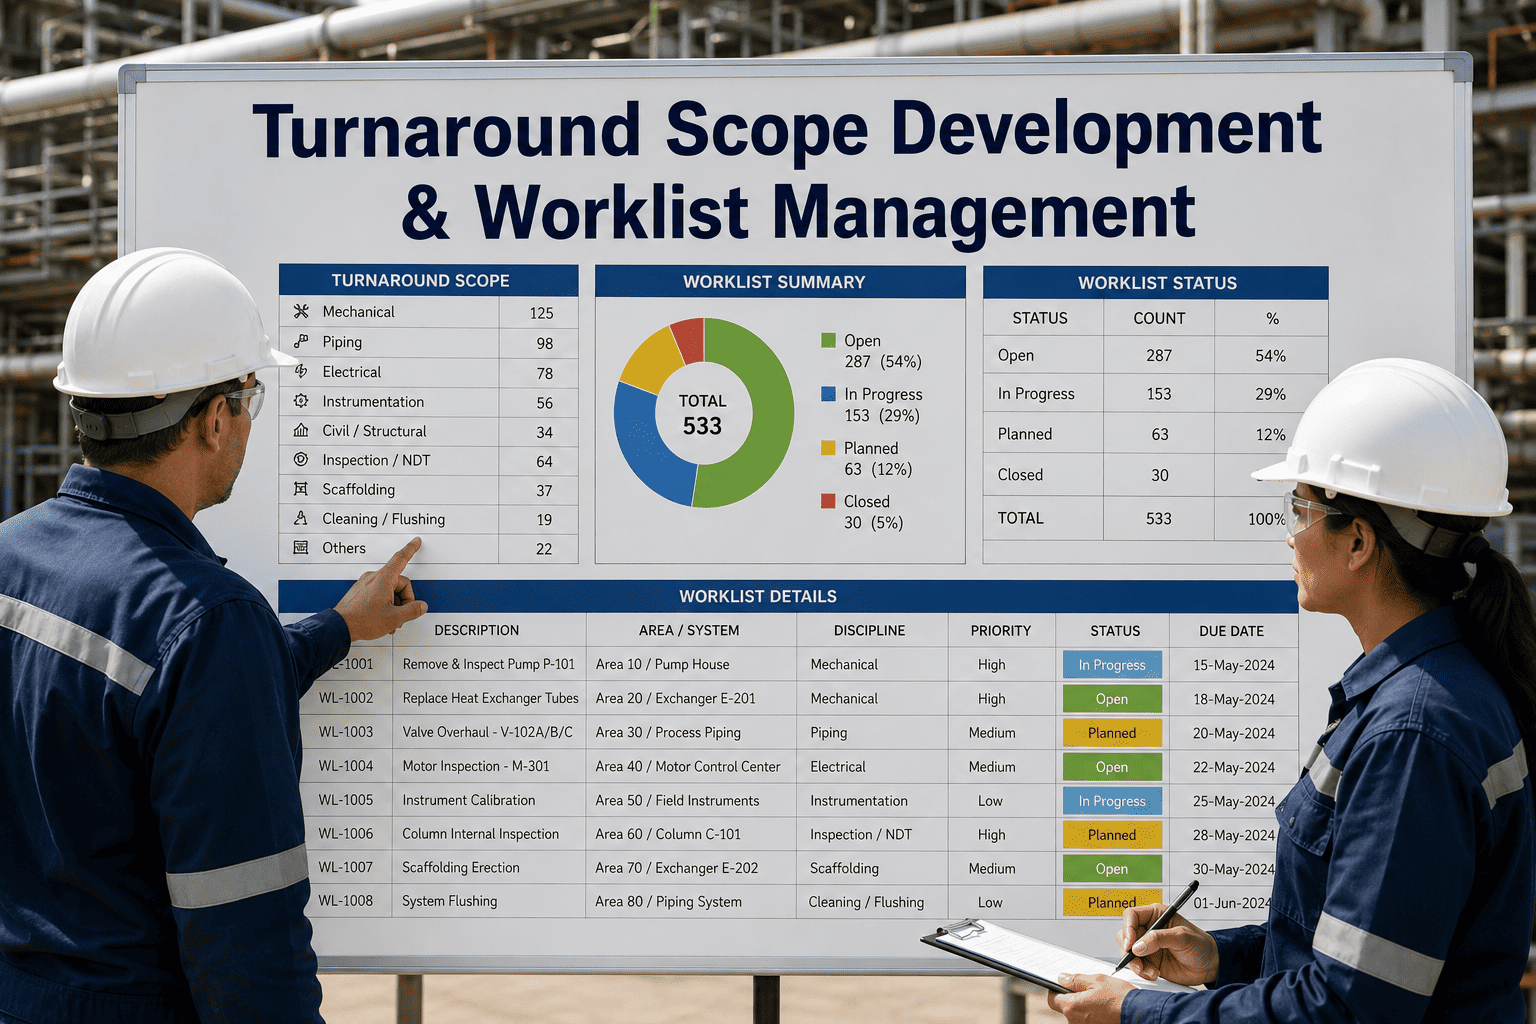
iFactory connects your historian data, inspection records, and CMMS work orders to a predictive analytics engine that feeds real condition intelligence directly into your TAR planning process — tightening scope decisions, exposing float risk, and generating prioritised work packages before scope freeze.
What Is Critical Path Method in Refinery Turnaround Planning?
CPM is a network-based scheduling technique that maps every work activity in a turnaround — from blind installation to catalyst removal to fired heater inspection — into a dependency chain and identifies the longest continuous sequence from shutdown commencement to start-up completion. That longest sequence is the critical path. Any delay on a critical path activity extends the entire turnaround duration by exactly the same amount. Activities not on the critical path carry float — measured time slack before they begin to affect total project duration.
For a refinery TAR, the practical value of CPM is not just schedule visibility. It drives resource allocation, identifies which contractors must never be constrained for manpower, flags which equipment deliveries can slip without consequence, and gives the TAR manager a defensible basis for scope change decisions. Facilities that apply CPM rigorously — building their network logic from confirmed work packages rather than historical duration averages — consistently deliver shorter turnarounds with fewer late discoveries and lower change order costs.
Critical Path Activities
Tasks with zero float whose delay directly extends turnaround duration — typically fired heater tube bundles, main fractionator internals, major rotating equipment overhauls, and catalyst changeouts on primary units.
Near-Critical Path Activities
Activities carrying less than 10% of total TAR duration in float. These routinely migrate onto the critical path when late discoveries add scope, making them the highest-risk cluster in the network.
Float Management
Total float is the buffer between planned completion and the point at which an activity becomes critical. Protecting float through scope discipline and resource continuity is what keeps schedule risk from compounding.
Logic Relationships
Finish-to-start, start-to-start, and finish-to-finish dependencies define how work packages interact. Incorrect logic in the CPM network produces misleading float calculations and hidden schedule risk.
$200M–$500M
Typical total cost exposure per major refinery TAR
30%
Average schedule overrun on high-complexity shutdowns without CPM discipline
8–15%
TAR duration reduction achievable through rigorous CPM and scope freeze management
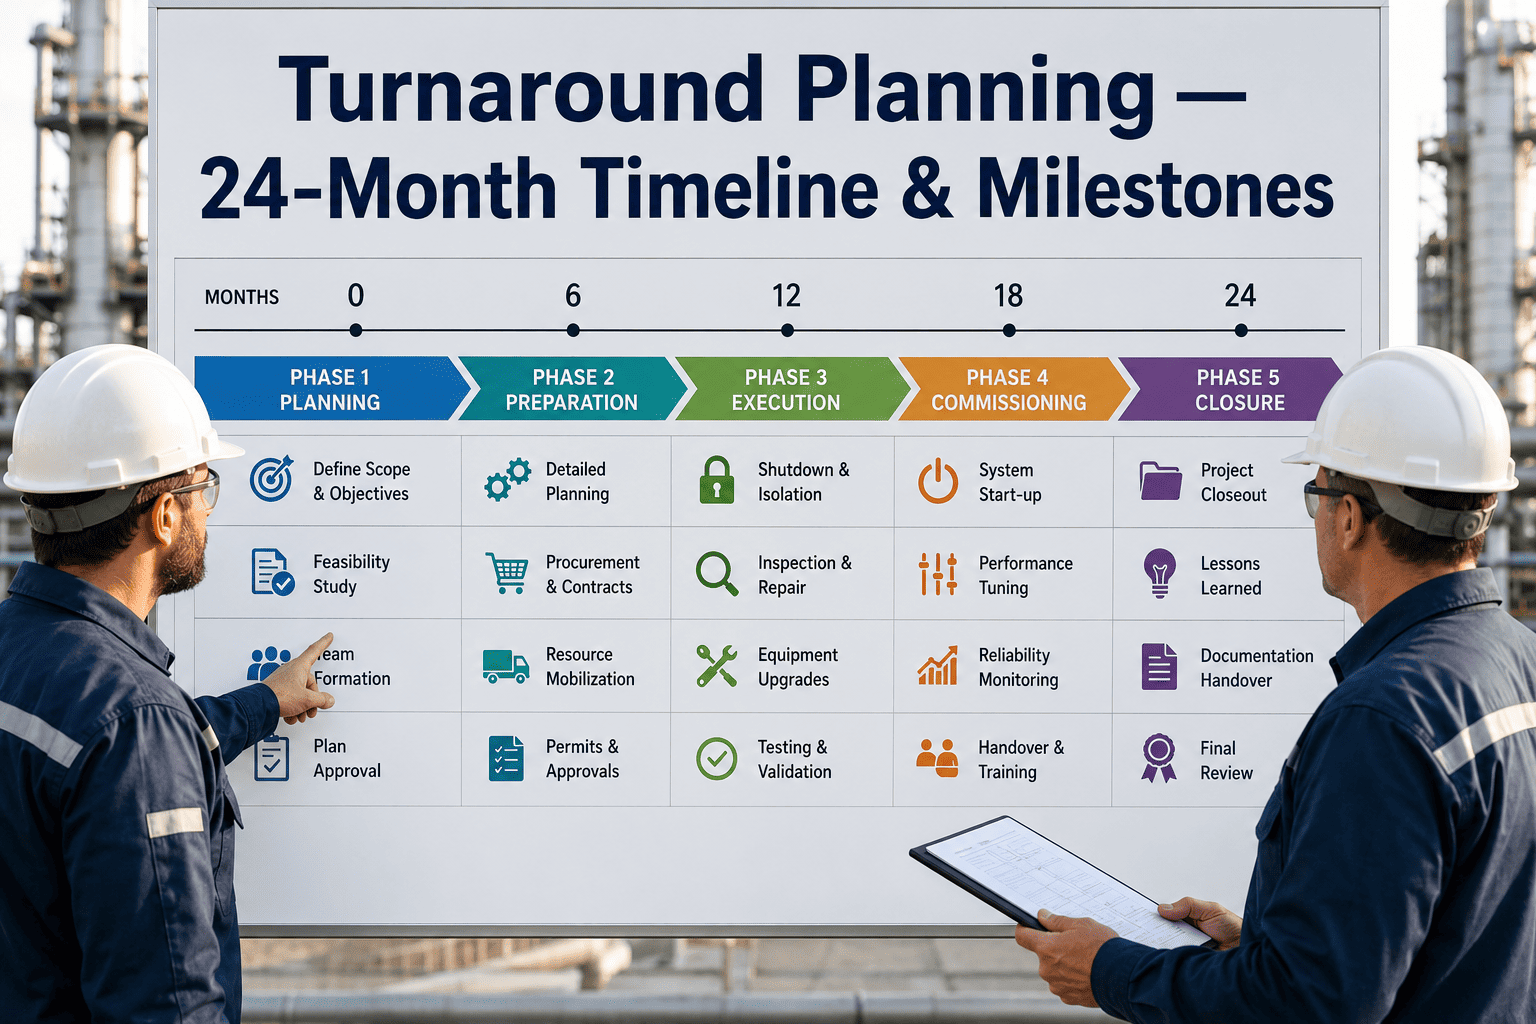
The Refinery TAR Planning Lifecycle: Five Phases and Where CPM Applies
CPM is not applied once during detailed scheduling. It is built, refined, and actively managed across the full turnaround lifecycle — and the quality of the network logic at each phase determines schedule integrity during execution.
01
Long-Range Planning (24–36 Months Out)
Teams establish the corporate TAR forecast, set preliminary budget boundaries, and secure long-lead equipment deliveries. Initial CPM framework is built from unit complexity models and prior turnaround actuals — not used for scheduling yet, but used to stress-test cost estimates and identify long-lead equipment whose delivery sequences will constrain the critical path.
02
Scope Development and Freeze (18–24 Months Out)
Work packages are defined, risk-ranked, and challenged for inclusion. Each proposed scope item is evaluated against the established inclusion criteria — statutory requirement, run-to-failure risk, or reliability improvement — and either committed, deferred, or cancelled. Scope freeze is enforced at a formal decision gate. Every addition after freeze carries a mandatory cost and schedule impact assessment. Industry analysis shows that 20–30% of typical TAR scope can be safely deferred through rigorous risk-based work selection.
03
Detailed Work Planning and CPM Network Build (12–18 Months Out)
Each work package is decomposed into discrete activities with defined durations, resource requirements, and logic relationships. The CPM network is built activity by activity — not imported from a prior TAR template — because logic errors from copied networks are among the most common sources of schedule surprise during execution. Resource leveling is applied against the critical path to identify contractor constraints before mobilisation.
04
Pre-Turnaround Readiness (3–6 Months Out)
Scaffolding access models are validated against the CPM schedule to avoid scaffold interference on parallel critical path activities. Long-lead materials are staged, contractor mobilisation sequences are locked to CPM logic, and permit schedules are mapped to the critical path to prevent work fronts from opening without required isolation documentation.
05
Execution and Daily Schedule Control
The CPM schedule becomes the execution control document. Daily progress meetings are driven by float consumption reports — not percentage complete metrics. Late discoveries are immediately assessed against the network to determine critical path impact before work is authorised. Post-TAR close-out captures actual durations and late discovery root causes to improve the next network build.
Scope Freeze: The Single Highest-Leverage Decision in TAR Planning
Every post-mortem on a turnaround that ran over schedule and over budget identifies the same primary driver: scope additions after freeze. Changes after scope freeze are almost always more expensive than they appear at first glance because of their cascading effects on network logic, contractor labour, material procurement, and permit sequencing. A single late-added heat exchanger bundle can consume days of float on near-critical activities and push the entire schedule past the committed return-to-service date.
Effective scope freeze management requires three things: a disciplined inclusion criterion applied without exception, a formal change control gate with full cost and schedule impact assessment for every addition, and condition-based intelligence from inspection and predictive analytics data that gives the planning team confidence the equipment left out of scope can safely run to the next TAR cycle. Book a Demo to see how iFactory's predictive models give your planning team the asset condition data needed to make scope freeze decisions with confidence rather than conservative guesswork.
| Planning Variable |
Without Scope Discipline |
With CPM-Linked Scope Freeze |
| Scope Growth Rate |
15–40% scope growth after freeze, driven by late discoveries and uncontrolled additions |
Scope additions capped at 5–10% through risk-based inclusion criteria and formal change gates |
| Schedule Overrun |
Average 30% overrun on complex TARs; each day of overrun at a 100,000 bpd refinery represents $3M–$7M in lost margin |
8–15% duration reduction versus prior cycle when CPM is built from confirmed work packages and scope freeze is protected |
| Contractor Efficiency |
Late scope additions disrupt planned work fronts, trigger overtime, and force contractor demobilisation and remobilisation |
Contractor sequences locked to CPM network; resource allocation optimised against critical path before mobilisation |
| Cost Overrun |
Average 20% cost overrun on high-complexity shutdowns; emergency procurement and expedited delivery inflate materials costs by 30–60% |
Budget variance controlled within 5–8% when scope freeze is maintained and long-lead procurement is CPM-sequenced |
| Late Discovery Impact |
Unplanned repairs discovered during execution consume float across multiple activities simultaneously |
Predictive condition data and advanced NDE reduce late discovery rate by identifying required repairs before shutdown |
Float Management: Protecting Schedule Integrity From Scope Freeze to Start-Up
Total float is the amount of time an activity can be delayed without extending the project end date. On a refinery TAR with hundreds of concurrent work activities, float is the primary financial asset in your schedule. It absorbs late discoveries, equipment delays, inspection findings, and contractor performance variance. Once float is consumed, every subsequent delay extends the duration of the entire turnaround — and the cost of that delay is measured in lost production margin, not just maintenance spend.
The most common source of float erosion is not a single catastrophic event. It is the accumulation of small scope additions, each of which appears manageable in isolation, and each of which consumes float from near-critical activities until the network has no remaining buffer. Managing float means managing scope — and managing scope requires the asset condition intelligence to know which deferred items can wait and which cannot.
Zero Float
Critical Path Definition
Any activity with zero total float is on the critical path. Delay of even one day extends the return-to-service date by one day — at a cost of $3M–$7M in lost production margin per day at a mid-size refinery.
<10% TAR
Near-Critical Float Threshold
Activities with float below 10% of total TAR duration are near-critical. These routinely migrate onto the critical path when late discoveries consume schedule buffer.
Daily
Float Reporting Cadence
Float consumption reports run daily during execution. Progress meetings are structured around float status, not percentage complete — because percentage complete does not predict schedule completion date.
20–30%
Deferrable Scope
Industry analysis shows 20–30% of typical TAR scope can be safely deferred through rigorous risk-based work selection — directly protecting float for unavoidable late discoveries.
15–25%
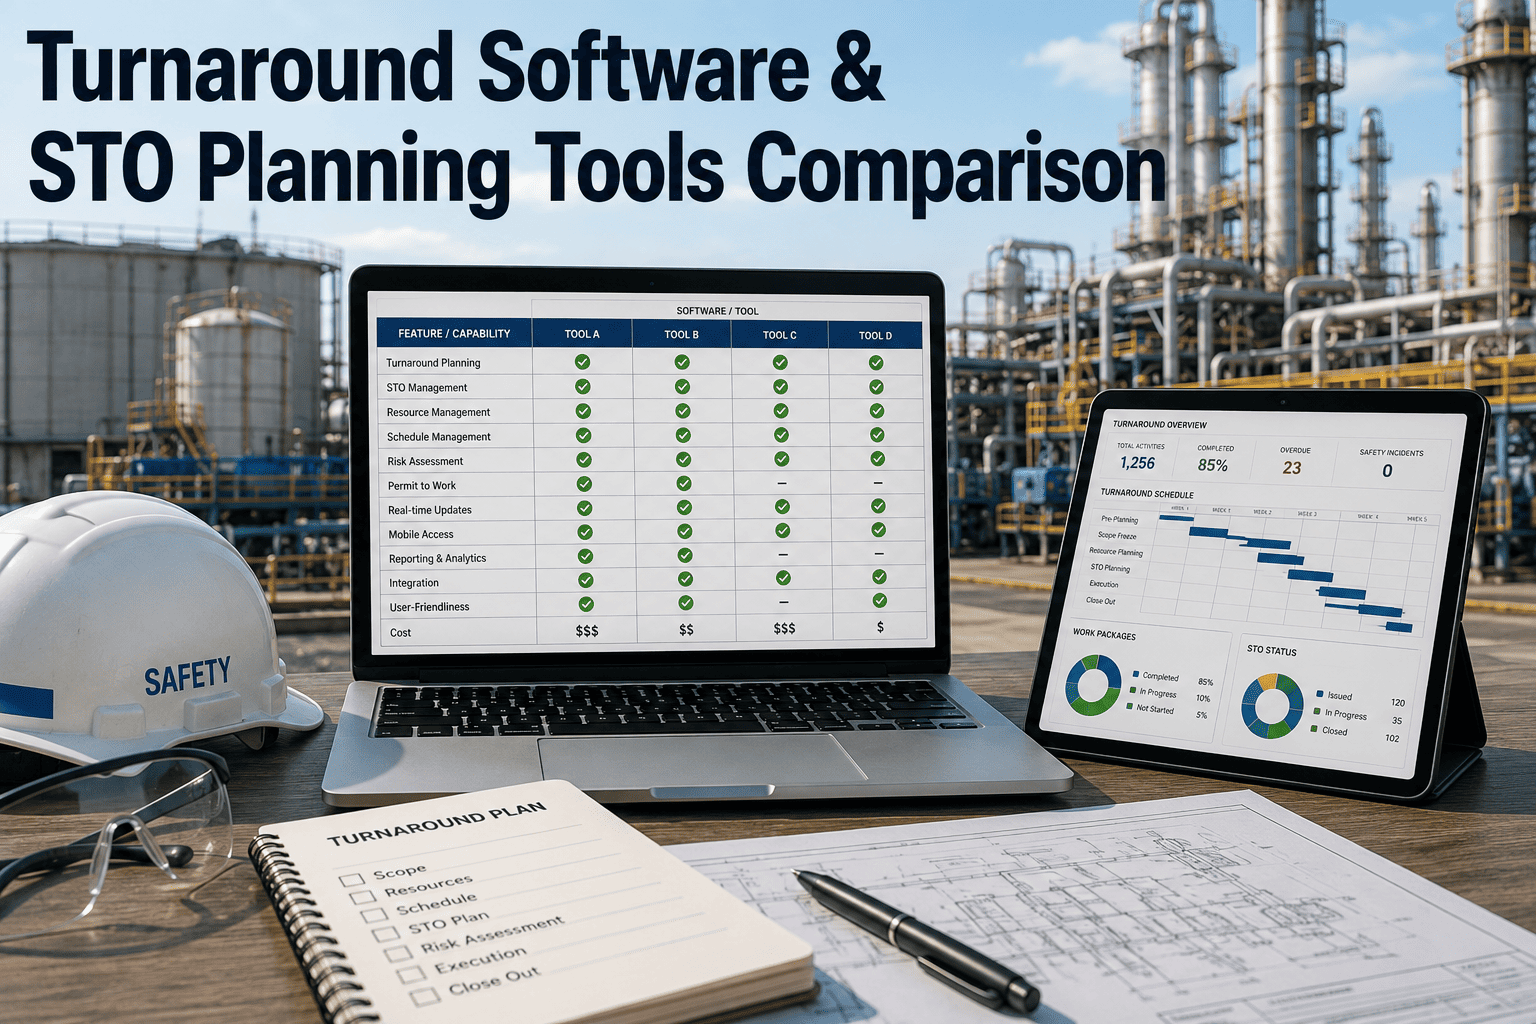
Duration Reduction with Digital Tools
Facilities using digital turnaround management tools integrated with real-time condition data report 15–25% shorter TAR durations versus prior cycles managed on fixed-schedule assumptions.
15%
Efficiency Gain from Cross-Functional Planning
Collaborative cross-functional planning — operations, maintenance, inspection, and procurement aligned on a single CPM network — improves turnaround efficiency by 15% at major operators.
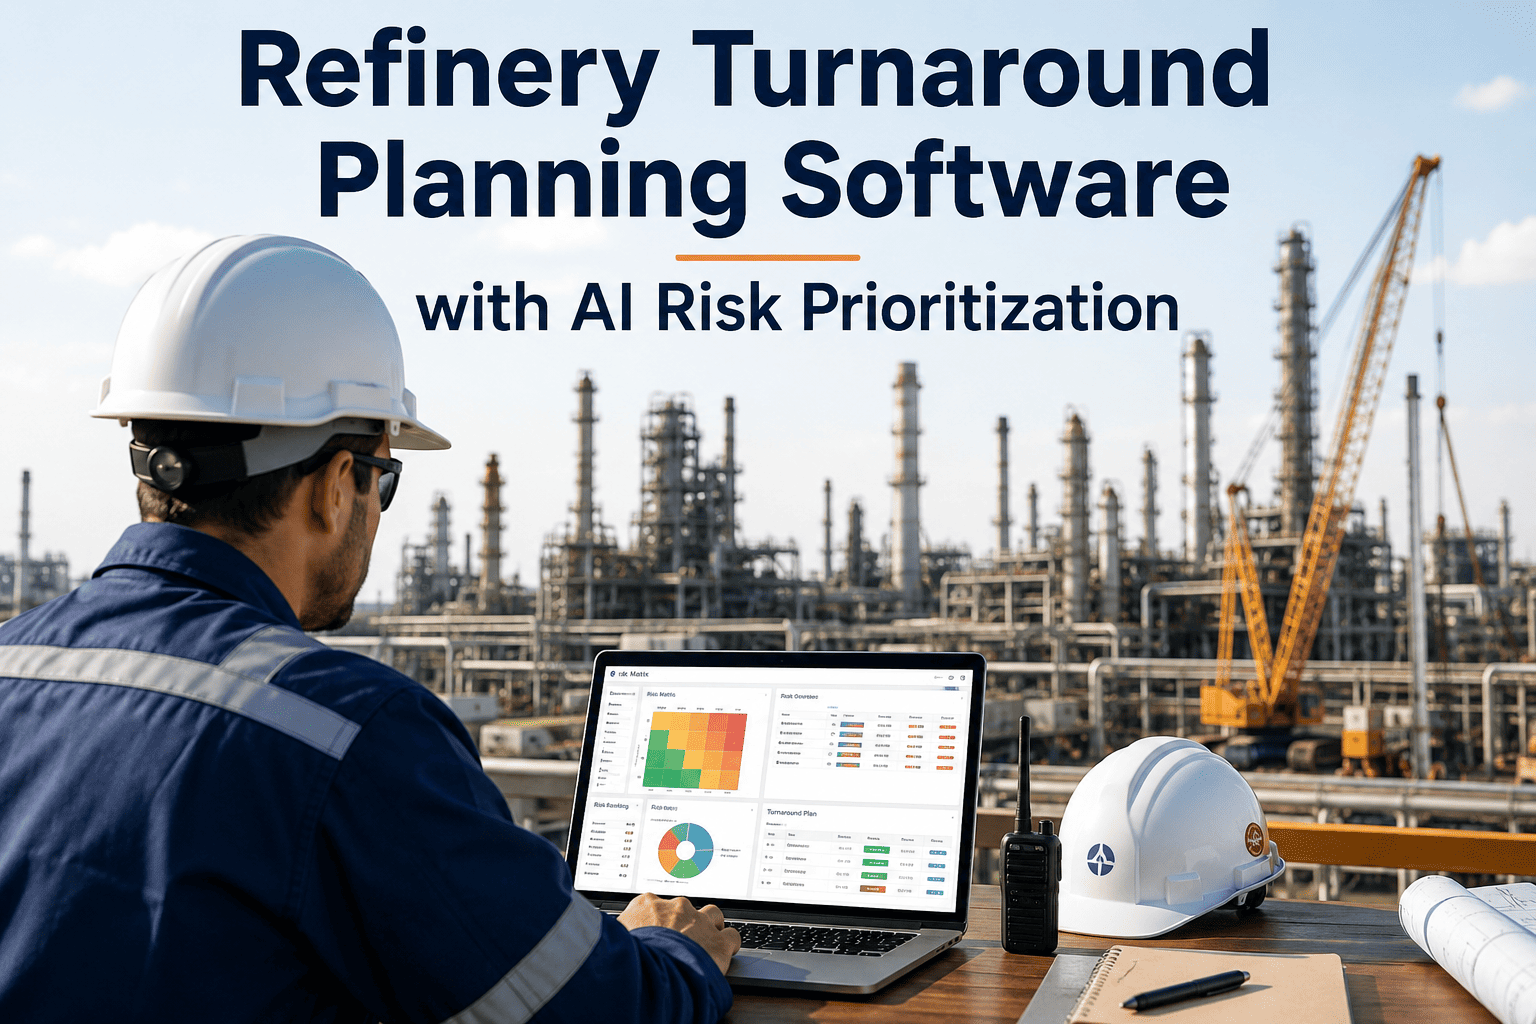
How iFactory Predictive Analytics Strengthens TAR Planning and CPM Execution
The most damaging source of TAR schedule overrun is not poor CPM logic — it is equipment condition uncertainty. When the planning team cannot confirm whether a heat exchanger requires full retubing or a targeted tube plug, they add conservative scope to protect against the worst case. That conservative scope consumes float, extends contractor sequences, and inflates cost estimates. Predictive analytics eliminates that uncertainty by providing confirmed degradation data before scope freeze.
iFactory ingests your PI Historian data, vibration trends, corrosion monitoring records, and CMMS work order history to build asset-specific degradation models that tell your TAR planning team exactly which equipment requires intervention in this TAR cycle versus which can run safely to the next. That intelligence is what allows scope freeze to be genuine — not a nominal date that everyone knows will shift because the team lacks confidence in deferred items.
01
Asset Condition Data Ingested Before Scope Freeze
iFactory connects to PI Historian, OSIsoft AF, DCS archives, and CMMS work order databases — providing degradation trend data, remaining useful life estimates, and failure probability scores for every asset in the TAR scope 6–12 months before freeze date. Scope inclusion decisions are made on confirmed condition data, not conservative assumptions.
02
Failure Probability Scores Mapped to TAR Work Packages
Each asset's ML-derived failure probability score is mapped directly to the corresponding TAR work package — giving the planning team a risk-ranked priority list for scope challenge reviews. Assets with low failure probability and long remaining useful life are flagged for deferral, protecting float for confirmed repair requirements.
03
Late Discovery Risk Reduced by Pre-Shutdown Detection
iFactory's multi-parameter anomaly detection identifies degradation signatures — bearing wear, heat exchanger fouling, compressor seal deterioration — 1–6 weeks before failure. During TAR planning, this translates to pre-positioning repair scope and materials for high-probability findings before shutdown, eliminating the float impact of surprise discoveries during execution.
04
CMMS and ERP Integration in Under 7 Days
iFactory connects to SAP PM, IBM Maximo, Infor EAM, and Oracle EBS via OPC-UA, Modbus TCP, and REST APIs. Predictive findings auto-generate prioritised TAR work orders with failure probability, recommended intervention, and parts procurement triggers — feeding directly into your CPM network as confirmed work packages with validated durations.
94%
Failure Prediction Accuracy
ML models trained on your plant's PI Historian and CMMS data — not generic industry averages
1–6 Wks
Failure Prediction Lead Time
Sufficient lead time to add confirmed findings to TAR scope before freeze without disrupting CPM logic
5 Weeks
Full Deployment Timeline
From data audit to live predictive models — without open-ended data science engagements or custom configuration
7 Days
CMMS Integration
Full OPC-UA and REST API connection to your existing CMMS and ERP maintenance stack
Expert Review: What Senior TAR Planners Say About CPM and Predictive Data
The CPM network is only as reliable as the scope that feeds it. For years, we built conservative scope into the network to protect against equipment findings we couldn't confirm before shutdown — and that conservatism cost us float before execution even started. When we began integrating iFactory's asset degradation data into our scope challenge reviews, the scope freeze date became real for the first time. We deferred seven heat exchanger bundles in our last TAR cycle based on remaining useful life data from the predictive models. All seven ran cleanly to the next planned interval. That deferral alone freed up eleven days of contractor time on near-critical activities and brought the TAR in four days under the original CPM baseline — the first time we had beaten our baseline schedule in eight consecutive TARs.
Senior Turnaround Planning Manager
Crude Distillation Complex, U.S. Gulf Coast Refinery
Give Your TAR Planning Team the Asset Condition Data That Makes Scope Freeze Stick.
iFactory's predictive analytics platform connects your historian, inspection records, and CMMS work orders to deliver failure probability scores, remaining useful life estimates, and prioritised work packages — directly into your TAR planning workflow, 6–12 months before scope freeze.
Book a Demo with our refinery analytics team and see a live deployment walkthrough on a plant dataset comparable to yours.
Conclusion: CPM Is the Framework — Asset Intelligence Is What Makes It Work
The Critical Path Method is not a scheduling tool. It is a discipline for managing scope, float, resource allocation, and change control across one of the most complex capital events in industrial operations. Refineries that master CPM — building their network from confirmed work packages, enforcing scope freeze with asset condition data rather than conservative assumptions, managing float as a financial asset, and structuring execution around daily float consumption reports — deliver TARs that run on schedule, within budget, and without the reactive cost absorption that erodes annual profitability.
The gap between a turnaround that finishes four days under baseline and one that runs three weeks over is not a scheduling software gap. It is a scope intelligence gap. Facilities with predictive condition data closing that gap before scope freeze are the ones delivering 8–15% duration reductions, eliminating late discovery surprises that consume the network's remaining float, and returning units to service on the committed date. That is what iFactory is built to provide — not a generic predictive maintenance dashboard, but an asset-specific degradation intelligence engine that feeds directly into the TAR planning workflow your reliability and scheduling teams already use. Book a Demo to see how.
Frequently Asked Questions
How far in advance should the CPM network be built for a refinery turnaround?
The detailed CPM network should be constructed 12–18 months before shutdown, once confirmed work packages are available from the scope development phase. Building from confirmed packages — not from prior TAR templates — is what produces accurate float calculations.
What is the most common cause of critical path slippage during TAR execution?
Late equipment discoveries that require unplanned repairs are the primary driver, followed by scope additions after freeze that consume float from near-critical activities. Both are reduced by integrating predictive condition data into the pre-shutdown scope process.
How does iFactory support the TAR scope challenge process?
iFactory provides asset-specific failure probability scores and remaining useful life estimates derived from your PI Historian and inspection data — giving the TAR planning team confirmed condition intelligence to challenge scope inclusions with data rather than conservative assumptions.
What float threshold should trigger escalation during TAR execution?
Activities with float below 10% of total TAR duration should trigger immediate TAR manager review. Once an activity crosses into near-critical territory, any further delay requires a formal impact assessment against the full network before additional work is authorised.
How quickly can iFactory be deployed ahead of an upcoming TAR planning cycle?
iFactory deploys in five weeks from data audit to live predictive models, with CMMS integration completed in under seven days — well within the planning window for facilities 12 or more months from their next TAR event.
Turn Your Plant's Historical Data Into a TAR Planning Advantage. Deploy in 5 Weeks.
iFactory gives refinery reliability and TAR planning teams ML models trained on their own historian and CMMS data — delivering asset condition intelligence that tightens scope freeze decisions, reduces late discoveries, and feeds confirmed work packages directly into your CPM network before the planning cycle closes.
94% Prediction Accuracy
PI Historian Native Integration
CMMS Connected in 7 Days
8–15% TAR Duration Reduction
5-Week Full Deployment