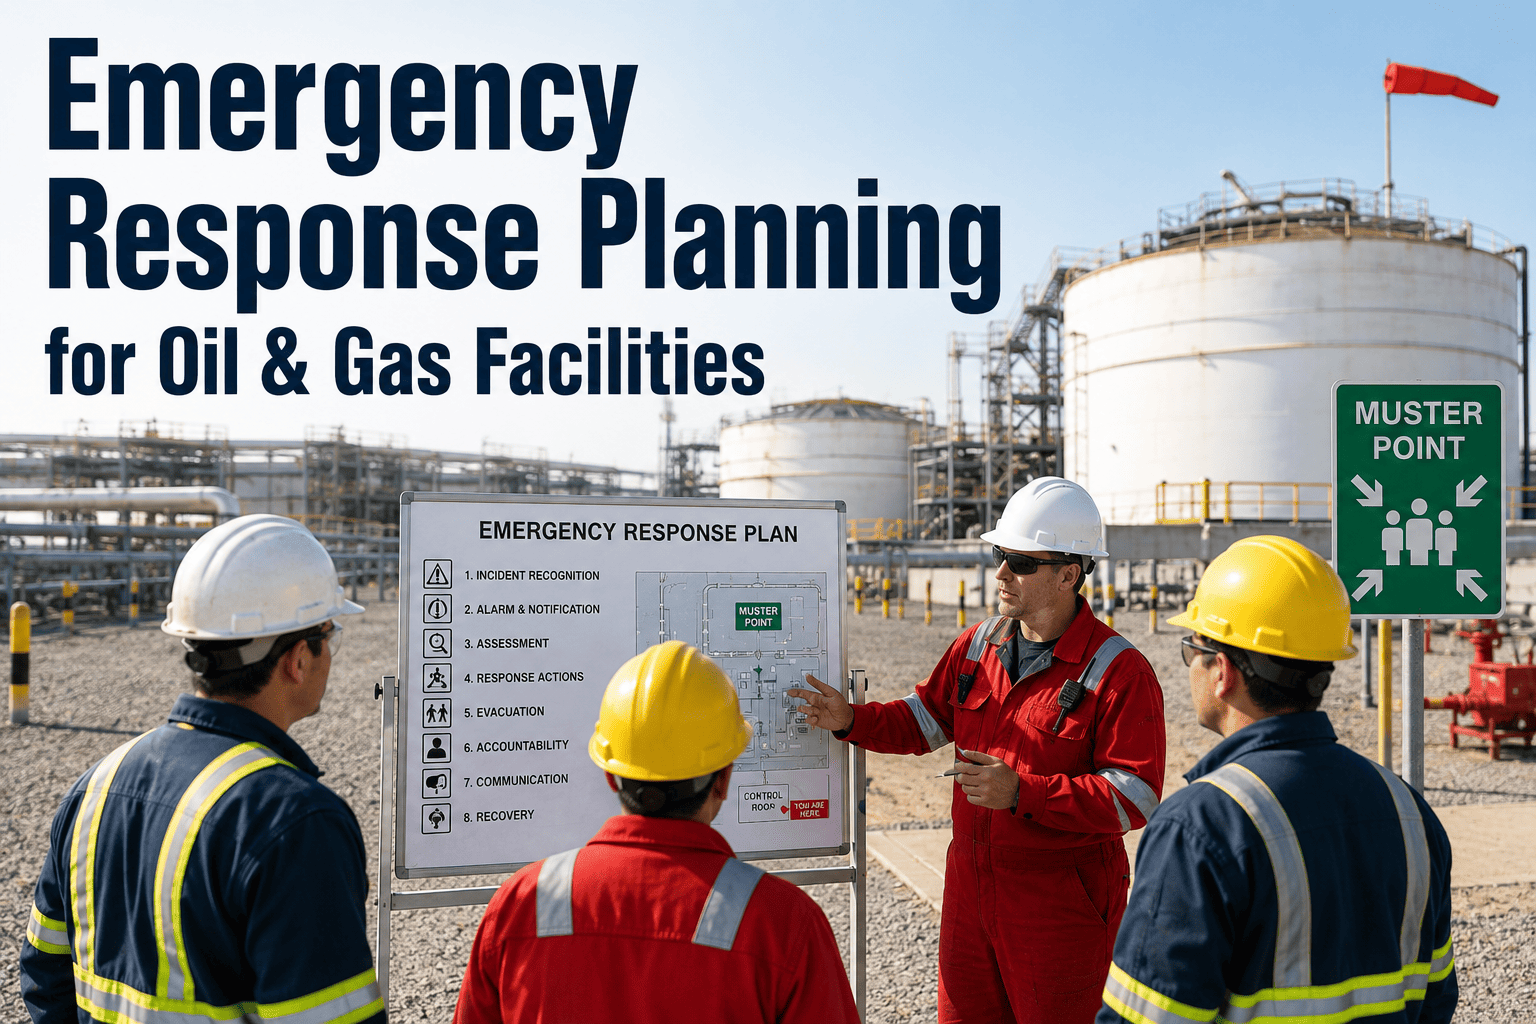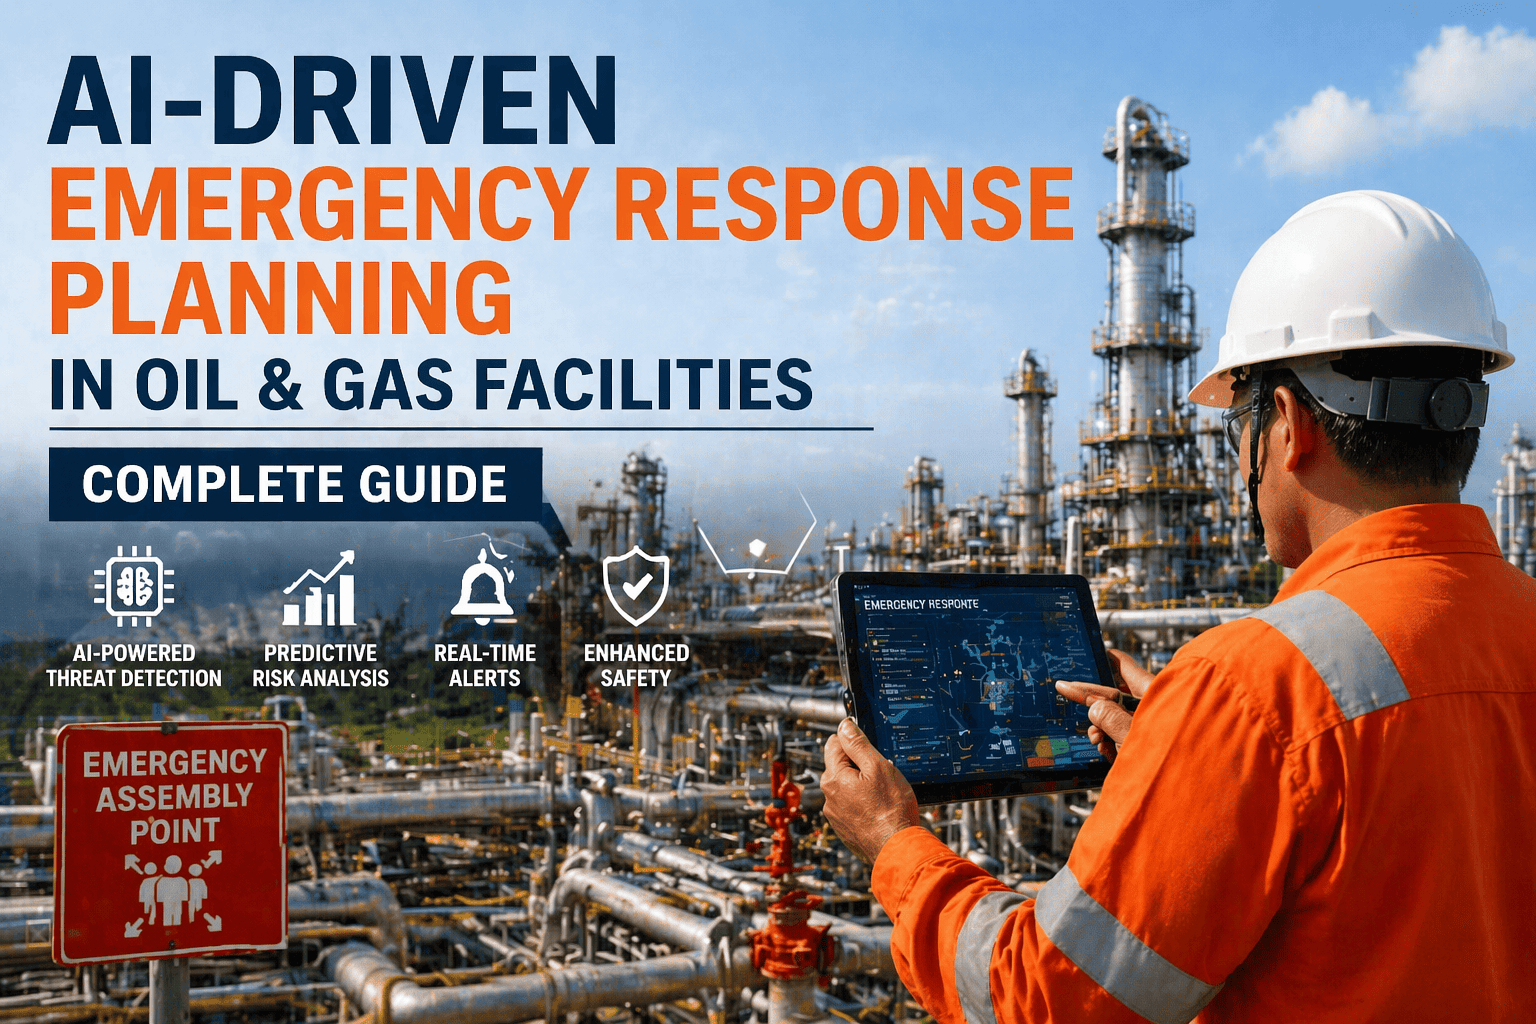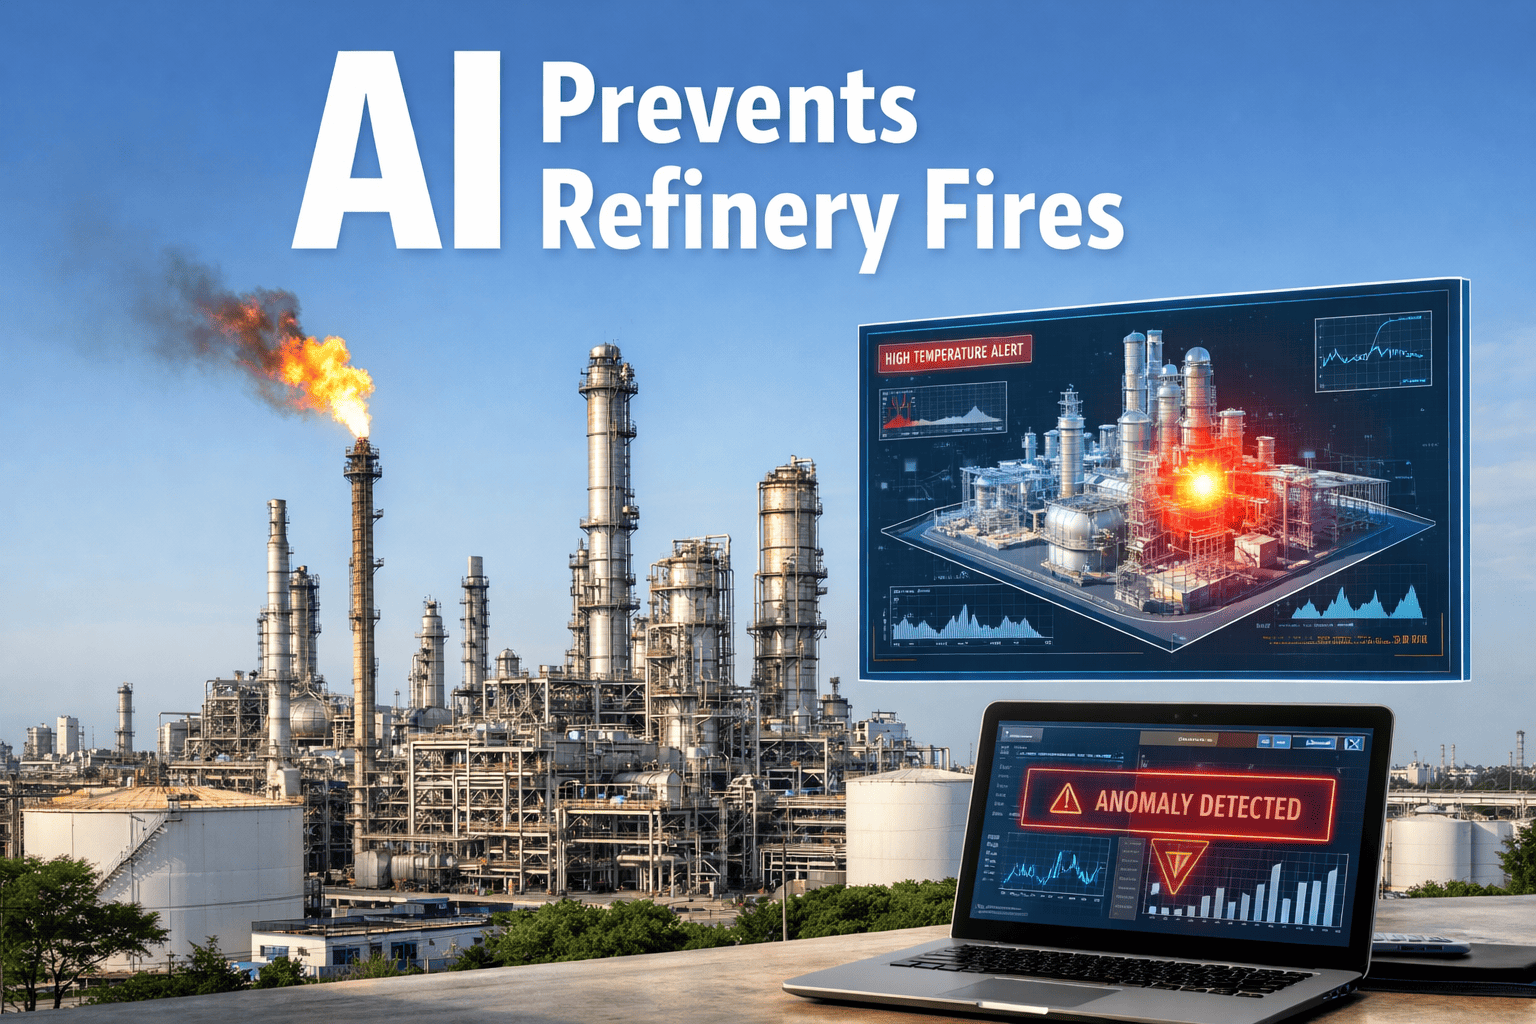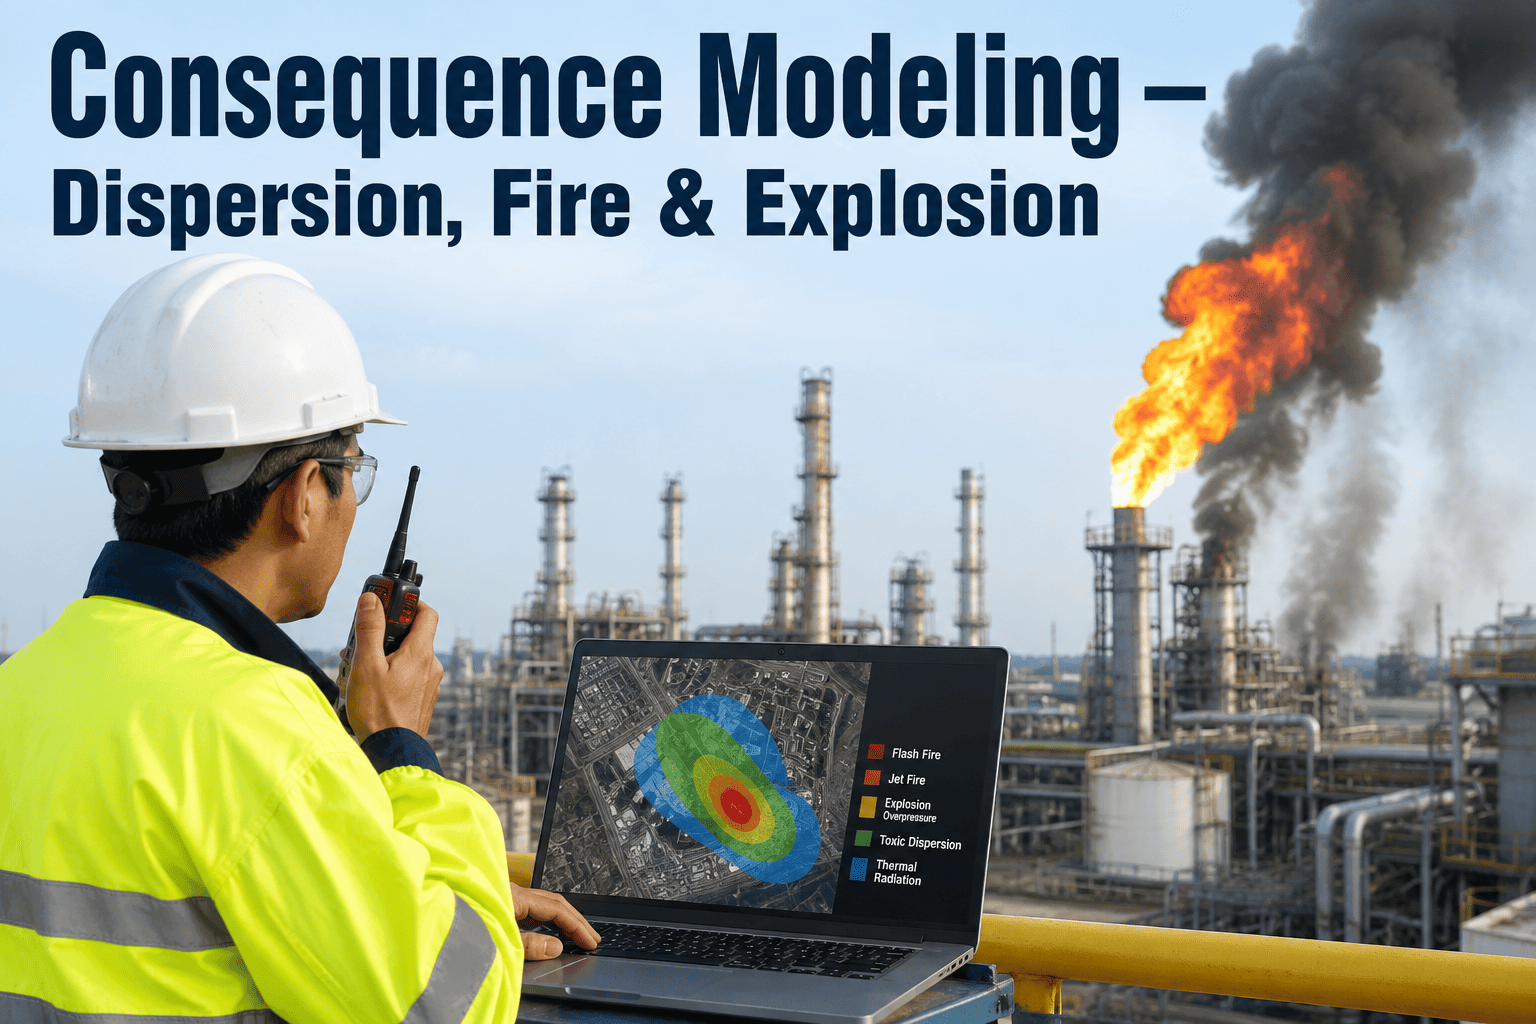
A release of flammable or toxic material doesn't become a real hazard until someone can say how far it will travel, how hot it will burn, or how hard it will hit. Consequence modeling turns a hypothetical loss of containment into a specific radius on a map — a toxic plume boundary, a jet fire's flame length, the overpressure ring from a vapor cloud explosion — so that emergency response plans, evacuation zones, and equipment spacing are based on physics rather than guesswork. Tools like PHAST, FLACS, and EFFECTS each model a different piece of that picture, and picking the wrong one for a given scenario is a surprisingly common mistake in facility siting work. A demo can show how modeled consequence zones connect directly into emergency response planning.
Why a Hazard Needs a Number, Not Just a Name
Knowing that a vessel contains a flammable or toxic material isn't the same as knowing what happens if it releases. Consequence modeling takes a defined source term — a hole size, a pressure, a phase of release — and works forward through discharge, dispersion or combustion, to a physical endpoint: a toxic concentration boundary, a radiant heat footprint, or an overpressure contour. That endpoint is what actually drives decisions during facility siting, quantitative risk assessment, and emergency response planning, because a plant can only size an evacuation zone or a control-room blast wall correctly if it knows the real distance the hazard reaches, not an assumed one.
Getting this wrong in either direction carries a cost. Undersizing a hazard zone leaves people and equipment inside a boundary that looks safe on paper but isn't. Oversizing it wastes money on separation distances, protective structures, or evacuation radii that were never actually necessary, and it can erode trust in the modeling process itself the next time a number gets questioned.
Five Scenarios, Five Different Physics
Choosing the Right Modeling Tool
| Tool | Best Suited For | Why It's Used |
|---|---|---|
| PHAST / Safeti | Dispersion, pool and jet fires, BLEVE, toxic effects | Covers the full release-to-endpoint chain in one integrated package |
| FLACS | Gas dispersion and explosion in congested or confined 3D geometry | CFD-based modeling captures how equipment density changes overpressure |
| EFFECTS | Source term, dispersion, fire and explosion calculations | Built on the TNO Colored Books methodology used widely in facility-wide QRA |
Common Modeling Mistakes That Undersize Real Risk
Inputs That Actually Drive Accuracy
Where Consequence Modeling Feeds Into Regulatory Compliance
Consequence modeling isn't just an internal engineering exercise — it's frequently the technical backbone behind a facility's regulatory submissions. OSHA's Process Safety Management standard and the EPA's Risk Management Program both expect a documented hazard analysis that can justify the separation distances, mitigation systems, and emergency planning zones a facility has chosen, and consequence modeling outputs are usually what that justification is built on. In jurisdictions covered by Seveso-style major accident hazard regulations, the same modeling underpins the safety report submitted to regulators.
The practical implication is that a consequence model isn't a one-time deliverable filed away after a siting study. Regulators and auditors periodically expect to see that the modeled scenarios still reflect current inventory, layout, and process conditions, which is why tying model review to the same management-of-change triggers used elsewhere in a process safety program keeps a facility's compliance position current rather than reactive.
From Model Output to Emergency Response Plan
A consequence model is only useful once its output becomes a decision. A dispersion boundary needs to translate into a shelter-in-place or evacuation radius that responders can actually use. A jet or pool fire's radiant heat footprint needs to inform equipment spacing and fireproofing specs before construction, not after. A vapor cloud explosion's overpressure contour needs to drive control-room and occupied-building siting, since that's where a poorly sited structure turns a process incident into a fatality event. The modeling work is the input; the response plan, the layout drawing, and the siting study are where it actually protects anyone.
This is also where consequence modeling connects back to the leading and lagging indicators tracked elsewhere in a process safety program. A facility that models its worst-case scenarios accurately but never updates those models as equipment, inventory, or layout changes is working from a hazard picture that's already stale, which is its own kind of leading indicator worth watching.