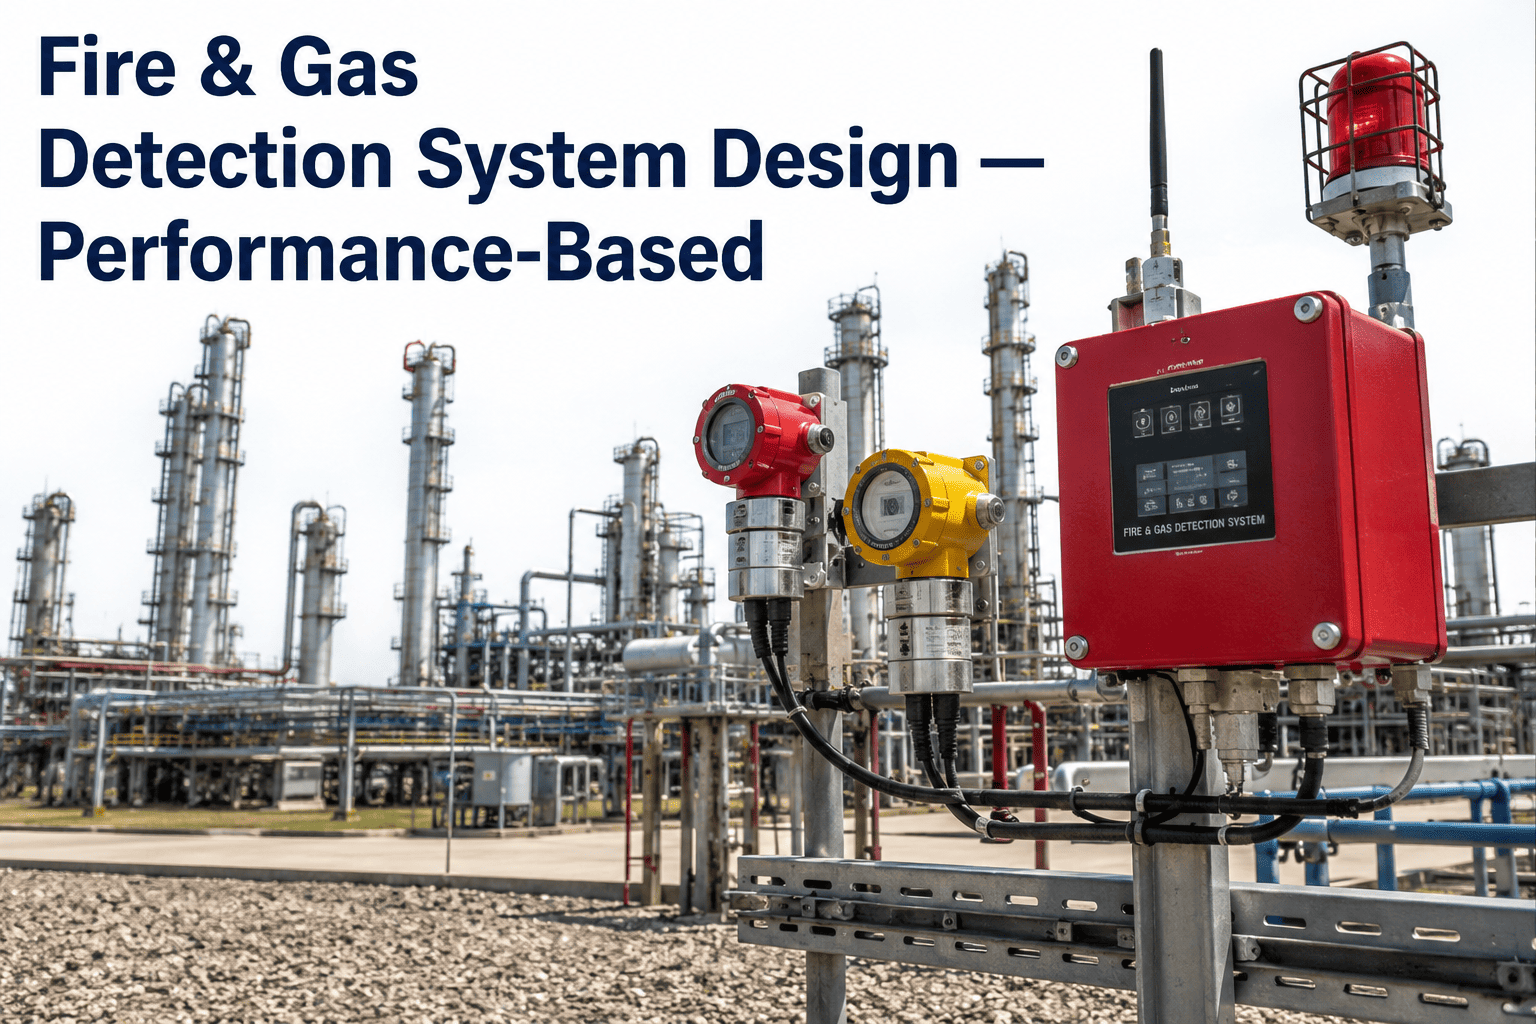
Fire and gas detection systems in oil and gas facilities have traditionally been designed by spacing detectors at prescribed intervals or following vendor recommendations without verifying whether the proposed layout actually covers the hazard scenarios present at the installation. This prescriptive approach consistently produces systems that look compliant on a plot plan but leave significant gaps in coverage when tested against actual leak scenarios, wind conditions, and equipment geometry. Performance-based design flips this logic by starting with the specific hazard scenarios the system must detect, defining the required detection coverage target for each scenario, and then placing and configuring detectors to provably meet that target using geographic mapping and quantitative analysis. iFactory connects hazard scenario data, detector layout models, and coverage mapping outputs into one verifiable detection design model so engineers can demonstrate coverage achievement to regulators and project stakeholders with precision, and you can book a demo to see how your F&G layout performs against your actual hazard scenarios.
PERFORMANCE-BASED F&G DESIGN
Spacing Detectors by Code Leaves Gaps That Leaks Will Find First
iFactory builds a performance-based fire and gas detection model where every detector placement is verified against defined hazard scenarios, coverage targets, and voting logic requirements before a single device is procured.
DESIGN PHILOSOPHY
Prescriptive Spacing vs Performance-Based Verification
The shift from prescriptive to performance-based design is not a regulatory preference, it is an engineering necessity driven by the recognition that uniform spacing cannot account for the variability in leak sources, release rates, wind patterns, and obstruction geometries that exist at any real facility. The comparison below shows why the two approaches produce fundamentally different system effectiveness.
PRESCRIPTIVE SPACING APPROACH
Detectors placed at fixed intervals from codes or vendor guides without reference to specific leak scenarios at the installation
Coverage assumed based on detector quantity and area rather than verified through geographic or quantitative analysis
Voting logic selected from default templates without analysis of whether the voting architecture matches the risk reduction requirement
No defensible evidence available to demonstrate that the installed system achieves a defined detection performance target
PERFORMANCE-BASED DESIGN
Detector placement derived from defined hazard scenarios including release rate, leak location, wind direction, and detection target size
Coverage verified through geographic mapping that shows the detection footprint of each device against the scenario being assessed
Voting logic optimized based on required SIL, spurious trip tolerance, and the consequence severity of each detected scenario
Complete audit trail from hazard scenario through coverage analysis to detector placement and voting configuration
DESIGN PROCESS
The Performance-Based Design Sequence From Scenario to Verified Layout
Performance-based design follows a structured sequence where each step builds on the output of the previous one. Skipping steps or reversing the order produces the same gaps that prescriptive design creates, just with more documentation attached to them.
01
Define Hazard Scenarios
Identify specific release scenarios with source location, release rate, fluid type, and wind conditions for each area
02
Set Coverage Targets
Define required detection coverage as a percentage of the hazardous area for each scenario based on risk reduction needs
03
Select Detection Technology
Match detector type to the hazard characteristics including gas type, expected concentration, and environmental conditions
04
Map Geographic Coverage
Model detection footprints for each candidate detector position and verify aggregate coverage against the defined target
05
Optimize Voting Logic
Configure voting architecture to meet SIL requirements while balancing detection speed against spurious trip rate
DETECTION TECHNOLOGIES
Fire and Gas Detection Technologies and Where They Fit in a Performance-Based Layout
No single detector type covers all scenarios. A performance-based design selects technology based on the specific characteristics of each hazard scenario, the environmental conditions at the installation, and the detection performance required to achieve the risk reduction target.
Point Gas Detectors
Catalytic or infrared point sensors that measure gas concentration at a fixed location
Best for enclosed areas, well-ventilated zones with predictable gas accumulation points, and low-pressure small releases
Open Path Gas Detectors
IR beam between transmitter and receiver measuring gas concentration along the beam path
Best for perimeter monitoring, large open process areas, and high-pressure releases where gas plumes extend across significant distances
UV/IR Flame Detectors
Multi-spectrum sensors detecting ultraviolet and infrared radiation emitted by hydrocarbon flames
Best for rapid fire detection in outdoor process areas where smoke detection is too slow and line-of-sight is available
Multi-Spectrum IR Flame Detectors
IR-only sensors analyzing multiple infrared wavelength bands to discriminate hydrocarbon flames from false sources
Best for areas with high false alarm potential from sunlight, welding, or hot surfaces where UV/IR would nuisance trip
Linear Heat Detection
Cable or fiber optic sensors that report temperature change or absolute temperature along their installed length
Best for cable trays, conveyors, enclosed equipment bays, and areas where point smoke or heat detectors cannot provide adequate coverage
Smoke and Heat Detectors
Point or beam smoke detectors combined with fixed-temperature or rate-of-rise heat detectors
Best for enclosed buildings, control rooms, switchgear rooms, and enclosed turbine packages where fire develops in a confined space
COVERAGE MAPPING
Geographic Coverage Analysis Metrics That Define Detection Effectiveness
Coverage mapping is the core analytical step that separates performance-based design from prescriptive spacing. It produces quantifiable metrics that can be verified, audited, and compared against defined targets. The metrics below represent the standard measures used in ISA 84.00.07 compliant coverage assessments.
Scenario Coverage Fraction
Percentage of the hazardous area where the defined gas cloud or fire size is detected by at least one device
Detection Time to Alarm
Time from release ignition to alarm activation at the defined voting threshold for the worst-case scenario position
Geographic Coverage Ratio
Ratio of covered area to total assessed area for each detection zone, weighted by scenario frequency and consequence
Detector Utilization Efficiency
Proportion of each detector coverage footprint that contributes to verified scenario coverage versus redundant or low-value overlap
VOTING LOGIC
Voting Logic Architectures and Their Impact on Detection Performance
Voting logic determines how many detectors in a voted group must alarm before the system initiates a protective action. The choice of voting architecture directly affects both the probability of detection on demand and the rate of spurious trips that disrupt operations without a real hazard present.
Your Detector Plot Plan Shows Coverage — But Can You Prove It Meets the Scenario Requirement?
iFactory builds a verifiable F&G detection model where every detector position is mapped against defined hazard scenarios, coverage targets are quantified, and voting logic is optimized to match your SIL and spurious trip requirements.
SIL REQUIREMENTS
From SIL Target to Detector Architecture: The Performance Chain
The SIL assignment for a fire and gas function is not a property of the detectors themselves. It is a property of the entire safety instrumented function from sensor through logic solver to final element. The chain below shows how the SIL target flows down into specific detector architecture requirements that the coverage analysis and voting logic must satisfy.
SIL ASSIGNMENT
Determine Required SIL from LOPA
Layer of protection analysis assigns a SIL target to the F&G function based on the initiating event frequency and the consequence severity it is protecting against.
DETECTION REQUIREMENT
Define Probability of Detection on Demand
Translate the SIL target into a required probability of detection for the defined hazard scenario, accounting for the detector technology failure rate and the coverage gap where the scenario is undetected.
COVERAGE TARGET
Set Minimum Geographic Coverage Fraction
Calculate the minimum scenario coverage fraction needed to achieve the required probability of detection given the detector technology reliability and the voting architecture selected.
Verify Layout Against Target
Run geographic coverage analysis on the proposed detector layout and confirm that the achieved coverage meets or exceeds the minimum fraction calculated in the previous step.
LAYOUT VERIFICATION
DESIGN ERRORS
Common Design Errors That Undermine Performance-Based F&G Systems
Even when a project commits to performance-based design, specific errors in execution can produce a system that carries the performance-based label but delivers prescriptive-level effectiveness. The patterns below represent the most frequently observed failures in F&G design reviews across upstream and downstream oil and gas projects.
DESIGN PHASE ERRORS
Hazard scenarios defined at a level too generic to drive specific detector placement decisions
Coverage target set without reference to the SIL requirement or the detector technology failure rate
Wind conditions modeled as a single dominant direction rather than a full wind rose distribution
Detector selection based on familiarity or vendor preference rather than scenario-specific performance characteristics
Obstruction effects from equipment, piping, and structures not included in the coverage mapping model
VERIFICATION PHASE ERRORS
Coverage analysis run for average conditions only without verifying worst-case wind and release rate combinations
Voting logic selected independently from the coverage analysis without checking whether the voted group actually achieves the required detection probability
Detector positions optimized for one scenario without re-verifying coverage for all other scenarios in the same zone
As-built deviations from the design model not captured and not re-analyzed for coverage impact
Proof testing intervals assumed rather than derived from the actual failure rate data used in the SIL calculation
READINESS CHECK
Pre-Design Readiness Checklist for Performance-Based F&G Projects
Use this checklist to confirm that the project has the foundational inputs required before starting a performance-based detection design. Starting without these inputs produces analysis that must be redone when the missing data is eventually provided.
01
Hazard scenario register with defined release locations, release rates, fluid compositions, and atmospheric stability classes for each assessed area
02
Wind rose data specific to the installation site covering at minimum 12 months of recorded meteorological observations
03
SIL targets assigned to each F&G safety instrumented function through documented LOPA or equivalent risk assessment
04
Three-dimensional equipment layout model with obstruction geometry accurate enough for line-of-sight and dispersion modeling
05
Detector technology failure rate data from vendor or industry database that matches the specific models planned for procurement
06
Defined spurious trip tolerance for each F&G function based on the operational consequence of an unnecessary shutdown or ESD activation
FREQUENTLY ASKED QUESTIONS
Questions Instrumentation Engineers Ask About Performance-Based F&G Design
How does performance-based design change the detector count compared to prescriptive spacing?
The detector count can go either direction depending on the facility. In congested process areas with multiple overlapping leak sources, performance-based design often reduces the total count by eliminating detectors that contribute negligible coverage in locations where obstructions block their line of sight or where adjacent detectors already provide verified overlap. In open areas with high-consequence scenarios, the analysis may identify coverage gaps that prescriptive spacing missed, requiring additional devices. The key difference is that every detector in a performance-based layout has a verified purpose tied to a specific scenario.
Book a demo to see how coverage analysis optimizes your detector count.
Can we apply performance-based methodology to an existing F&G system that was designed prescriptively?
Yes, and this is one of the most common use cases for the analysis. The existing detector layout is imported into the coverage mapping model, hazard scenarios are defined for the area, and the analysis quantifies exactly what percentage of each scenario the current layout actually covers. The output is a gap report showing where coverage falls below the target, allowing targeted detector additions or relocations rather than a full system replacement. This approach is particularly valuable for facilities preparing for a regulatory audit or a major hazard re-assessment.
Contact support to discuss retrofitting your existing layout.
How does wind rose data affect the coverage mapping results?
Wind direction and speed directly determine where a gas plume travels after release, which means the same detector layout will show different coverage fractions for different wind conditions. A performance-based analysis does not model a single wind direction but runs the coverage assessment across the full wind rose distribution, weighting each direction by its frequency of occurrence. The result is a probability-weighted coverage figure that accounts for the fact that some wind conditions are far more likely than others. Ignoring this distribution and designing for a single worst-case direction often over-detectors some areas and under-covers others.
Book a demo to see wind-weighted coverage analysis in action.
What role does ISA 84.00.07 play in a performance-based F&G design project?
ISA 84.00.07 provides the technical framework for performance-based design of fire and gas systems, including the methodology for defining coverage targets, conducting geographic mapping analysis, and linking detection performance to SIL requirements. While it is a technical report rather than a mandatory standard in most jurisdictions, regulators and auditors increasingly reference it as the expected basis for demonstrating that an F&G system meets its risk reduction requirement. Using ISA 84.00.07 methodology gives the design a defensible engineering basis that prescriptive approaches cannot provide.
Contact support to discuss ISA 84.00.07 compliance for your project.
How do we handle as-built deviations from the performance-based design model?
Any deviation from the analyzed detector layout, whether caused by construction clashes, cable routing constraints, or equipment relocations, must be captured and re-analyzed to verify that the coverage target is still met. In a performance-based design, moving a single detector can change the coverage fraction for multiple scenarios, so the re-analysis is not optional. iFactory maintains the design model as a living reference where as-built changes are logged and the coverage impact is calculated automatically, producing an updated verification record that stays current with the physical installation.
Book a demo to see how as-built management works in the platform.
Stop Submitting Plot Plans as Proof of Coverage — Start Submitting Verified Detection Models
iFactory gives your instrumentation and process safety teams a performance-based F&G design model where detector placement, coverage mapping, voting logic, and SIL verification are connected into one defensible package. Book a demo to see your F&G layout analyzed against your actual hazard scenarios.