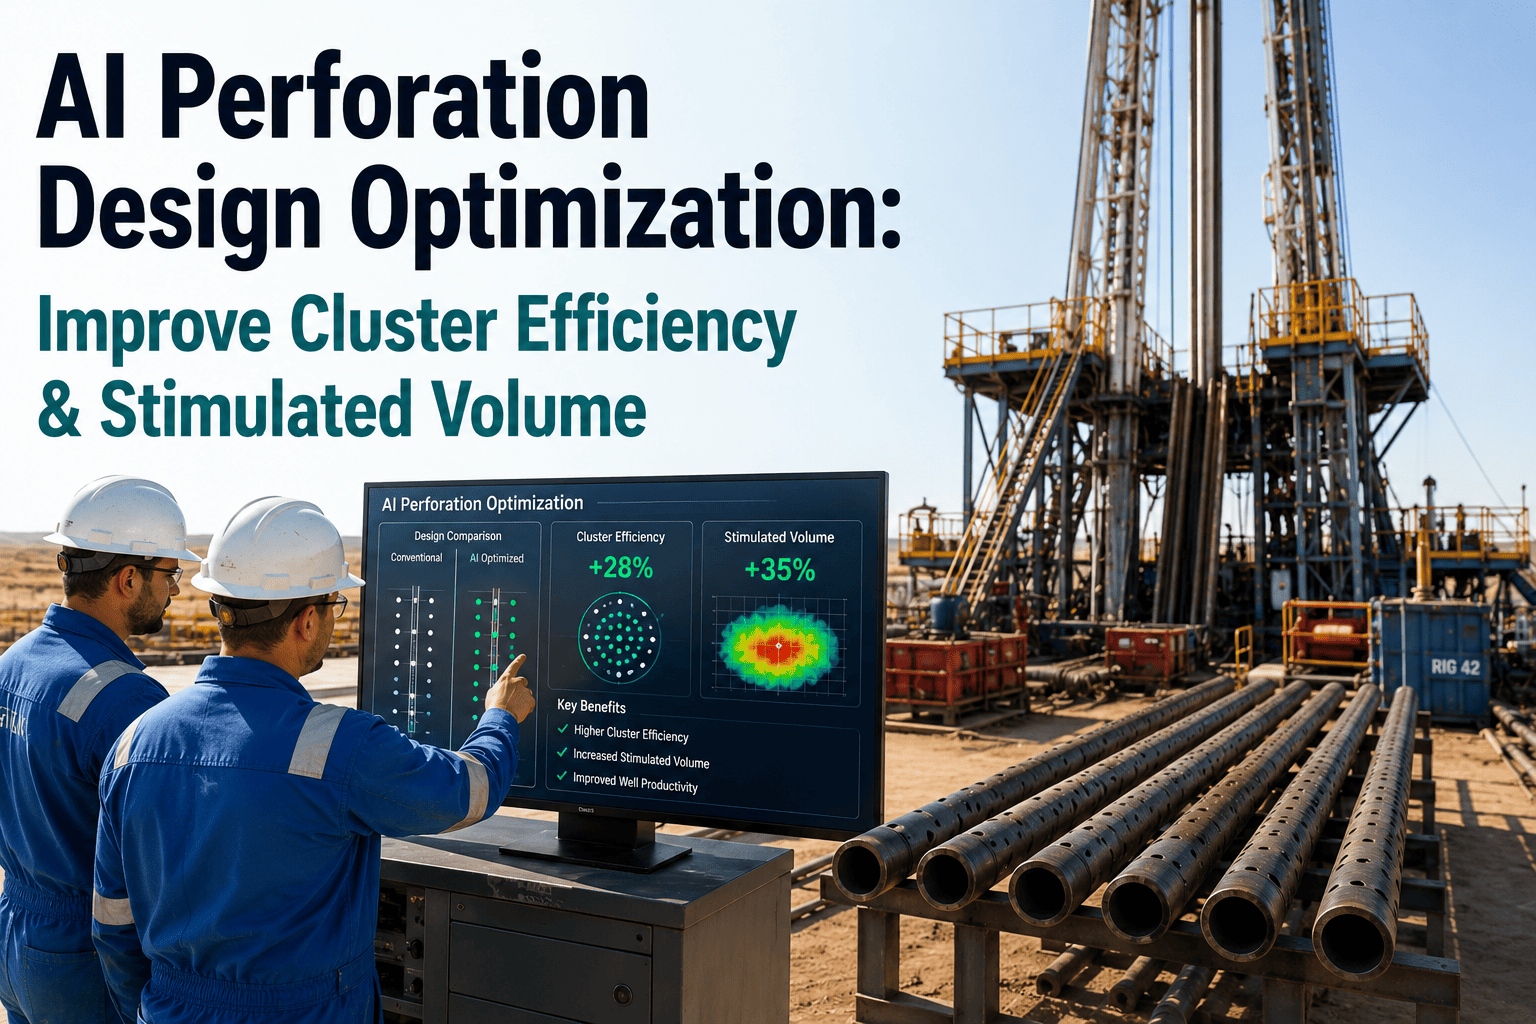
AI Perforation Design Optimization: Improve Cluster Efficiency & Stimulated Volume

By Johnson on September 2, 2026

ai-perforation-design-cluster-efficiency-optimization

A completion engineer designs a perforation plan with even cluster spacing, uniform phasing, and a limited entry pressure calculation that looks correct on paper, and then the well comes online producing from a fraction of the clusters that were actually perforated. The frac treatment went in as planned, the pumping data looked normal, and nothing in the surface record explained why some clusters took most of the fluid and proppant while others took almost none. The answer usually sits in near-wellbore stress variation the original design never accounted for, and it only becomes visible once fiber optic data from the completed well is compared back against the plan. You can see how that comparison gets built into the design process itself by choosing to book a demo with our team.

COMPLETIONS AI · PERFORATION DESIGN · CLUSTER EFFICIENCY

Half Your Perforation Clusters May Not Be Contributing to Production, and Standard Design Won't Tell You Which Half

Even spacing and uniform phasing assume every cluster along a lateral sees the same stress environment, but near-wellbore stress shadowing and heterogeneous rock properties routinely mean some clusters dominate fluid uptake while others barely open. iFactory uses DTS and DAS fiber optic data from completed wells to measure actual cluster efficiency and feed it back into the next design.

THE GAP BETWEEN DESIGN AND WHAT ACTUALLY HAPPENS DOWNHOLE

Limited Entry Design Assumes Uniformity the Rock Rarely Provides

Limited entry perforation design calculates the number and size of perforations per cluster needed to force roughly even fluid distribution across all clusters in a stage, based on a target pressure drop across the perforations relative to the fracture propagation pressure. The math behind that calculation is sound, but it depends on an assumption that stress and rock properties are reasonably uniform along the lateral, which is frequently not the case in heterogeneous unconventional reservoirs.

Near-wellbore stress shadowing between adjacent clusters, natural fracture networks, and lithology changes across even a single stage can all cause fluid to preferentially enter a subset of clusters regardless of how carefully the limited entry pressure was calculated. A design that looks perfectly balanced in the completion plan can still produce a stage where three of six clusters absorb most of the treatment, leaving the reservoir volume around the other three essentially unstimulated.

30-50%
Range of cluster efficiency commonly measured by fiber diagnostics on stages designed with uniform spacing assumptions
±0.5 PSI
Typical DTS temperature resolution used to detect fluid entry differences between adjacent perforation clusters
1-2 FT
Spatial resolution achievable with distributed acoustic sensing for identifying individual cluster contribution
READING THE FIBER DATA

What DTS and DAS Actually Show About Cluster Performance

Distributed temperature sensing and distributed acoustic sensing measure different physical signals but both reveal the same underlying reality: which clusters are actually taking fluid during the treatment and which are effectively bypassed. Reading them correctly, and reading them together rather than in isolation, is what turns raw fiber data into a design correction.

DISTRIBUTED TEMPERATURE SENSING (DTS)
Measures temperature change along the fiber as cooler frac fluid enters the formation at active clusters, creating a visible temperature signature at each fluid entry point. Clusters with no measurable temperature deviation are strong candidates for near-zero fluid uptake during the stage.
DISTRIBUTED ACOUSTIC SENSING (DAS)
Captures acoustic energy generated by fluid moving through active perforations, providing a higher-resolution, real-time view of relative flow rate differences between clusters as the treatment progresses stage by stage.

See What Your Fiber Data Is Already Telling You About Cluster Efficiency

iFactory turns raw DTS/DAS traces into cluster-by-cluster efficiency scores you can compare directly against the original design.

FROM DIAGNOSTIC TO DESIGN INPUT

Closing the Loop From Completed Well Back to Next Design

Fiber diagnostics have existed for years, but the value most operators actually capture from them stops at a post-job report showing which clusters underperformed on the well that was just completed. The design used on the next well in the pad is rarely adjusted systematically based on that data, because turning a fiber trace into a specific perforation density, phasing, or limited entry pressure change requires a modeling step most completion teams do not have time to run manually on every well.

1
Capture Fiber Data During the Treatment
DTS and DAS signals are logged continuously as each stage is pumped, generating a cluster-level fluid entry record for the entire lateral.
2
Score Cluster Efficiency Against Design Intent
Each cluster's measured contribution is compared against the uniform-distribution assumption the original limited entry design was built on.
3
Correlate Underperformance to Stress and Rock Property Trends
Underperforming clusters are cross-referenced against known stress shadowing patterns and any available lithology or geomechanical logs along the lateral.
4
Adjust Spacing, Phasing, or Limited Entry Pressure for the Next Well
Cluster spacing, phasing angle, or perforation density is recalculated for offset wells in the same pad based on the measured efficiency pattern rather than a repeated uniform assumption.
DESIGN APPROACH COMPARISON

Uniform Design Versus Fiber-Informed Design

Design Approach Uniform Limited Entry Design Fiber-Informed AI Design
Cluster Spacing Basis Even spacing assuming uniform stress environment Spacing adjusted for measured stress shadowing pattern from offset wells
Phasing Selection Fixed phasing angle applied across all stages Phasing correlated to cluster efficiency results by lithology zone
Limited Entry Pressure Calculated once from average rock property assumptions Recalculated per stage against zone-specific rock property estimates
Feedback From Completed Wells Post-job report reviewed manually, rarely changes next design systematically Cluster efficiency data feeds directly into offset well design parameters
COMMON MISTAKES

Where Cluster Efficiency Programs Lose Value

Running Fiber Diagnostics Without a Feedback Loop
Collecting DTS/DAS data on every well but never systematically feeding the results back into the design for the next well captures the diagnostic cost without capturing the design improvement.
Treating One Well's Pattern as the Whole Pad's Pattern
Stress shadowing and rock property variation can differ meaningfully even between adjacent laterals on the same pad, so a single well's cluster efficiency data should inform, not dictate, the next well's design.
Ignoring Phasing When Only Adjusting Spacing
Cluster underperformance is sometimes driven more by phasing angle relative to the local stress orientation than by spacing alone, and a design correction that only touches spacing can miss the actual cause.
Comparing DTS and DAS Signals in Isolation
DTS and DAS each have blind spots, and design changes based on only one signal type carry more uncertainty than corrections built from both data sources together.
BEYOND THE NEXT WELL'S DESIGN

Cluster Efficiency Data Also Informs Refrac Candidate Selection

The same cluster-level contribution data used to correct the next offset well's perforation plan is also one of the more reliable inputs for identifying refrac candidates on older wells in the same field. A well where fiber data or production logs suggest a large fraction of original clusters never contributed meaningfully to flow is a fundamentally different refrac case than a well where all clusters were efficient but the reservoir has simply depleted, and the two cases call for very different treatment designs.

Building a field-level library of cluster efficiency patterns by lithology zone, rather than treating each well's diagnostic data as a one-off report, is what makes this distinction possible at scale. Over time this library becomes as useful for refrac economics as it is for original completion design, since it lets an engineer estimate incremental recovery potential before committing capital to a re-stimulation program.

WHO ACTS ON THE FIBER DATA

Cluster Efficiency Insight Crosses Three Roles on the Completions Team

Completion Engineer
Owns the perforation design itself and translates cluster efficiency scores into specific spacing, phasing, and limited entry pressure changes for the next well.
Geomechanics/Geoscience Team
Correlates underperforming clusters against stress and lithology models, refining the geomechanical picture the design team draws on for future laterals.
Reservoir Engineer
Uses cluster efficiency history alongside production data to evaluate refrac candidates and estimate incremental recovery from a re-stimulation program.
FREQUENTLY ASKED QUESTIONS

Questions Completion Engineers Ask About Cluster Efficiency Optimization

Do we need to run fiber on every well to benefit from this?
No, fiber diagnostics on a representative subset of wells in a pad or formation is often enough to establish a reliable stress and cluster efficiency pattern that can inform design across the rest of the program. Running fiber on every well adds diagnostic value but is not a strict requirement to start capturing design improvements. Book a demo to discuss a fiber deployment plan sized to your pad.
How is cluster efficiency actually quantified from the fiber trace?
Temperature deviation magnitude and duration from DTS, combined with relative acoustic energy from DAS at each cluster location, are converted into a normalized contribution score per cluster, expressed as a percentage of the stage's total fluid uptake attributable to that cluster. This scoring approach allows direct, apples-to-apples comparison across stages and across wells.
Can this data improve proppant placement, not just fluid distribution?
Yes, clusters identified as underperforming on fluid entry are also the clusters least likely to have received adequate proppant placement, since proppant transport follows fluid distribution. Correcting the design for fluid distribution directly addresses the proppant placement gap as well. Contact our support team to see how proppant placement estimates are derived from cluster efficiency scoring.
How much can perforation design realistically change between wells on the same pad?
Adjustments are typically incremental, spacing shifts of a few feet, phasing angle changes, or limited entry pressure recalculation for specific lithology zones, rather than a wholesale redesign, since the underlying formation is broadly similar between adjacent laterals. The value comes from correcting the specific stress-shadowed intervals the fiber data identifies.
Does this approach require a specific fiber vendor or installation method?
The methodology works with standard permanently installed or wireline-deployed DTS/DAS fiber systems from any major diagnostic services provider, since the analysis is built on the trace data itself rather than any proprietary hardware requirement. Book a demo to confirm compatibility with your current fiber diagnostics vendor.

Stop Designing the Next Well on the Same Uniform Assumptions

iFactory turns fiber diagnostics from a post-job report into a systematic input for every offset well's perforation design.

Share This Story, Choose Your Platform!