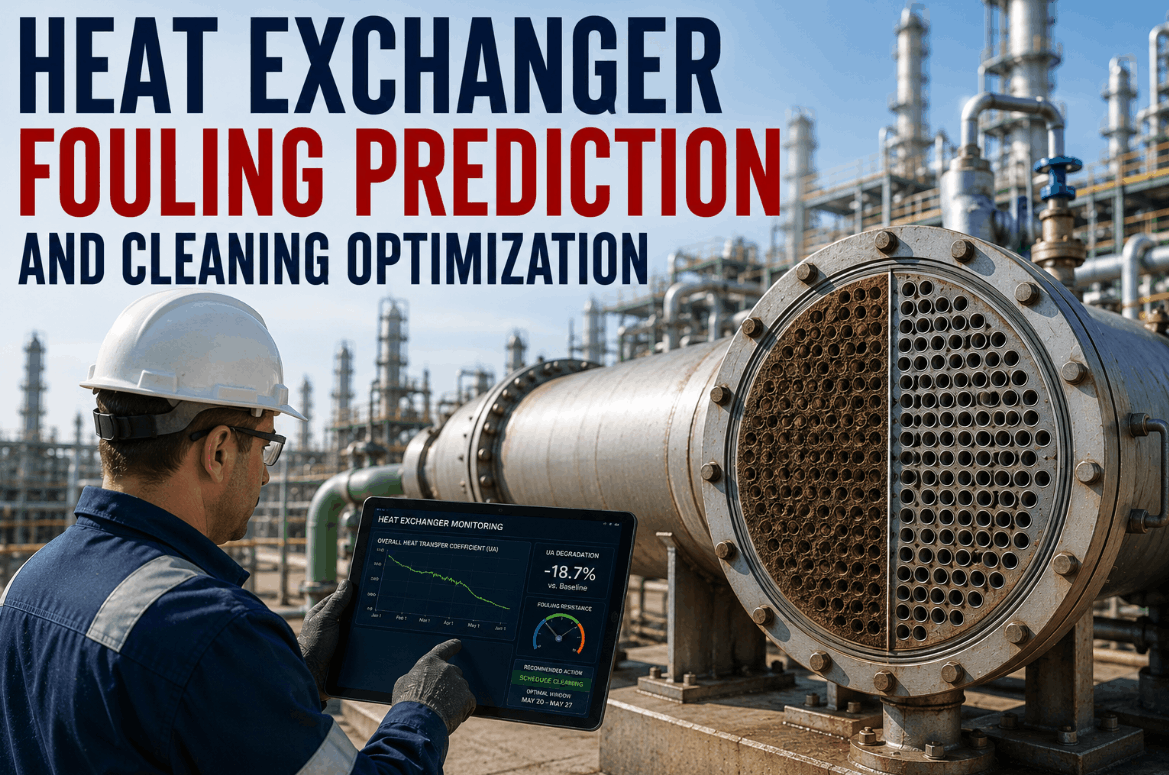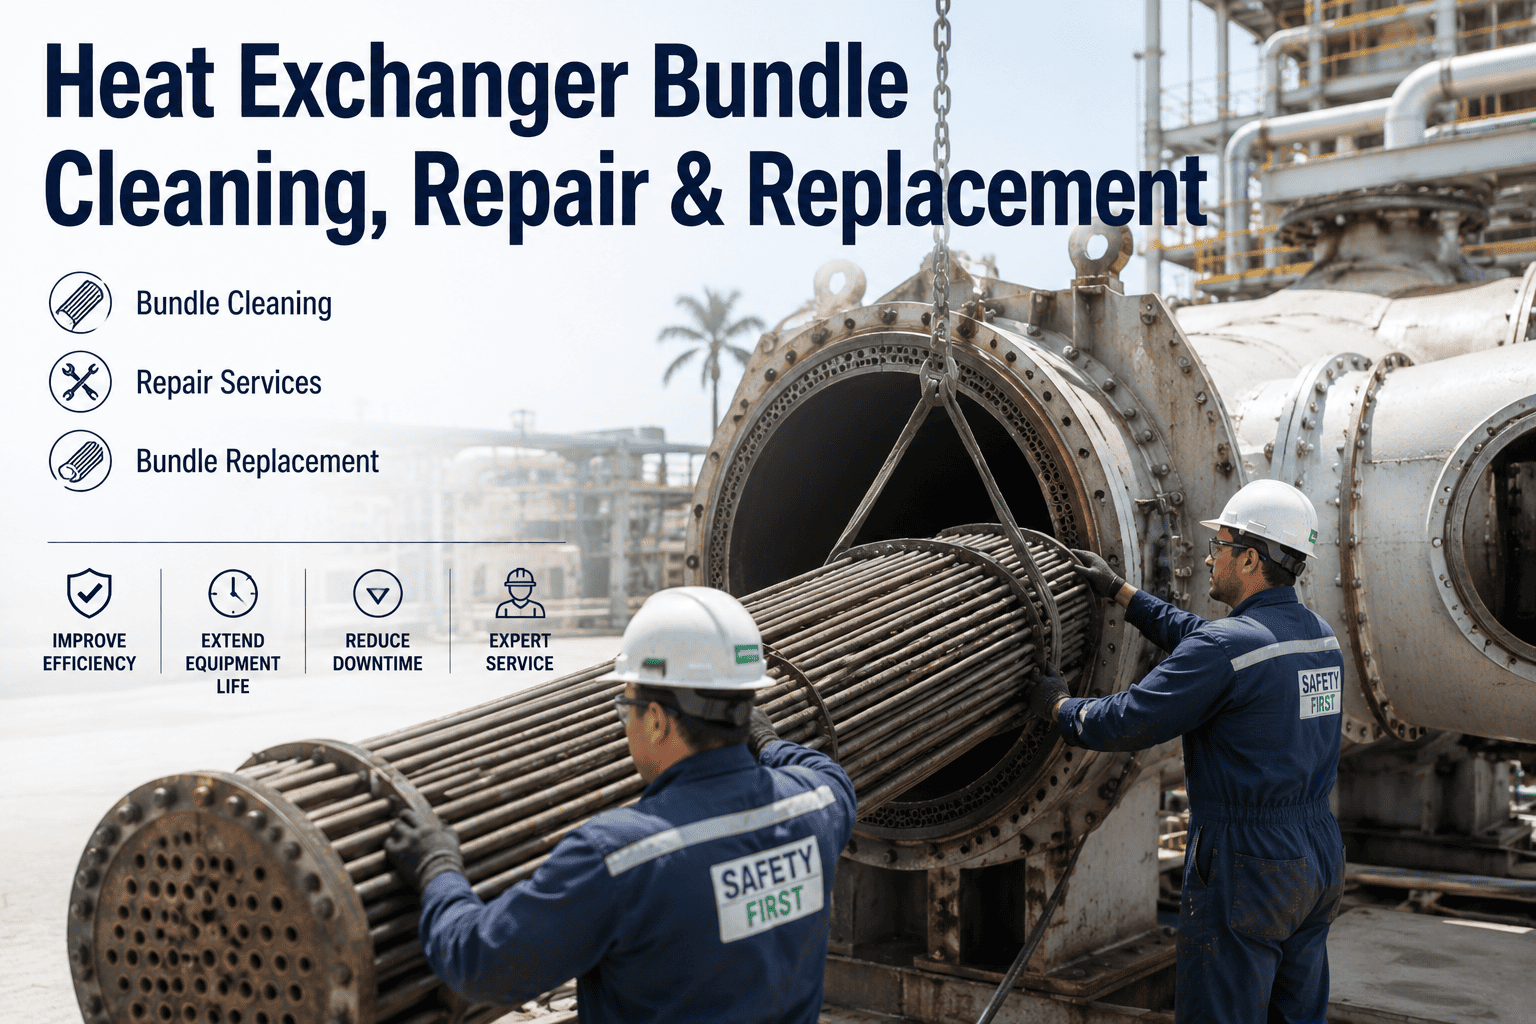
Heat exchanger bundles represent one of the highest-value asset populations in any oil and gas facility — a single shell-and-tube exchanger in refinery service can contain thousands of tubes whose individual and collective condition directly determines process efficiency, energy consumption, and turnaround scheduling. When fouling accumulates or tube failures begin, operators face a cascading decision sequence that starts with cleaning, progresses through inspection and repair, and ultimately reaches bundle replacement when the economics of continued repair no longer justify the operational risk. The speed and accuracy of decisions at each stage of this lifecycle directly affects facility uptime and maintenance capital expenditure. To see how iFactory manages the complete bundle lifecycle digitally, book a demo with our team.
The Financial Impact of Heat Exchanger Bundle Degradation
Fouling and tube degradation in heat exchanger bundles create costs that compound across multiple dimensions — lost heat transfer efficiency increases energy consumption, unplanned leaks force emergency shutdowns, and deferred maintenance accelerates tube failure rates in a cycle that becomes progressively more expensive the longer it continues. The following data quantifies the primary cost drivers that make structured bundle lifecycle management one of the highest-ROI reliability investments available in oil and gas operations.
Bundle Lifecycle Management — Four Stages from Clean to Replace
Every heat exchanger bundle in oil and gas service progresses through a predictable lifecycle that begins with cleaning to restore performance, moves through inspection to assess tube condition, proceeds to repair when individual tube failures can be managed, and ends with replacement when the bundle no longer supports safe and economic operation. The speed and quality of decision-making at each stage transition determines whether the facility minimizes total lifecycle cost or incurs unnecessary capital expenditure through delayed decisions or premature replacement.
Bundle Cleaning Methods — Selecting the Right Approach for Each Fouling Type
Selecting the incorrect cleaning method for the fouling type present on a heat exchanger bundle can result in incomplete deposit removal, extended cleaning duration, tube damage, or unnecessary cost. The three primary cleaning methods each have distinct capabilities and limitations that make them suitable for specific fouling mechanisms. The following comparison provides the decision parameters needed to select the correct cleaning method for each bundle based on the fouling type identified during initial assessment.
Tube Failure Identification — Detection Method, Cause, and Resolution
Accurate identification of the tube failure mechanism is essential for selecting the correct repair approach and preventing recurrence. Different failure mechanisms produce distinct damage patterns that trained inspectors can identify through the appropriate combination of non-destructive testing methods. The following six failure modes represent the most frequently encountered tube degradation mechanisms in oil and gas heat exchanger service, each requiring a specific inspection approach and corrective action strategy.
Repair vs Replace Decision Framework for Heat Exchanger Bundles
The repair-versus-replace decision is the highest-value decision point in bundle lifecycle management — choosing repair when replacement is warranted results in repeated failures and escalating costs, while choosing replacement when repair is sufficient wastes capital that could be deferred. The following decision framework uses tube plugging percentage as the primary screening criterion, with additional factors that modify the decision based on bundle age, material condition, and future service requirements. For a guided walkthrough of how iFactory automates this decision analysis, book a demo with our reliability engineering team.
Bundle Performance Impact Across Lifecycle Interventions
The following benchmark data quantifies the performance recovery and cost implications of each lifecycle intervention stage. This comparison enables reliability engineers and maintenance planners to estimate the operational benefit and financial investment required at each decision point, supporting evidence-based repair-versus-replace analysis. The data reflects aggregated performance from shell-and-tube heat exchangers in refinery and gas plant service across multiple operating companies.
| Performance Metric | Fouled Condition | After Cleaning | After Repair | After Replacement |
|---|---|---|---|---|
| Heat Transfer Coefficient | 40-60% of design value | 85-95% of design value | 90-100% of design value | 100% of design value |
| Shell-Side Pressure Drop | 150-250% of design value | 100-120% of design value | 100-110% of design value | 100% of design value |
| Tube Pass Rate (Inspection) | 70-85% of tubes passing | 70-85% unchanged by cleaning | 85-98% after plugging and repair | 100% all new tubes |
| Expected Service to Next Intervention | Immediate action required | 6 to 18 months | 2 to 4 years | 8 to 15 years |
| Relative Cost (vs Cleaning Baseline) | Baseline energy and throughput loss | 1x (cleaning execution cost) | 3 to 8x cleaning cost | 15 to 40x cleaning cost |
| Downtime Duration (Typical) | N/A — operating in degraded state | 2 to 5 days out of service | 5 to 15 days out of service | 15 to 45 days including procurement |
| Leak Risk Post-Intervention | High — active tube failures likely | Unchanged — tube condition not addressed | Low — failed tubes isolated by plugging | Minimal — all tubes new with full integrity |
| Material Upgrade Opportunity | No | No | Limited — only retubed sections | Yes — full material and design optimization |