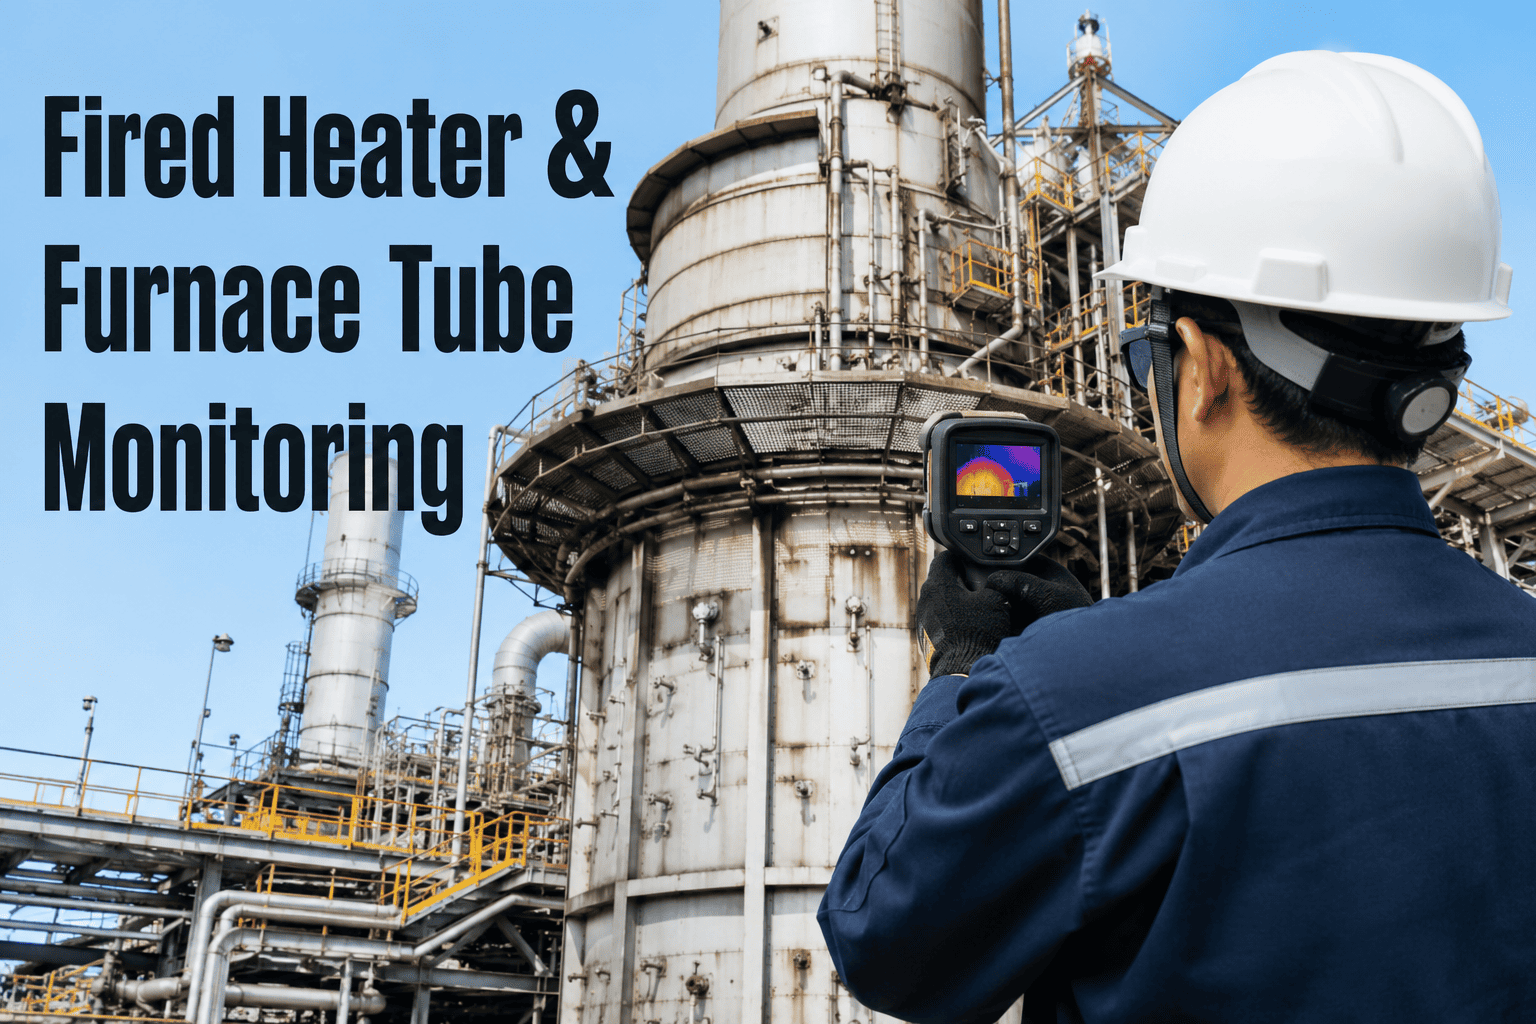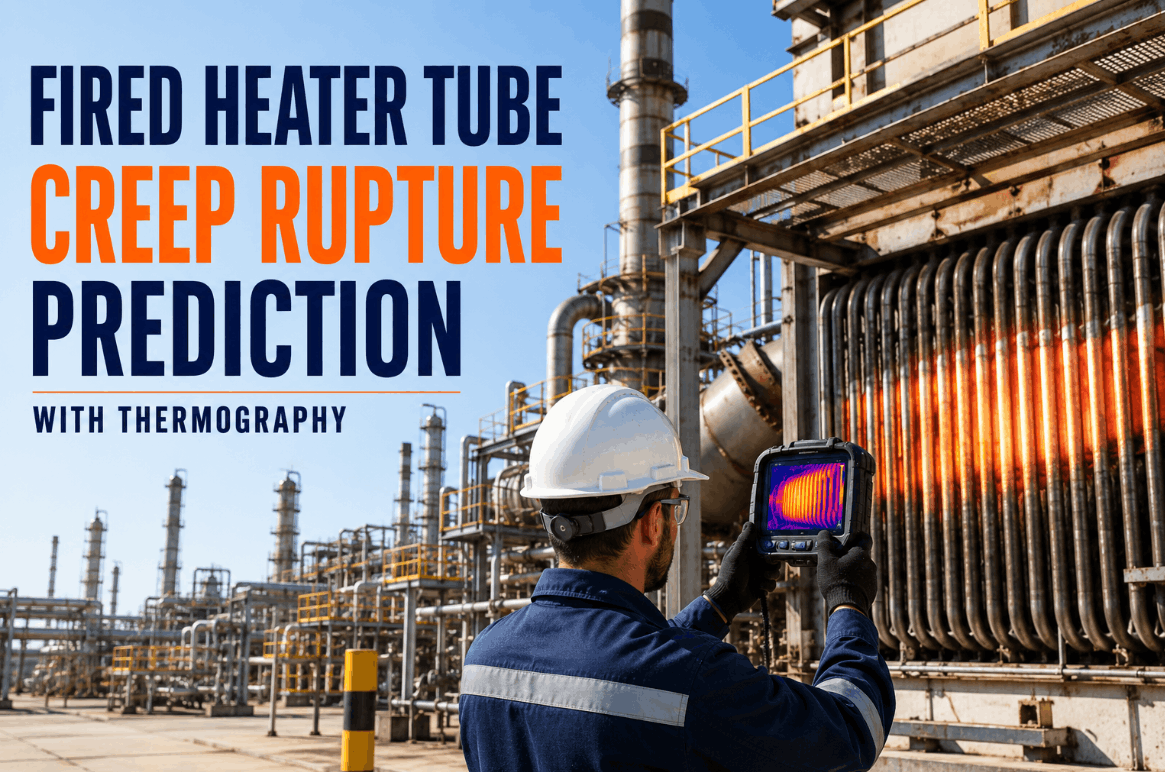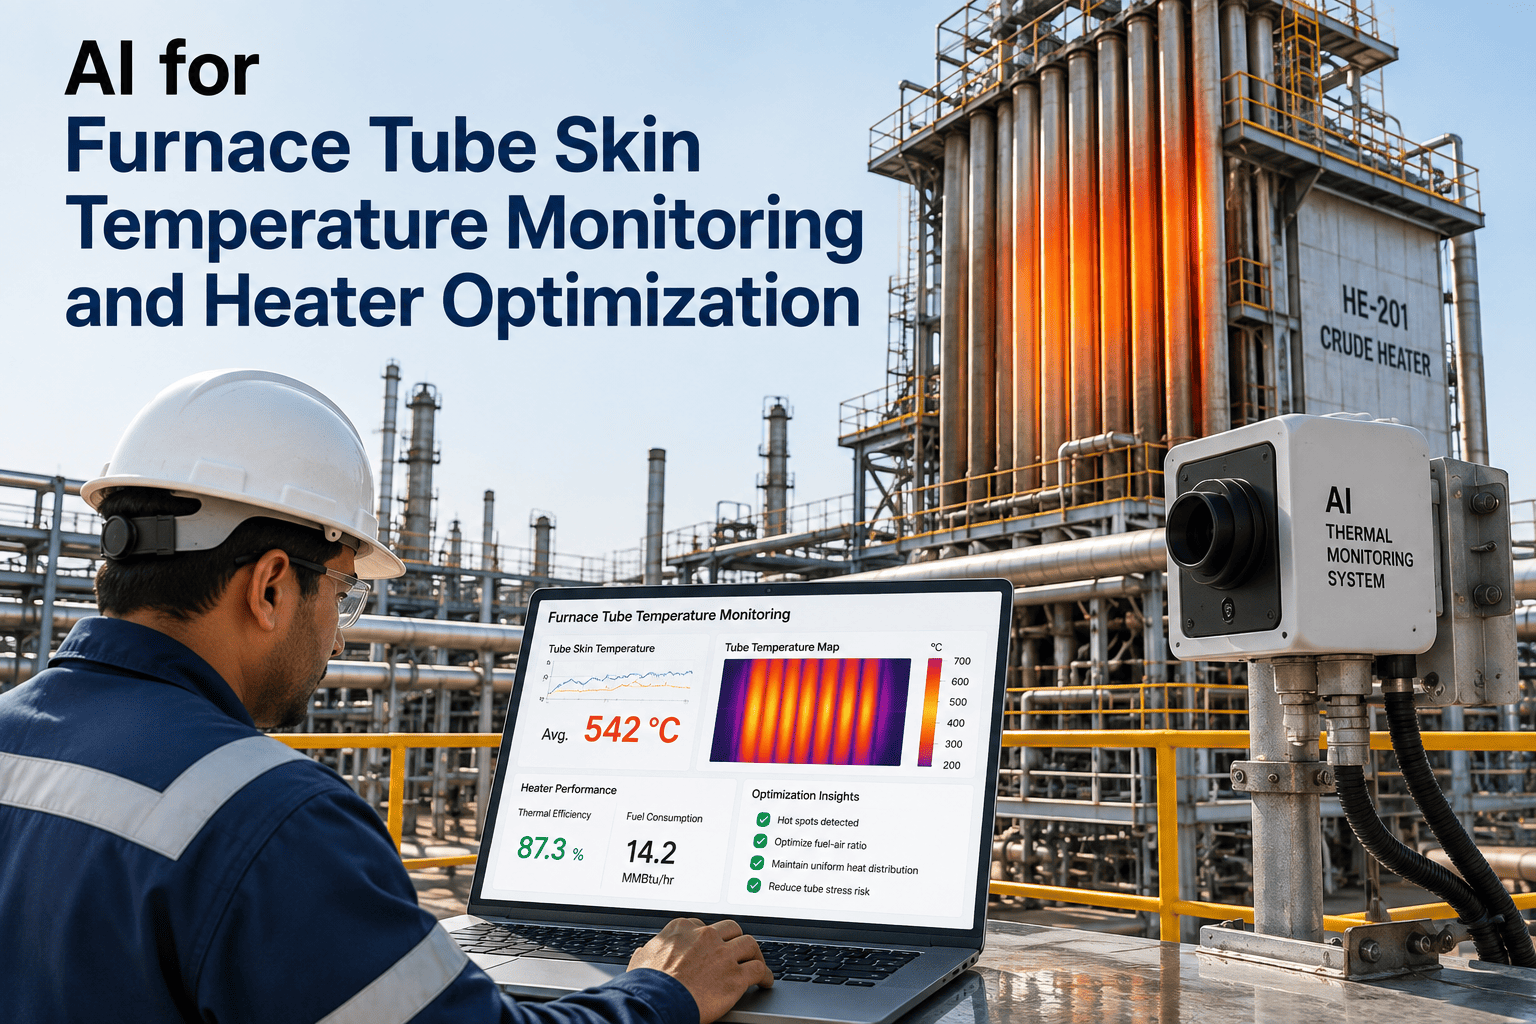
A fired heater tube rarely fails without warning. It fails after months of a hot spot that nobody was watching closely enough, slowly creeping past the metal's design temperature until the tube either ruptures or gets pulled for emergency replacement mid-run. Manual infrared gun readings taken once or twice a shift catch only a snapshot of that progression, and the hottest moment on a given tube can easily fall between two rounds. iFactory's continuous thermal monitoring platform watches every tube in the radiant section around the clock, and a short demo can show what that coverage looks like against your own heater's tube layout.
Catch a Failing Furnace Tube Before It Becomes an Unplanned Outage
Tube skin temperature is the earliest visible sign of coking, flame impingement, and metallurgical creep. Continuous AI thermal monitoring turns that signal into weeks of warning instead of a shutdown nobody saw coming.
The Metal's Surface Temperature Tells the Story Long Before a Failure Happens
Every radiant tube in a fired heater is designed to operate within a metallurgical temperature limit specific to its alloy. Once internal coking builds up, the insulating layer of coke forces heat to accumulate at the tube wall instead of transferring into the process fluid, and that same section of tube starts running hotter than its neighbors even though the burner and process conditions have not changed.
A single elevated reading is easy to miss during a manual round, especially on heaters with hundreds of individual tube spans across multiple passes. Continuous monitoring turns a scattered set of spot checks into a full thermal map that updates constantly, catching a developing hot spot exactly when it starts to diverge from its normal operating range.
Four Stages Between a Healthy Tube and an Emergency Shutdown
A tube failure is rarely sudden from the metal's perspective, even though it often feels sudden to the operations team. Watching where a tube sits in this progression is what makes early intervention possible.
How Continuous Thermal Monitoring Differs From Manual and Fixed-Point Methods
Most heaters already have some form of tube temperature monitoring in place. The differences between methods come down to coverage, frequency, and how quickly a developing hot spot actually reaches someone who can act on it.
| Monitoring Method | Coverage and Frequency | Typical Detection Lag |
|---|---|---|
| Manual infrared gun readings | Spot checks on select tubes, once or twice per shift | Hours to days, depending on round frequency and tube selection |
| Fixed thermocouples | Continuous but limited to a small number of instrumented points | Minutes, but only for the specific tubes with a sensor installed |
| Periodic thermal imaging survey | Full radiant section coverage, but only during scheduled surveys | Days to weeks between surveys |
| Continuous AI thermal monitoring | Full radiant section, every tube, updated continuously | Minutes, with automatic trend alerting on early drift |
See a Full Thermal Map of a Heater in Real Production Conditions
iFactory can walk through a sample thermal map showing how a developing hot spot separates from normal tube temperature well before it becomes a safety concern.
Tube Monitoring and Combustion Efficiency Are Part of the Same Data Problem
The same continuous monitoring infrastructure that watches tube skin temperature can also track stack conditions and excess air ratios, since both depend on understanding how heat is actually distributed and lost across the firebox.
| Excess Air Level | Stack Loss Impact | Operating Consideration |
|---|---|---|
| Too low, under 10 percent | Incomplete combustion risk, carbon monoxide formation | Efficient but carries a safety and emissions risk margin |
| Optimal range, roughly 10 to 20 percent | Minimal stack loss while maintaining complete combustion | Target range for most fired heaters under stable load |
| Elevated, 20 to 35 percent | Noticeable fuel penalty from excess heated air lost up the stack | Common when burner tuning has drifted since last adjustment |
| High, above 35 percent | Significant fuel waste and reduced radiant efficiency | Usually signals a damper, burner, or draft control issue |
Five Furnace Conditions a Continuous Thermal View Catches Early
How Continuous Data Changes What Gets Inspected During a Turnaround
Turnaround inspection time is limited and expensive, and heaters are often inspected tube by tube regardless of which sections actually showed signs of stress during the run. A full operating history of tube temperatures lets the inspection plan focus on the tubes that need it most.
What Changed When One Refinery Added Continuous Tube Monitoring
Four Steps to Deploying Continuous Furnace Tube Monitoring
Common Questions About AI Furnace Tube Monitoring and Heater Optimization
Stop Finding Out About Hot Spots During a Manual Round
iFactory gives every tube in your radiant section continuous coverage, turning weeks of warning into a planned repair instead of an unplanned outage.