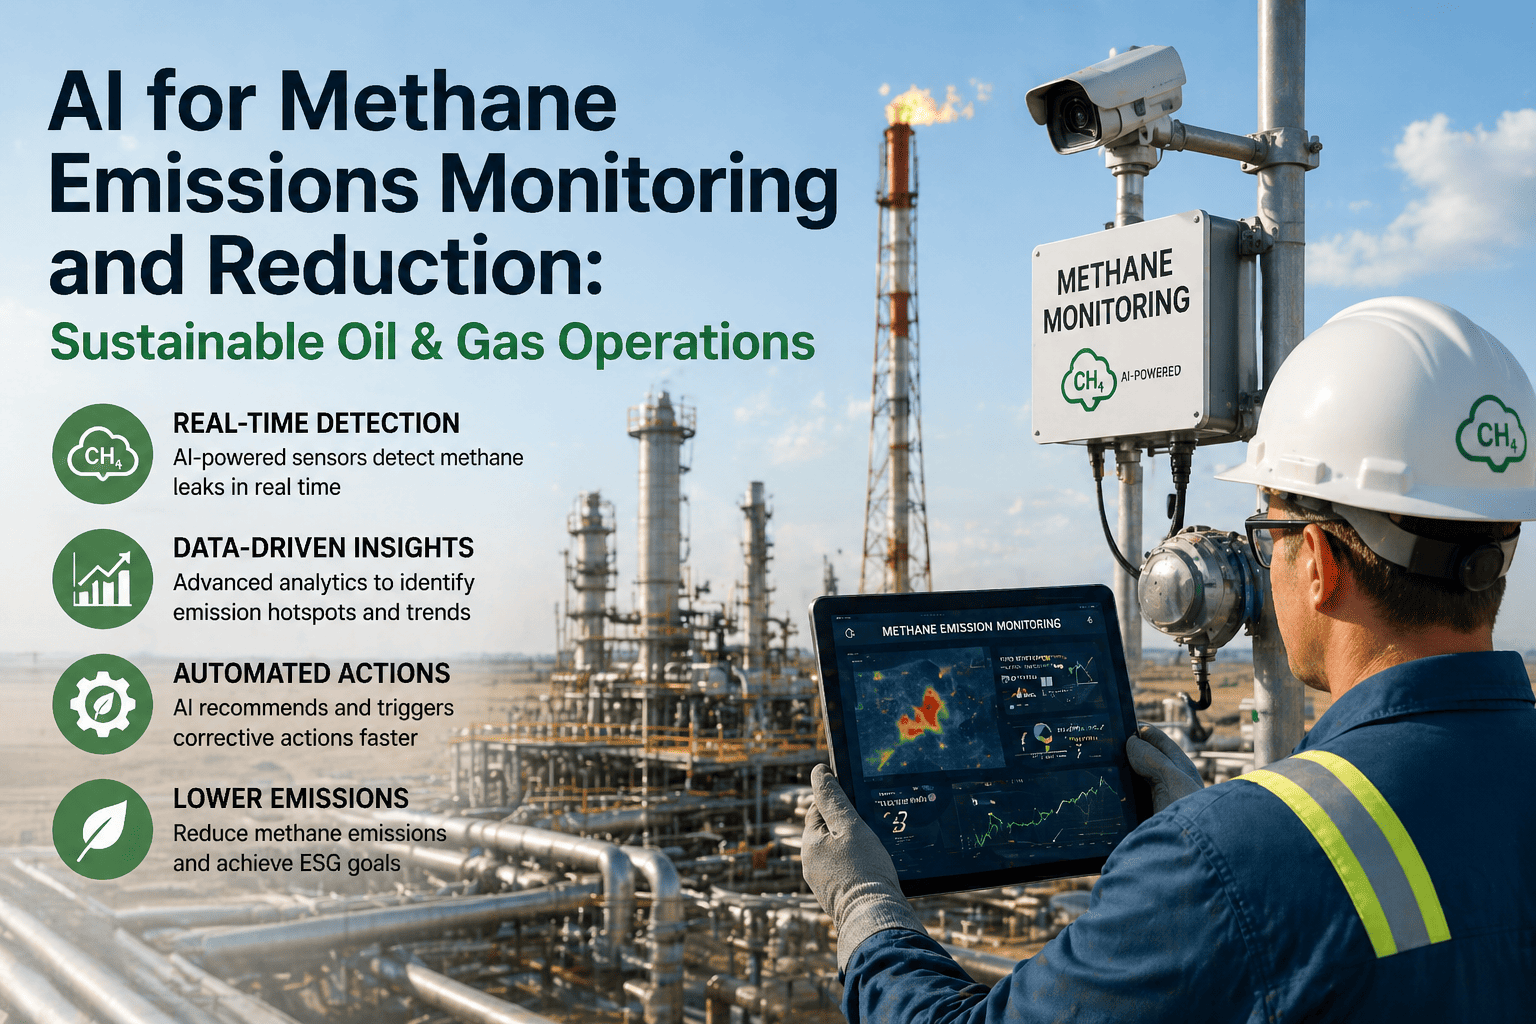
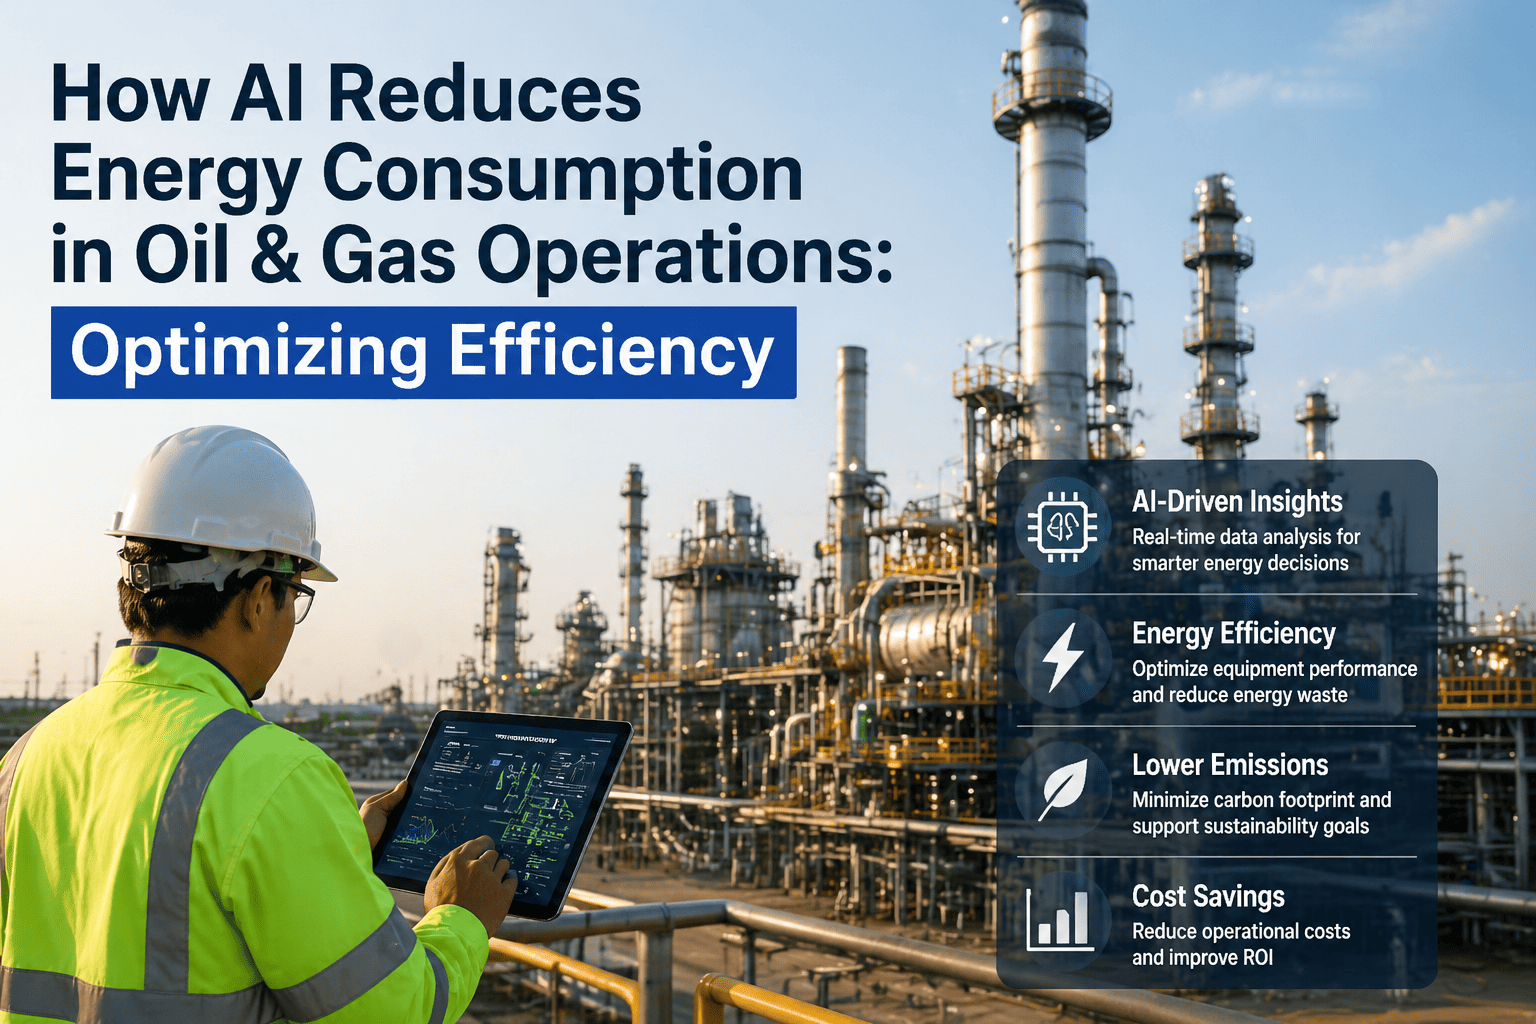
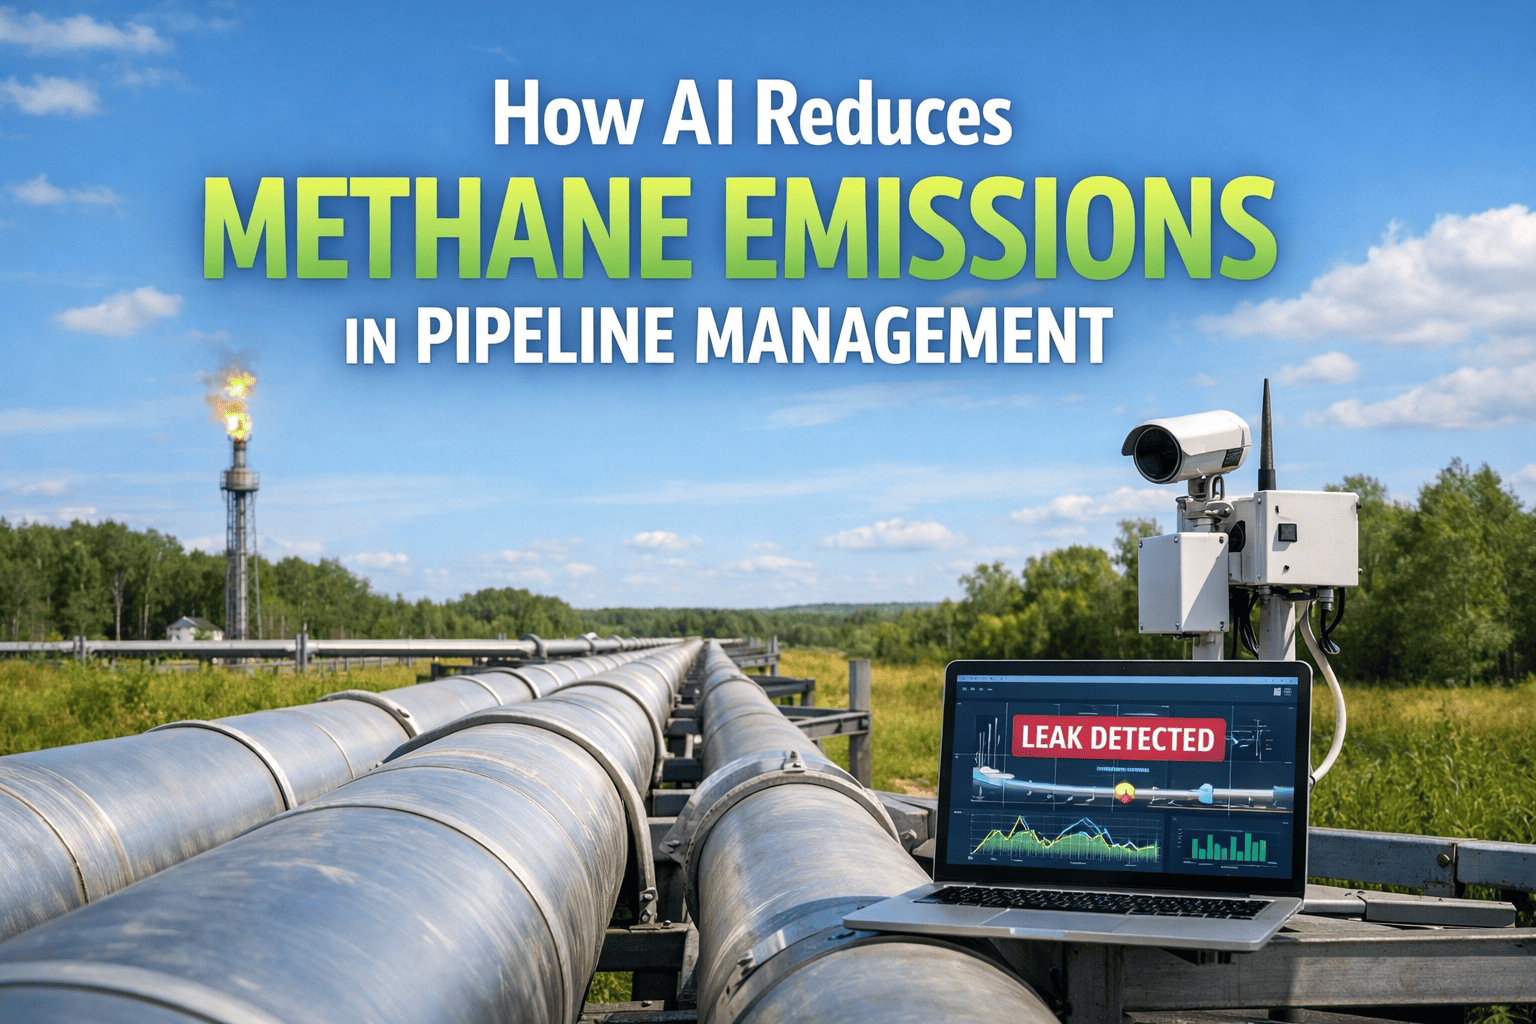
Oil and gas operations generate 2.8 billion tonnes CO2e annually, with 70-80% from Scope 1 direct emissions (equipment fuel consumption, methane leaks, flaring) and Scope 2 from purchased electricity in downstream operations. Upstream platforms, midstream pipelines, and downstream refineries lack real-time visibility into emissions drivers across thousands of equipment systems and process operations. Manual quarterly audits cannot detect equipment inefficiency or methane leaks fast enough to prevent cumulative emissions impact. By the time operators identify emissions sources through annual ESG reporting, millions of tonnes of preventable CO2e have been released. iFactory's AI-powered emissions platform monitors Scope 1 and Scope 2 sources in real time, detects equipment performance degradation that increases fuel consumption by 8-15%, predicts methane events 2-4 weeks ahead, optimizes process controls to reduce energy consumption by 12-28%, and automatically generates GHG Protocol-aligned ESG reporting. AI Eyes That Detect Leaks Before They Escalate. Methane, VOC & Flaring From Sensor to ESG Report. Book a Demo to see how iFactory reduces Scope 1 and Scope 2 emissions while improving operational efficiency.
Scope 1 & 2 Emissions Challenge in Oil & Gas
2.8B tons
Annual CO2e from oil & gas operations — 70-80% Scope 1 from direct fuel consumption and methane
$420M-$840M
Annual cost of preventable Scope 1 emissions per upstream platform from equipment inefficiency
45%
Emissions reduction target by 2030 to align with net-zero 2050 pathways — requires 3-5% annual improvement
12-28%
Energy consumption reduction achievable through AI optimization of equipment performance and process control
Quick Answer
Scope 1 emissions are direct emissions from operations (fuel consumption, methane leaks, flaring). Scope 2 emissions come from purchased electricity used in downstream refining. AI-powered monitoring detects both in real time, identifies equipment degradation causing fuel waste, predicts methane events before release, optimizes process controls to reduce energy consumption, and generates automated GHG Protocol reporting. Connects to Your Existing DCS/SCADA & Historians. One Platform, Every Segment: 8 AI-Powered Modules for Complete Oil & Gas Operations.
Scope 1 & 2 Emissions Sources in Oil & Gas
Scope 1 represents direct emissions from equipment operation and process releases. Scope 2 represents indirect emissions from purchased power. Most significant sources remain invisible until quarterly audits reveal cumulative impact. AI-Driven Integrity for Every Mile of Pipeline.
S1
Equipment Fuel Consumption & Inefficiency (Scope 1)
Compressors, pumps, heaters, and turbines consuming 8-15% excess fuel due to degradation, fouling, and suboptimal control. Undetected for weeks until monthly consumption reports reviewed. Single compressor at 88% vs 95% efficiency costs $420K annually in excess emissions.
S1
Methane Leaks & Venting Emissions (Scope 1)
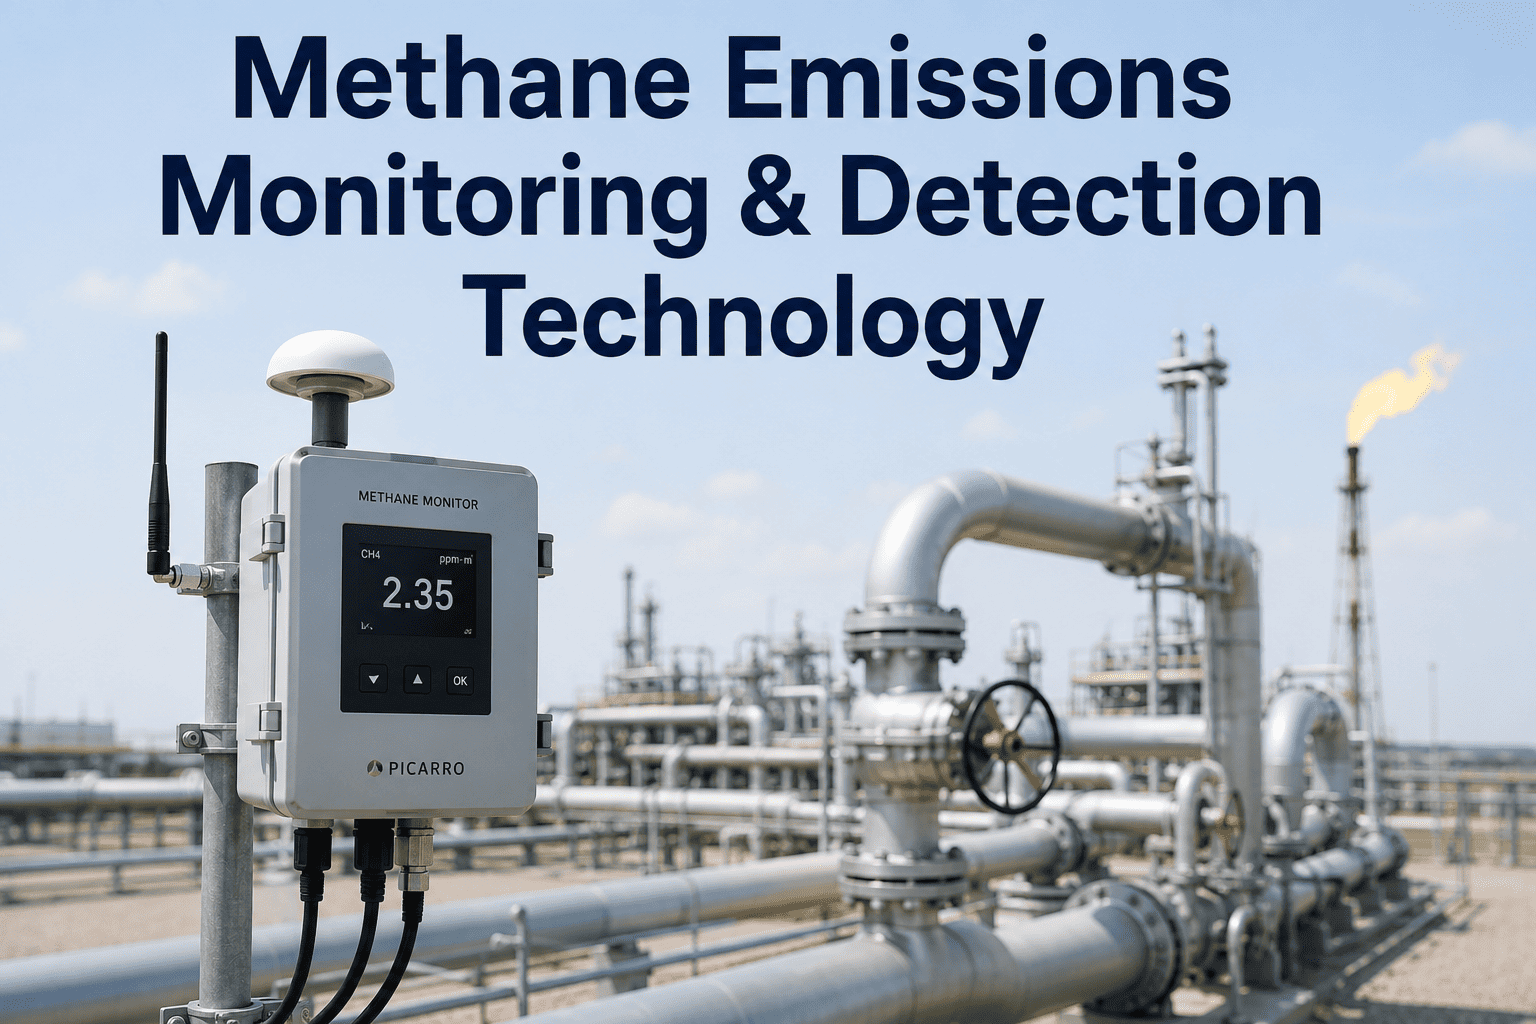
Upstream platforms and pipelines lose 1-5% of production to undetected methane leaks and venting. Small leaks escape quarterly audits. AI predicts leak risk 2-4 weeks ahead based on pressure and flow patterns — enabling preventive action before emissions occur.
S1
Flaring Losses & Fuel Wastage (Scope 1)
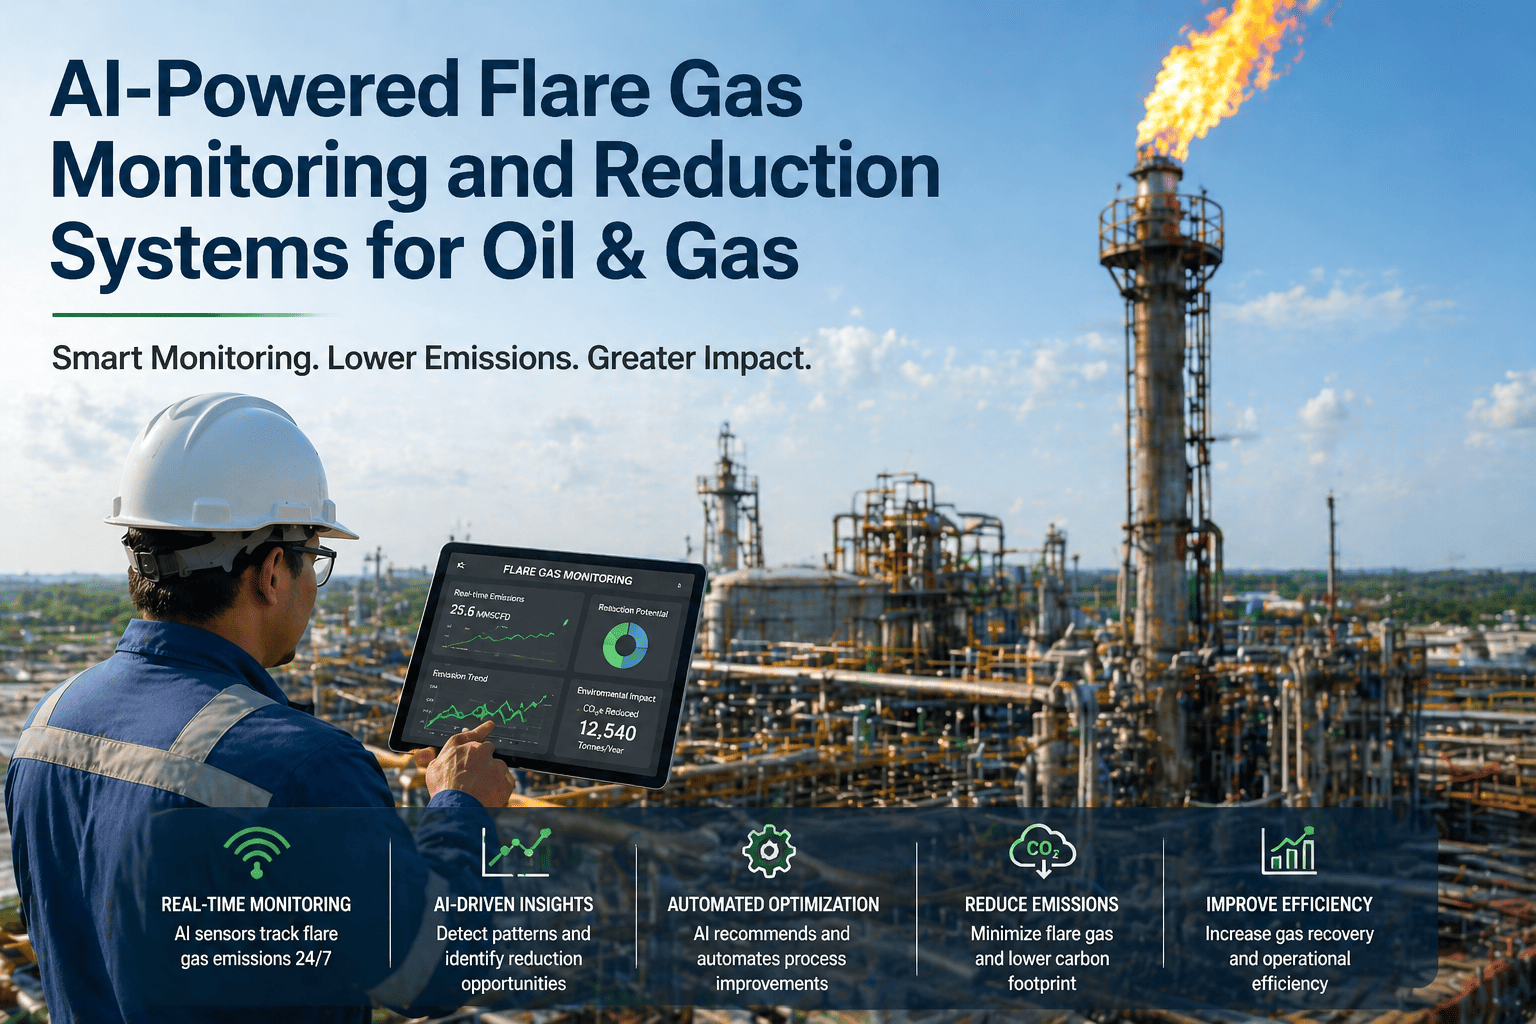
Upstream facilities flare 3-8% of production during upsets and maintenance. AI predicts upset conditions 15-30 minutes ahead, enabling preemptive pressure relief through modulation instead of flaring — simultaneously improving emissions and revenue.
S2
Purchased Electricity Consumption (Scope 2)
Downstream refineries and processing plants consume 8-12% excess electricity from pumping inefficiency, motor oversizing, and HVAC overcooling. Real-time monitoring and equipment optimization reduces Scope 2 by 15-20% without process disruption.
S1
Flue Gas & Process Emissions (Scope 1)
Refinery heaters and process furnaces generating CO2, NOx, and other emissions optimized through dynamic combustion control. Equipment performance monitoring enables preventive maintenance reducing emissions 5-8% annually.
How AI Detects & Reduces Scope Emissions
AI monitors equipment sensors across operations simultaneously, detects emissions patterns invisible to manual methods, and optimizes systems to reduce Scope 1 and Scope 2 in real time. Robots That Inspect Where Humans Cannot Safely Go. OT Data Stays Inside Your Security Perimeter.
01
Real-Time Scope Emissions Monitoring
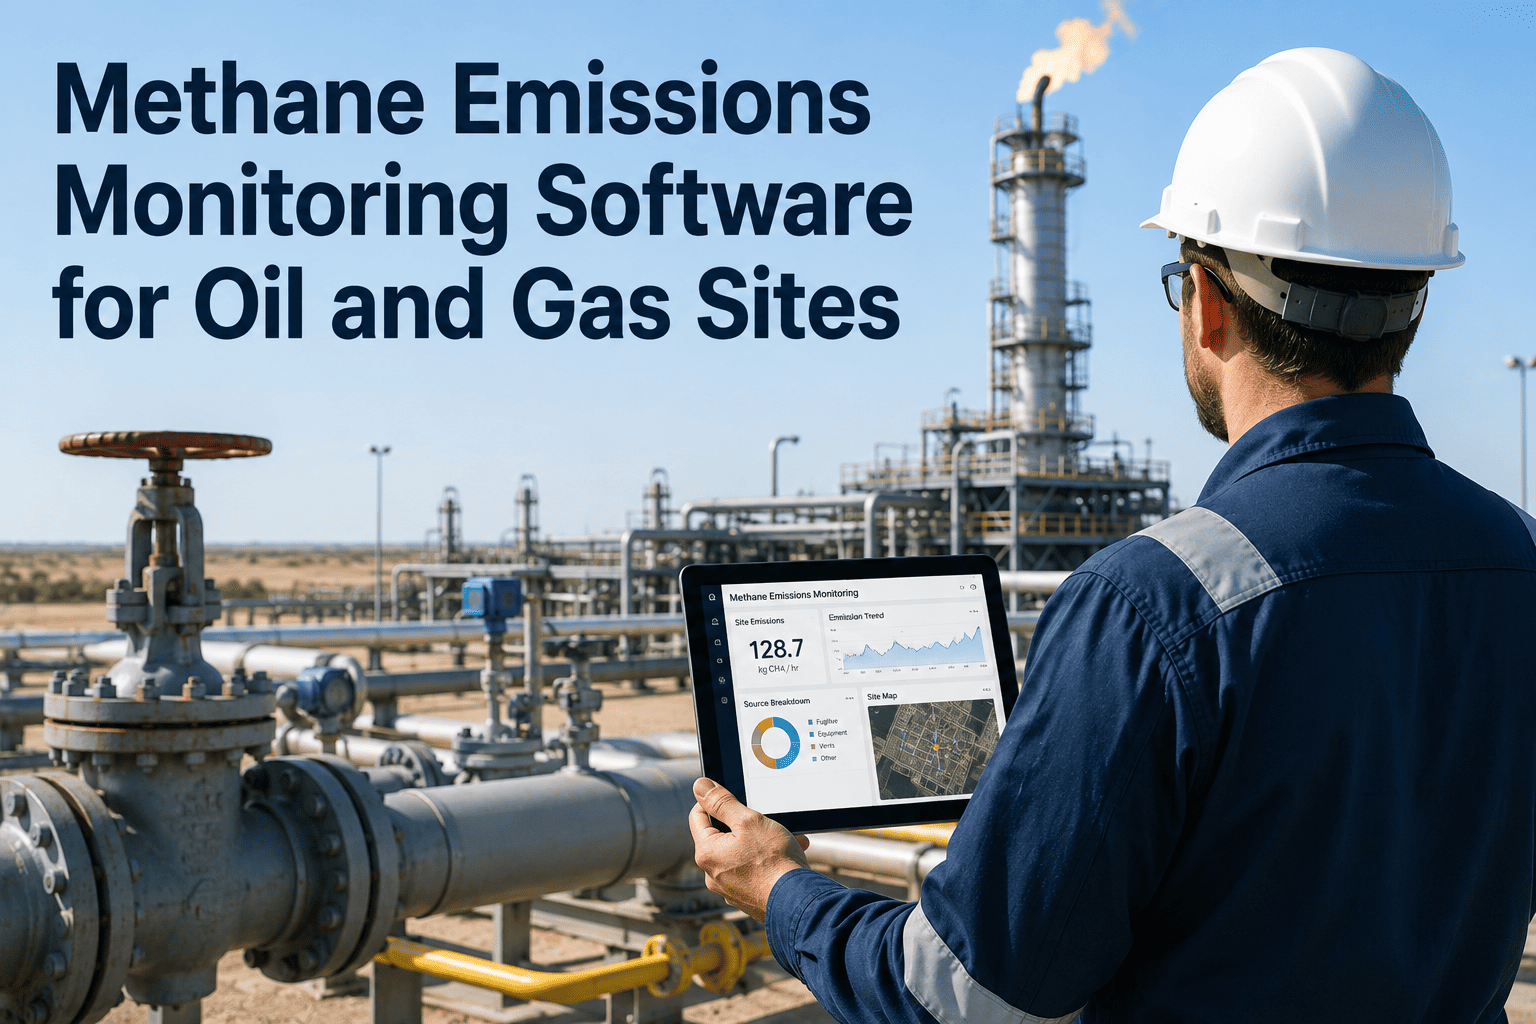
Continuous monitoring across Scope 1 equipment fuel consumption, methane emissions, flaring, and Scope 2 electricity consumption with real-time visibility into emissions drivers.
02
Equipment Efficiency Degradation Detection
ML models identify when equipment efficiency drops below baseline, quantify fuel consumption impact, and alert operators to maintenance needs before Scope 1 emissions escalate.
03
Methane Leak Prediction & Prevention
Predicts methane leak risk 2-4 weeks ahead based on pressure, temperature, and flow anomalies — enabling preventive action before Scope 1 emissions from leaks occur.
04
Process Control Optimization
Real-time optimization of equipment sequencing, heater duty, and pressure setpoints reduces Scope 1 fuel consumption 12-28% and Scope 2 electricity by 15-20% without production impact.
05
Flaring Prevention & Upset Prediction
Predicts upset conditions 15-30 minutes ahead, enabling preemptive pressure relief through modulation instead of flaring — preventing Scope 1 emissions and recovering revenue.
06
Automated GHG Protocol Reporting
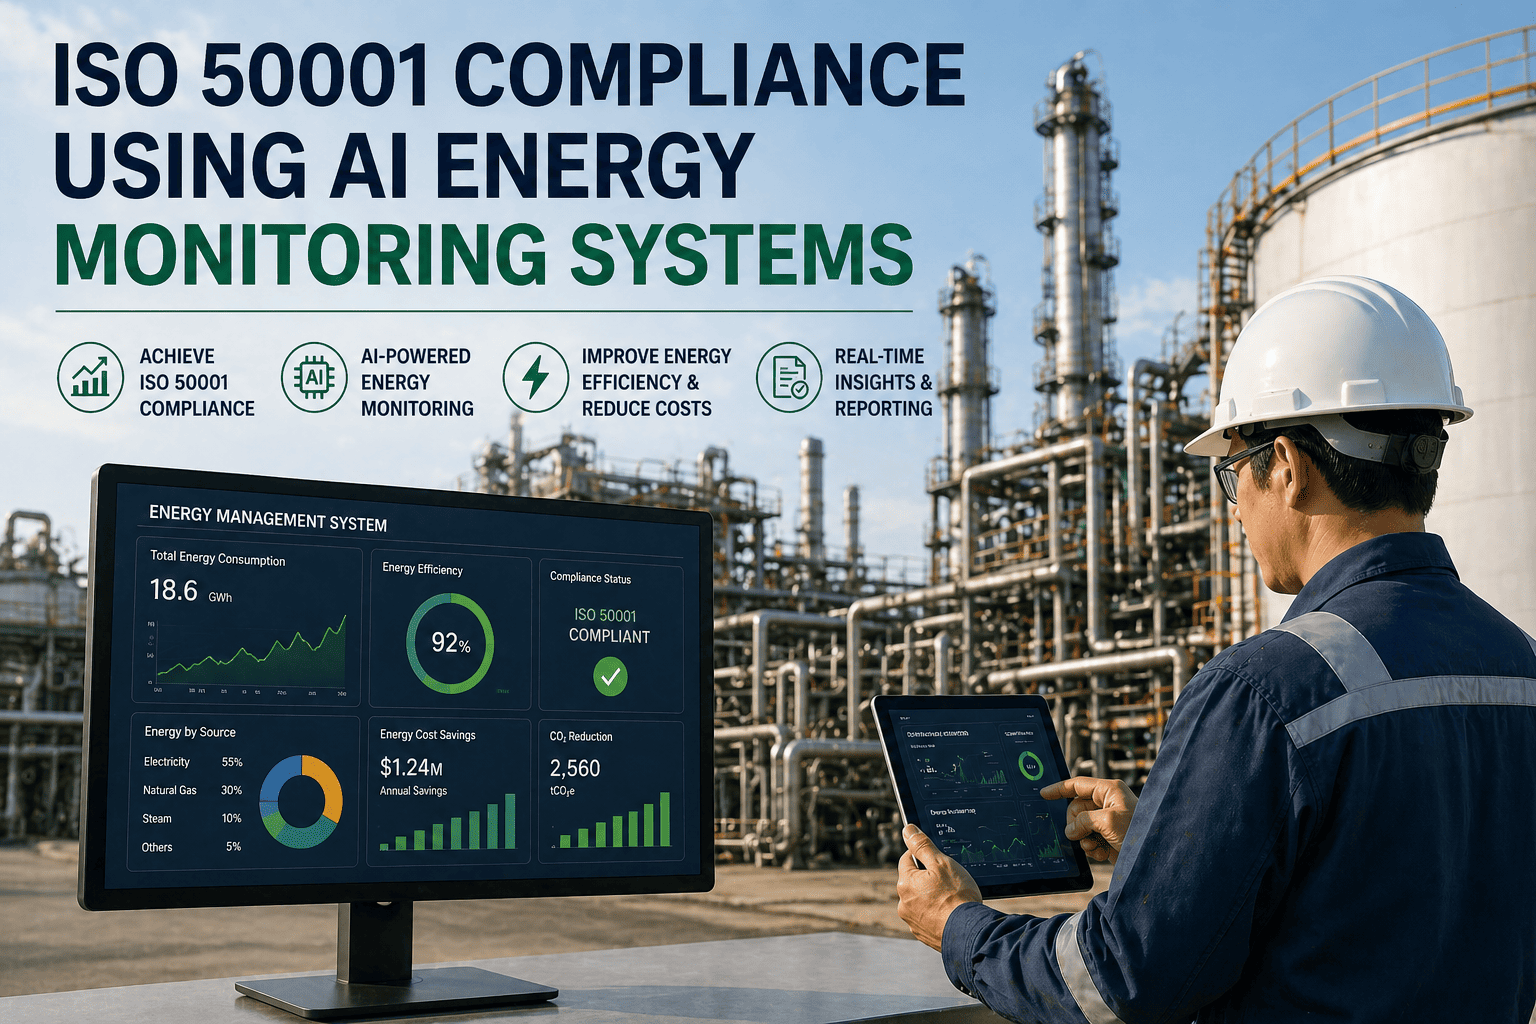
Scope 1 and Scope 2 emissions tracked in real time and auto-exported to GHG Protocol, TCFD, and company net-zero target frameworks for investor disclosure. The Complete AI Platform for Oil & Gas Operations.
Scope Emissions Optimization by Segment
Each segment presents unique Scope 1 and Scope 2 reduction opportunities. iFactory deploys optimization models calibrated to upstream, midstream, and downstream operations.
Upstream: Equipment & Methane Focus
- ✓Compressor efficiency monitoring (target 92%+ vs 88% baseline)
- ✓Methane leak detection and prevention 2-4 weeks early
- ✓Flaring reduction through upset prediction and prevention
- ✓Scope 1 reduction 12-18% annually from equipment optimization
Midstream: Pipeline Integrity & Transport
- ✓Leak detection and prevention on long-haul pipelines
- ✓Compression power optimization reducing energy waste 5-8%
- ✓Pipeline corrosion and scale management reducing friction losses
- ✓Scope 1 reduction 8-12% from pressure optimization and leak prevention
Downstream: Refinery Energy Efficiency
- ✓Heater duty optimization matching production rate changes
- ✓Heat recovery opportunity identification reducing Scope 1 by 3-5%
- ✓Scope 2 reduction 15-20% from pump and HVAC optimization
- ✓Combined Scope 1&2 reduction 18-25% through process integration
Use Cases: Scope Emissions Reduction Results
These outcomes reflect actual Scope 1 and Scope 2 emissions reductions from iFactory deployments at upstream, midstream, and downstream facilities over 6-month periods.
Case 01
Upstream Platform Equipment Optimization & Methane Detection
Upstream platform with 50+ compressors detected 11% equipment efficiency degradation and 2.4% methane leaks. Equipment optimization improved efficiency to 94%, methane detection prevented $3.2M in product loss. Scope 1 emissions reduced 14.2% annually (12,400 tonnes CO2e), fuel costs decreased $4.8M.
Case 02
Midstream Pipeline Optimization & Leak Prevention
400 km pipeline with scale buildup and 18 flaring events monthly. AI optimization reduced compression power 5.6% and prevented 94% of flaring events. Scope 1 emissions reduction 9.2% (8,200 tonnes CO2e), operational savings $2.1M annually from reduced fuel and recovered product.
Case 03
Refinery Scope 1&2 Integration & Process Optimization
Refinery with static process control wasting 16% heater energy and 12% excess electricity consumption. Dynamic process control and heat recovery integration reduced combined Scope 1&2 emissions 18.6% (14,200 tonnes CO2e). Energy savings $5.4M annually while maintaining production capacity.
Frequently Asked Questions
QHow does iFactory differentiate Scope 1 from Scope 2 emissions?
iFactory tracks fuel consumption and direct process emissions separately (Scope 1), and purchased electricity independently (Scope 2). Real-time categorization enables targeted reduction strategies by emissions source.
Book Demo to see emissions categorization.
QCan emissions reductions be verified for ESG reporting?
Yes. iFactory generates auditable emissions baselines and tracks reductions with timestamps and equipment attribution. Reports exportable to GHG Protocol, TCFD, and regulatory frameworks with complete audit trails for third-party verification.
QHow quickly can Scope 1&2 reductions be measured?
Pilot reductions measurable within 4 weeks of deployment from equipment optimization. Full facility emissions reduction achieved within 8-12 weeks.
Talk to Support for your specific timeline.
QDoes optimization impact production or operations?
No. All optimizations maintain production rates and system reliability. Emissions reductions achieved through equipment performance improvement, not reduced operational duty. Production stays constant while emissions intensity decreases.
Reduce Scope 1&2 Emissions by 12-28%. Deploy AI in 8 Weeks.
Real-time Scope 1 and Scope 2 emissions monitoring, equipment optimization, methane leak prediction, process control improvement, and automated GHG reporting — fully integrated with SCADA/DCS in 8 weeks with emissions reductions measurable in week 4. The Complete AI Platform for Oil & Gas Operations.
12-28% energy reduction
$420M-$840M annual savings
Results in week 4