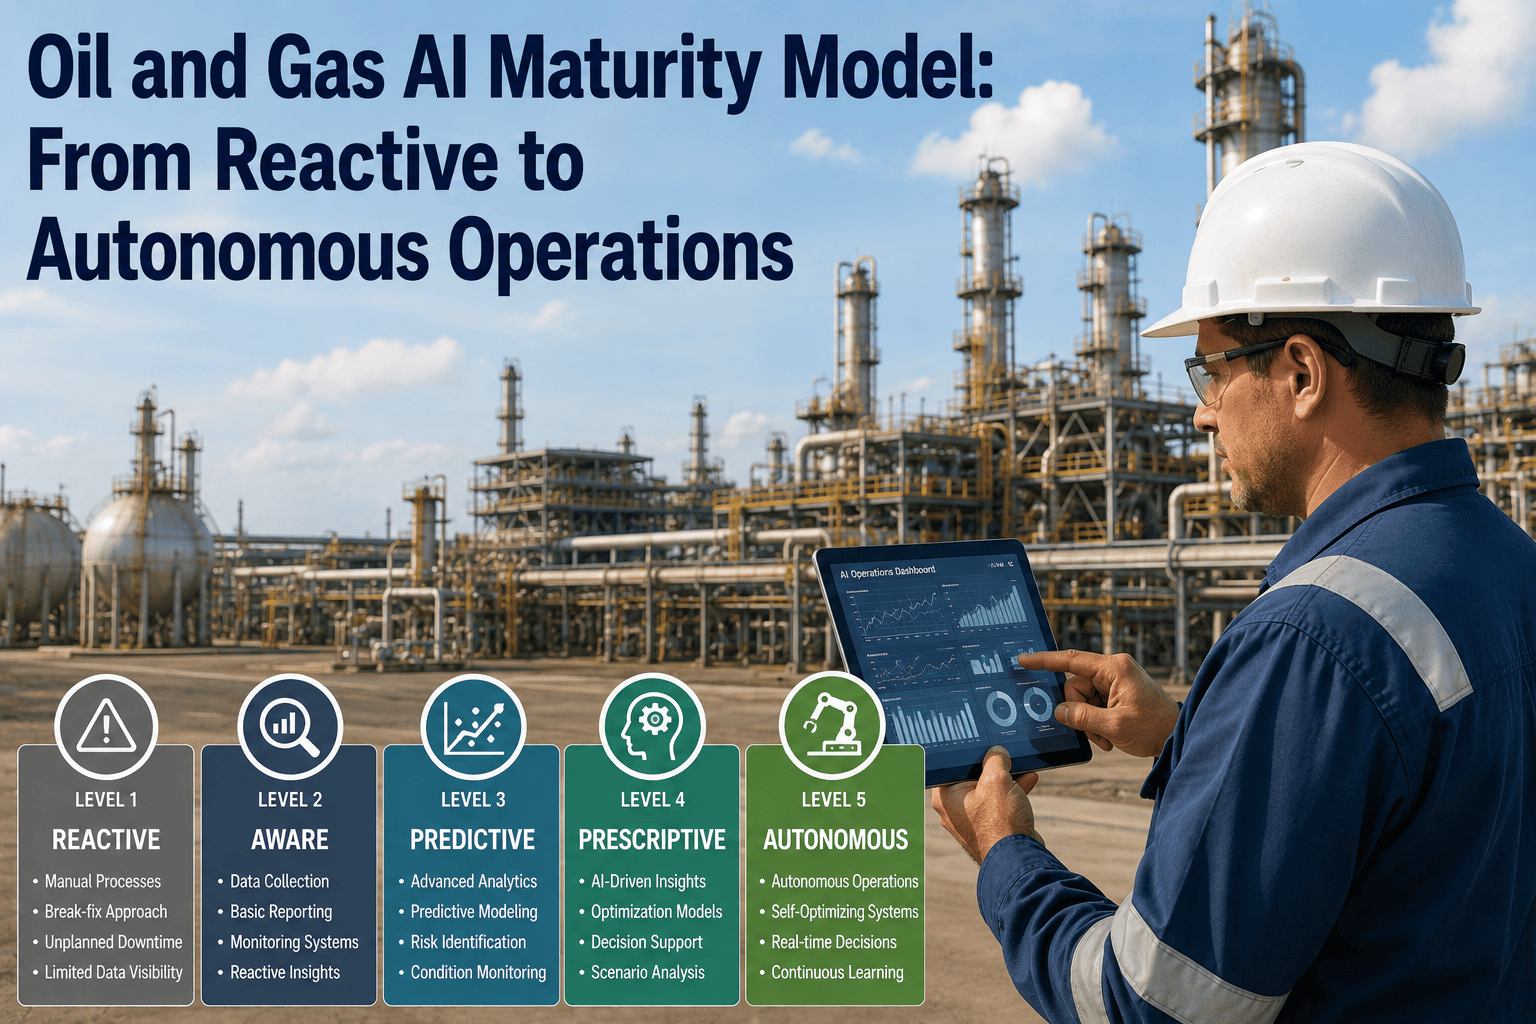
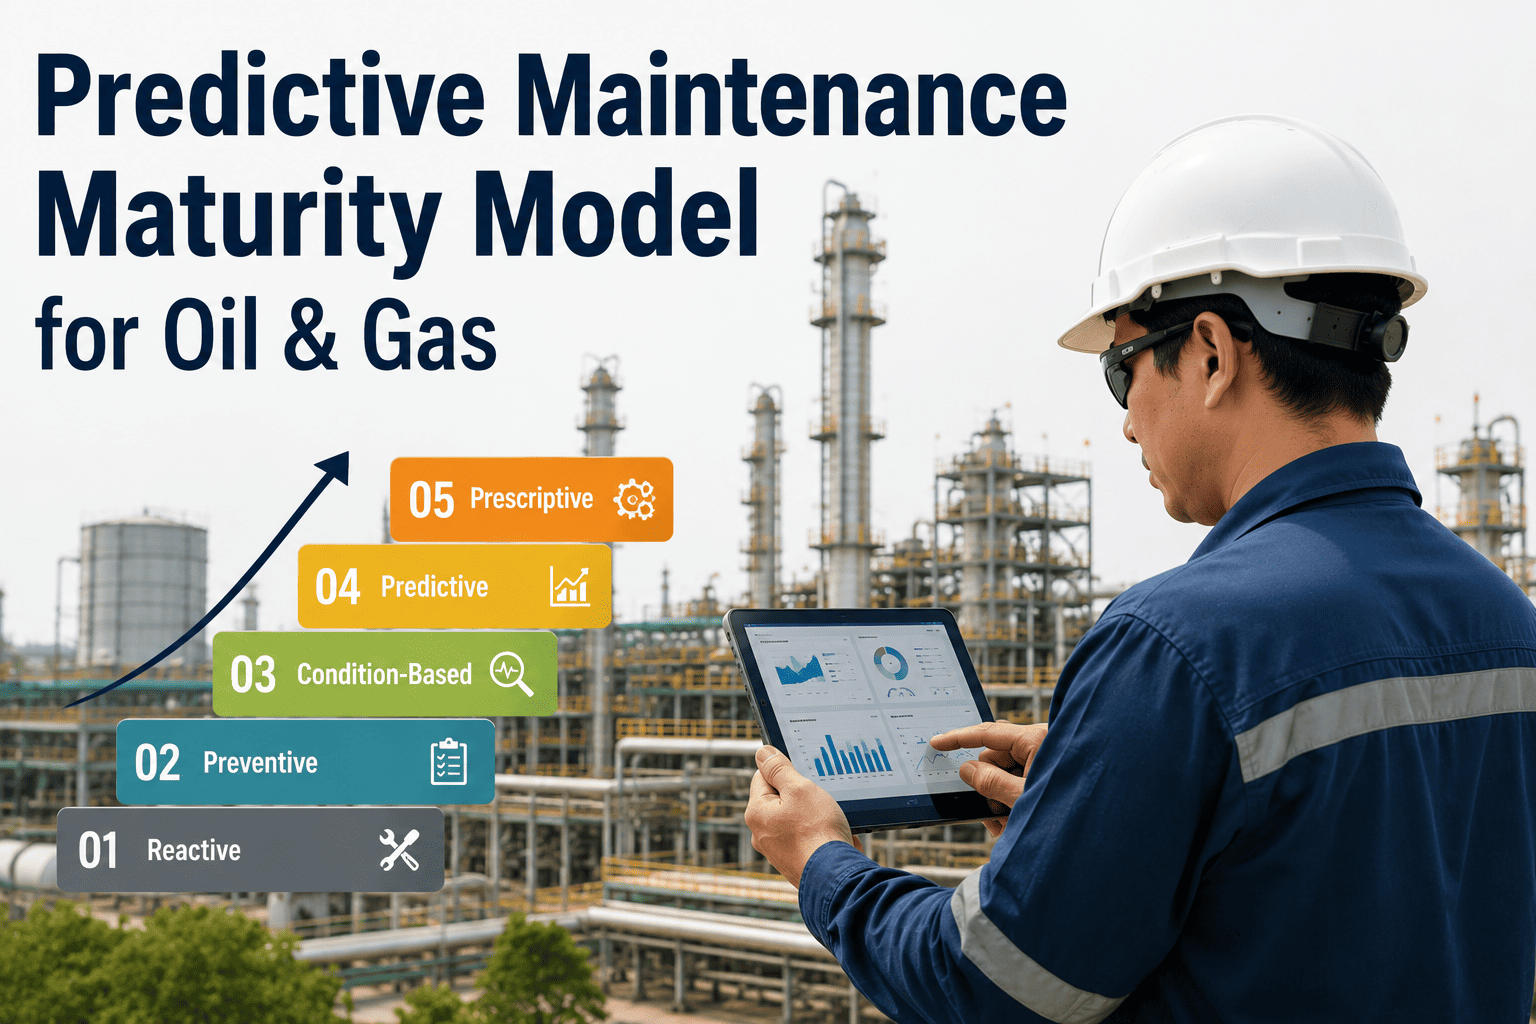
Ask ten operators where they sit on the AI journey and nine will say "somewhere in the middle." That answer is comfortable and almost always wrong, because the gap between having dashboards and having a system that decides is not a matter of degree — it is a difference in kind. A maturity model matters precisely because it forces an uncomfortable, specific answer: does your organisation react to failures, record them, forecast them, get told what to do about them, or have the work already handled before anyone opens a laptop? Each of those is a distinct operating state with its own economics, and you can book a demo to have your own assets scored against all five.
MATURITY FRAMEWORK · OIL AND GAS · REACTIVE TO AUTONOMOUS
Find Out Which of the Five Levels Your Operation Is Actually On
Most operators overestimate their maturity by a full level. iFactory scores your data foundation, model deployment, workflow integration, and governance against a five-level framework — then builds the shortest credible path to the next level rather than a five-year slide deck.
70%
Of digital programs never leave pilot
Under 24%
Use predictive, data-driven maintenance
17%
Have deployed AI agents to date
30-70%
EBIT uplift projected at full adoption
The Stall Point
Why the Industry Has Been Stuck at the Same Place for Five Years
The most quoted number in oil and gas digital strategy is that roughly 70 percent of digital transformation initiatives never move beyond the pilot stage — a McKinsey estimate that analysts note has not materially improved in five years despite billions of dollars of investment. That statistic gets repeated so often it has lost its sting, but read it carefully and it says something specific: the failures are not happening at the idea stage or the technology stage. They are happening at the transition from a working proof of concept to something that runs every day on every asset. That is a maturity problem, not a technology problem.
The picture on the operations side is equally revealing. Research cited across reliability studies finds that roughly three out of four organisations still rely on reactive or time-based maintenance approaches, with fewer than 24 percent reporting genuinely predictive, data-driven strategies. Meanwhile the same body of research shows that organisations applying predictive maintenance reduce unplanned downtime by approximately 36 percent, and that offshore operations average around 27 days of unplanned downtime annually — where a downtime rate of just one percent, about 3.65 days, can cost more than five million dollars a year. The economics are not in dispute. The adoption is.
What a maturity model contributes is a diagnosis rather than an aspiration. If you are stuck, the useful question is not "should we do more AI" but "which specific capability is missing that prevents the next step from working." An operator sitting at Level 2 with clean historian data and no anomaly detection has an entirely different problem from an operator sitting at Level 3 with excellent models that nobody in the field trusts enough to act on. Both feel stuck. Both would describe themselves as mid-journey. The interventions that unstick them share almost nothing.
Where Operators Actually Fall Out of the Journey
Organisations that start a digital or AI initiative
100%
Reach a functioning pilot with real operational data
Majority
Scale beyond pilot into daily production use
About 30%
Reach genuinely predictive, data-driven operations
Under 24%
Have deployed autonomous or agentic capability
About 17%
Figures are drawn from published industry research on digital transformation scaling, predictive maintenance adoption, and enterprise AI agent deployment. They describe different populations and are shown together to illustrate the shape of attrition, not a single tracked cohort.
The Framework
The Five Levels — From Reactive Firefighting to Autonomous Operations
Each level below is defined by one question: who or what closes the loop between something happening in the field and something being done about it. At Level 1 a human notices and a human acts. At Level 5 the system notices and the system acts, with humans setting the boundaries and reviewing the record. Everything in between is a progressive transfer of that loop from people to software, and the levels are strictly sequential — you cannot skip one, because each level's output is the next level's required input.
Level 1
Reactive
Humans notice, humans decide, humans act
What It Looks Like
Paper rounds sheets and spreadsheets. Failures are discovered by an operator on a walkdown or by a call from the control room. Asset history lives in binders, in a technician's memory, and in email threads. Root cause analysis happens for major incidents only, and the findings rarely change future behaviour because nothing systematically captures them.
What It Costs You
Industrial research consistently finds unplanned failures cost several times more to resolve than scheduled work, once emergency labour rates, expedited parts, deferred production, and secondary damage are counted. Institutional knowledge walks out the door with every retirement, and there is no data foundation to build anything on.
Trigger to Move Up
A single high-cost failure that nobody can explain, or an audit that cannot be answered because the records do not exist. The move to Level 2 is fundamentally a records and connectivity project, not an AI project, and treating it as one is the most common early mistake.
Level 2
Digital
Software records, humans decide and act
What It Looks Like
A CMMS holds work orders and asset registers. SCADA and historians capture process data continuously. Dashboards exist and are reviewed in morning meetings. Preventive maintenance runs on calendar intervals. The information is present and reasonably accurate, but every interpretation and every decision is still made by a person reading a screen.
What It Costs You
Calendar-based intervals replace healthy components while missing degradation that develops between them. Data volume exceeds what any team can review, so most signals are never examined. This is where the large majority of the industry sits, and where the 70 percent pilot-stall statistic concentrates.
Trigger to Move Up
Recognition that the historian already contains the evidence of failures nobody caught. The gating requirement is not model sophistication but data contextualisation: tags mapped to assets, assets mapped to hierarchy, and failure history labelled well enough to train against.
Level 3
Predictive
Software forecasts, humans decide and act
What It Looks Like
Machine learning models run continuously on vibration, thermal, current, pressure, and flow data. Anomaly detection flags deviations from learned normal behaviour. Failure probability and remaining useful life estimates are produced for critical rotating equipment. The system reliably answers what is likely to happen and roughly when.
What It Costs You
Alerts arrive without an attached action, so a planner still has to translate a probability score into a decision about parts, crews, and scheduling. Alert fatigue sets in quickly when precision is not tuned, and teams begin quietly ignoring the system — which looks identical to Level 2 from the outside.
Trigger to Move Up
The moment someone asks "the model says this pump degrades in eleven days, so what exactly should I do on Tuesday." Answering that requires the model to reason about spares, crew availability, production schedule, and cost — which is the definition of Level 4.
Level 4
Prescriptive
Software recommends, humans approve and act
What It Looks Like
Every prediction arrives attached to a specific ranked recommendation: which intervention, at which window, with which parts, at what cost, with what production impact if deferred. The system reasons across the maintenance backlog, spares inventory, crew calendar, and production plan simultaneously. Planners approve or override rather than construct decisions from raw output.
What It Costs You
Human approval remains a throughput ceiling. When recommendations arrive faster than planners can review them, the queue becomes the bottleneck and the system's advantage in speed is surrendered at the last step. Governance and audit requirements also become genuinely demanding at this stage.
Trigger to Move Up
A documented accuracy record showing that a defined class of recommendations is approved without modification the overwhelming majority of the time. That evidence is what justifies allowing that narrow class to execute automatically inside guardrails, which is the entry to Level 5.
Level 5
Autonomous
Software decides and acts, humans set bounds
What It Looks Like
Defined action classes execute automatically within operator-set limits — work orders raised and scheduled, parts reserved, setpoints adjusted inside a safe envelope, crews notified. Every action is logged with the reasoning that produced it and can be overridden instantly. Humans move from executing decisions to defining boundaries and reviewing exceptions.
What It Costs You
Gartner projects that more than 40 percent of agentic AI projects will be cancelled by the end of 2027 because of escalating costs, unclear value, or inadequate risk controls. Autonomy attempted without the governance layer beneath it is the single most expensive failure mode in this framework.
Where It Is Heading
Gartner expects at least 15 percent of day-to-day work decisions to be made autonomously through agentic AI by 2028, up from effectively zero in 2024, and 33 percent of enterprise applications to embed agentic AI by the same year. The direction is not in question; the sequencing is.
Self-Assessment
Score Yourself — Six Dimensions Across Five Levels
Organisations are almost never at one level uniformly. A refinery might run Level 3 predictive models on rotating equipment while its spares data sits firmly at Level 1, and that mismatch is exactly what caps the whole system's performance. The matrix below lets you locate yourself honestly on each dimension separately. The rule that matters: your effective maturity is set by your weakest dimension, not your strongest, because the loop only closes if every link in it holds.
Run this honestly and the result is usually uncomfortable in a productive way. The most common real-world profile in oil and gas is strong on data foundation and analytics capability but weak on workflow integration and governance — an organisation that has bought good models and bolted them alongside the maintenance process rather than into it. That profile produces exactly the symptom teams describe most often: the models are apparently accurate, and nothing about daily operations has changed.
GET SCORED ON YOUR OWN ASSETS
Stop Guessing Your Maturity Level — Have It Measured Against Your Real Data
Our team will walk your historian tags, CMMS records, and current decision workflow through the six-dimension matrix and show you which single dimension is capping your effective maturity, plus what closing that specific gap is worth.
The Readiness Grid
Two Variables Determine Whether Your Next Level Attempt Succeeds
Reduced to essentials, progression up this ladder depends on two things that organisations tend to develop at very different speeds: how ready the data is, and how ready the governance is. Data readiness determines whether a model can be built at all. Governance readiness determines whether anyone will be permitted to act on it. Plot yourself on both and the correct next move becomes obvious, because each quadrant has exactly one sensible strategy and three expensive ones. Book a demo to see where your operation lands on this grid.
Low data, low governance
Foundation First
You are at Level 1 or early Level 2 regardless of what pilots are running. Attempting predictive deployment here produces models trained on unreliable history that nobody has authority to act on. The correct move is unglamorous: tag mapping, asset hierarchy, failure code discipline, and a clear owner for data quality.
Do this: contextualise data before buying models
High data, low governance
The Shelfware Trap
The most common profile in the sector and the source of most abandoned deployments. Accurate models produce alerts that field teams have no mandate, process, or incentive to act on. Research consistently finds governance maturity lagging badly, with only about a fifth of organisations reporting a mature governance model for autonomous systems.
Do this: integrate into work management, not alongside it
Low data, high governance
Willing But Blind
Leadership is aligned, approval pathways exist, and the appetite for automation is real — but the underlying data cannot support a model that would earn trust. Deploying here burns organisational goodwill fast, because the first few false positives are read as evidence that the technology does not work rather than that the inputs were inadequate.
Do this: spend the mandate on data before models
High data, high governance
Ready to Advance
Both preconditions are met and the constraint is now sequencing and scope discipline. This is where a level jump can be executed in months rather than years, provided the scope stays narrow enough to produce a documented accuracy record before widening. Operators in this quadrant are the ones who compound.
Do this: advance one narrow asset class end to end
The second quadrant deserves the most attention because it is where the largest amount of already-spent budget currently sits. Industry research repeatedly identifies unclear business value and inadequate risk controls — not model accuracy — as the reasons AI programmes get cancelled, and separate surveys find data quality named as the biggest deployment blocker by around half of organisations. Neither of those is a modelling problem. Both are solved by the same discipline: connect the output to the process that already exists, and give someone explicit authority to act on it.
Value Progression
What Each Level Jump Is Actually Worth
The returns from this ladder are not linear and they are not evenly distributed. The jump from Level 1 to Level 2 delivers relatively modest direct savings but is the precondition for everything else, which makes its true value hard to see on a business case. The jump from Level 2 to Level 3 typically delivers the largest single step in measurable downtime reduction. Levels 4 and 5 shift the gains from downtime avoidance toward planning efficiency, capital deferral, and workforce leverage — which are larger in aggregate but slower to appear in a monthly report.
Cumulative Capability Unlocked Across the Ladder
Level 1 to Level 2
Records become searchable and process data becomes continuous. Direct savings are modest, but this step creates the training data every later level depends on. Skipping the discipline here is why later models underperform.
Level 2 to Level 3
The largest measurable step. Reliability research associates predictive programmes with unplanned downtime reductions in the region of a third, alongside meaningful reductions in unnecessary preventive work and extended asset life.
Level 3 to Level 4
Value shifts from detection to planning. Recommendations that account for spares, crews, and production windows convert accurate predictions into executed work, which is where prediction accuracy finally becomes revenue.
Level 4 to Level 5
Removes the human approval ceiling for a defined class of routine decisions. Gains come from speed, consistency, and freed engineering capacity rather than from better predictions, which were already good at Level 4.
There is a strategic argument buried in this progression that matters for capital planning. Because the levels are sequential, the cost of arriving late compounds rather than staying flat. An operator who reaches Level 3 in 2027 does not simply get Level 3 benefits two years later than a competitor — they also start accumulating the labelled failure history that Level 4 requires two years later, which pushes Level 4 out further still. Deloitte expects US oil and gas companies to dedicate more than half of IT spending to AI and generative AI by 2029, and Gartner's 2026 survey found only 17 percent of organisations have deployed AI agents while more than 60 percent expect to within two years. The gap between those two numbers is the window currently open.
Execution
How a Single Level Jump Is Actually Executed in 18 Months
The reason most roadmaps fail is that they attempt breadth before depth — twelve asset classes at Level 3 simultaneously, none of them deep enough to earn trust. The approach that works inverts this: take one asset class the whole way through the loop, prove it end to end, then replicate the pattern. The phases below describe a single level jump for a defined scope, and the same three-phase shape repeats for each subsequent jump regardless of which level you are moving between.
Foundation and Scope Lock
One asset class selected on failure frequency and consequence, not on ease of instrumentation. Tags mapped, asset hierarchy confirmed, failure history labelled, and measurement gaps closed. Success criteria and the specific decision the system will influence are written down before any model is built, because scope drift after this point is what turns a nine-month project into a three-year one.
Exit criteria: contextualised data and a written decision target
Advisory Operation and Trust Building
Models run in production but recommendations are advisory only. Every output is reviewed, followed or overridden, and the outcome recorded. This produces the accuracy record that governance will later require, and it produces something more valuable: field teams who have watched the system be right on their own equipment, which no vendor benchmark can substitute for.
Exit criteria: documented accuracy record and field acceptance
Workflow Closure and Replication
Outputs are wired into work management so recommendations generate draft work orders inside existing planning processes rather than a parallel notification stream. Guardrails, override paths, and audit logging are formalised. Only once this holds does the pattern replicate to the next asset class, carrying the data model and governance framework with it.
Exit criteria: closed loop in production and a repeatable pattern
Notice that roughly half the calendar is spent before any model produces a decision anyone acts on. That allocation is deliberate and it is the single biggest difference between programmes that scale and programmes that join the 70 percent. Compressing Phase 1 to reach a demo faster is the most reliably expensive decision available in this entire framework, because every shortcut taken in data contextualisation reappears later as model inaccuracy that costs far more to diagnose than it would have cost to prevent.
Frequently Asked Questions
Oil and Gas AI Maturity — Common Questions
Can we skip Level 3 and go straight to prescriptive or autonomous operations?
No, and the reason is structural rather than philosophical. A prescriptive recommendation is only as good as the prediction it is built on, and an autonomous action is only as safe as the accuracy record that justified granting it authority. Skipping Level 3 means deploying recommendations with no validated forecasting underneath them, which is precisely the pattern behind the projection that more than 40 percent of agentic AI projects will be cancelled by the end of 2027. What you can compress is the time spent at each level for a narrow, well-chosen scope, and a
demo is the fastest way to see where that compression is realistic for your assets.
Our different sites are at completely different levels. How should we handle that?
Mixed maturity across a portfolio is normal and it is usually an advantage rather than a problem, provided you use it deliberately. The most effective approach is to advance your most mature site one level as a pattern-setting exercise, then replicate the data model, governance framework, and workflow integration to less mature sites rather than rebuilding from scratch each time. The replication is substantially faster than the original because the hard decisions about asset hierarchy, failure coding, and approval pathways have already been made and tested. Attempting to bring every site up simultaneously spreads scarce expertise too thin to produce a convincing result anywhere.
How do we know whether our data is genuinely ready for Level 3?
Three practical tests answer this better than any formal audit. First, can you trace a specific historical failure through your records and identify which tags were behaving abnormally beforehand — if the data exists but nobody can reconstruct the event, it is not yet contextualised. Second, are failure codes in your CMMS used consistently enough that filtering by failure mode returns a meaningful set rather than mostly generic entries. Third, is every critical asset mapped to its process tags without a spreadsheet lookup. Failing any of these does not mean starting over, but it does mean Phase 1 work is genuinely required rather than optional.
What does governance actually mean at Level 4 and Level 5 in practical terms?
It means four specific artefacts existing and being maintained, not a policy document. A defined action class list stating exactly which decisions the system may take and which it may not. Explicit numerical guardrails bounding those actions. An immediate override mechanism available to operations without escalation. And a complete audit log capturing every action alongside the data and reasoning that produced it. Research on enterprise AI adoption consistently finds governance maturity lagging capability, with only about a fifth of organisations reporting mature governance for autonomous systems, and that gap is the primary predictor of programme cancellation.
We already have predictive models but nothing has changed operationally. What is wrong?
This is the most frequently described symptom in the sector and it almost always indicates a workflow integration gap rather than a model problem. Predictions delivered to a separate dashboard require a human to translate them into planning decisions, and when planners are already at capacity that translation simply does not happen. The fix is to connect model output to the work management process so recommendations arrive as draft work orders inside the system planners already use. Our team can review your current architecture and identify the specific disconnect through
support or a scoped assessment session.
IFACTORY · AI MATURITY ASSESSMENT
Know Your Level, Know Your Gap, Know What the Next Step Is Worth
iFactory scores your operation across all six dimensions, identifies the single constraint capping your effective maturity, and builds a phased path to the next level with the data foundation, model deployment, workflow integration, and governance layer handled together rather than as separate projects.
6
Dimensions scored on your data
1 level
Targeted per 18-month cycle
Advisory
Before any autonomous action
Brownfield
Works with existing SCADA and CMMS