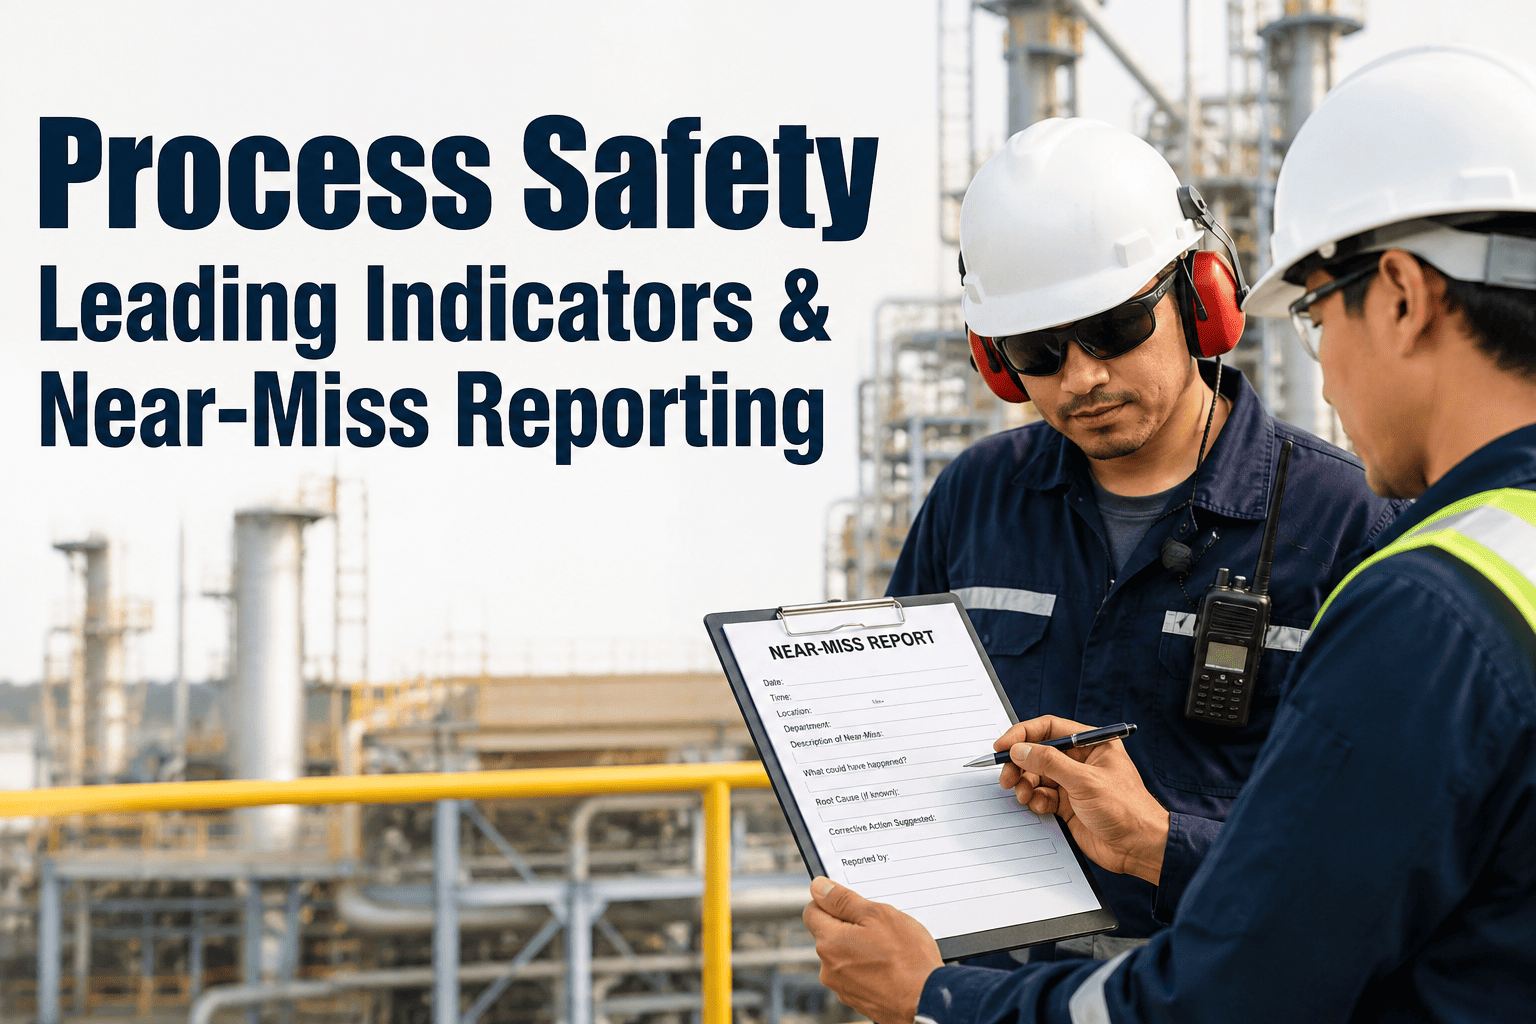
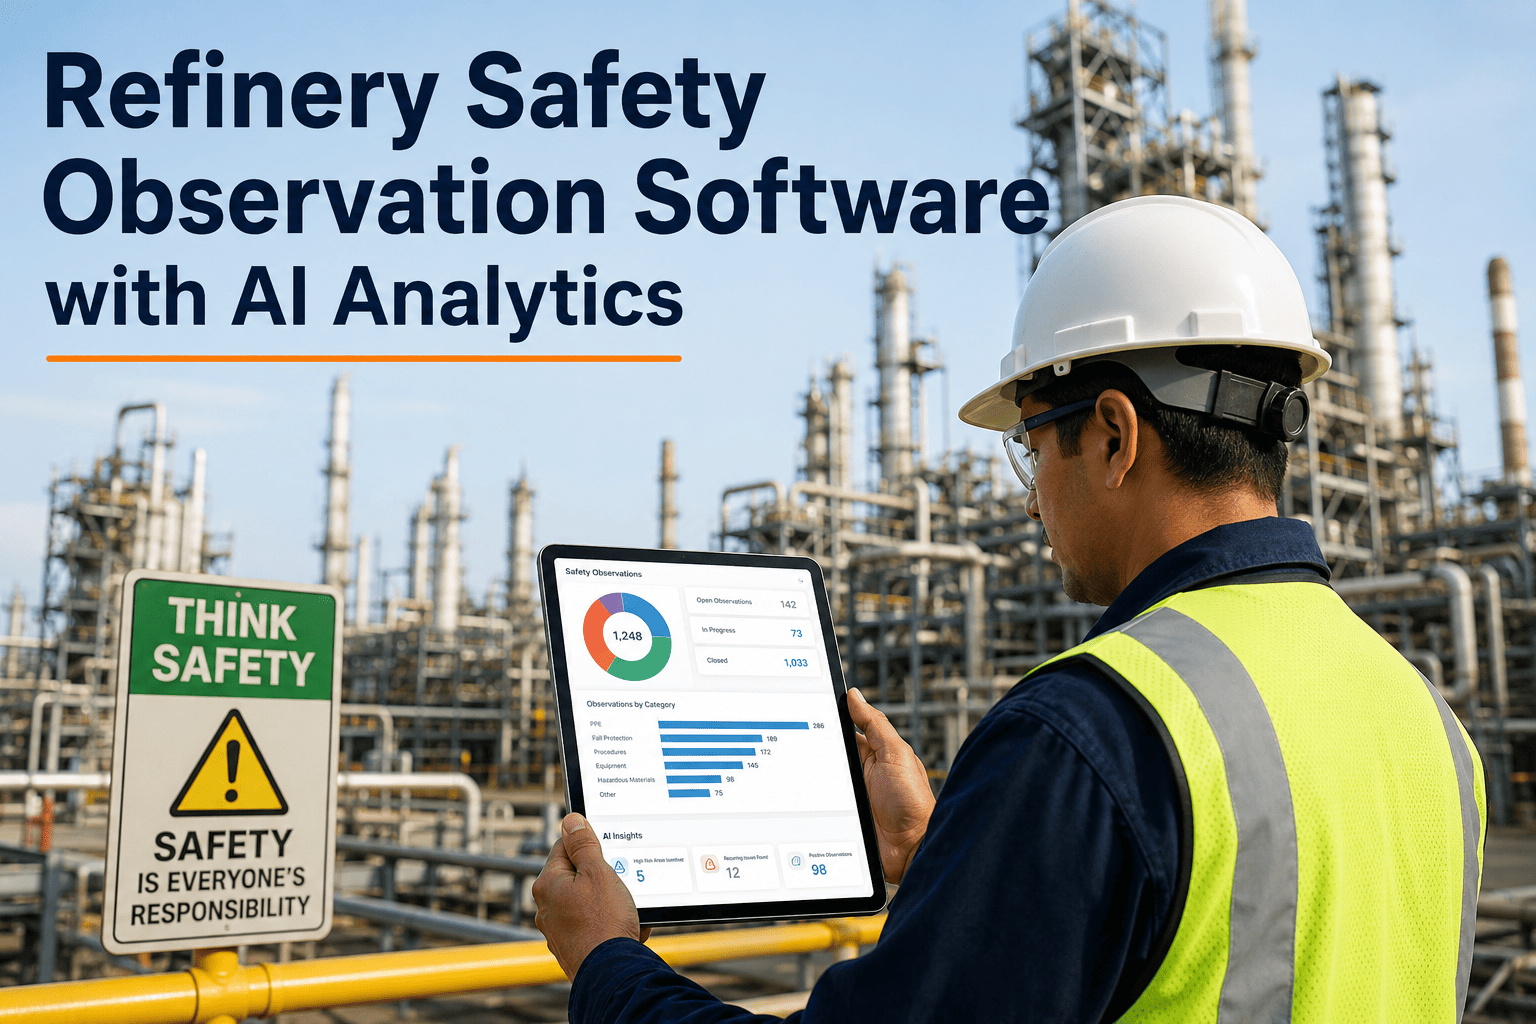
Most process safety programs are built to count what already went wrong. A recordable injury, a fire that crossed a damage threshold, a loss of containment large enough to trigger a formal report — these numbers only appear on a scorecard after the barrier that was supposed to prevent them has already failed. By the time a lagging indicator moves, the plant has already paid for the lesson it teaches. Leading indicators work the other way around: an overdue relief valve test, a growing management-of-change backlog, a safety device that has been bypassed for three shifts running are all signals visible weeks or months before an incident, and near-miss reports are often the loudest of them all if anyone is actually reading them. A demo can show how connected near-miss and leading indicator tracking surfaces these signals automatically.
Process Safety Metrics
Process Safety Leading Indicators & Near-Miss Reporting
Move beyond lagging KPIs — track overdue PSV tests, MOC backlogs, bypassed safety devices, and near-miss reports before they become Tier 1 events.
Why Lagging Metrics Arrive Too Late
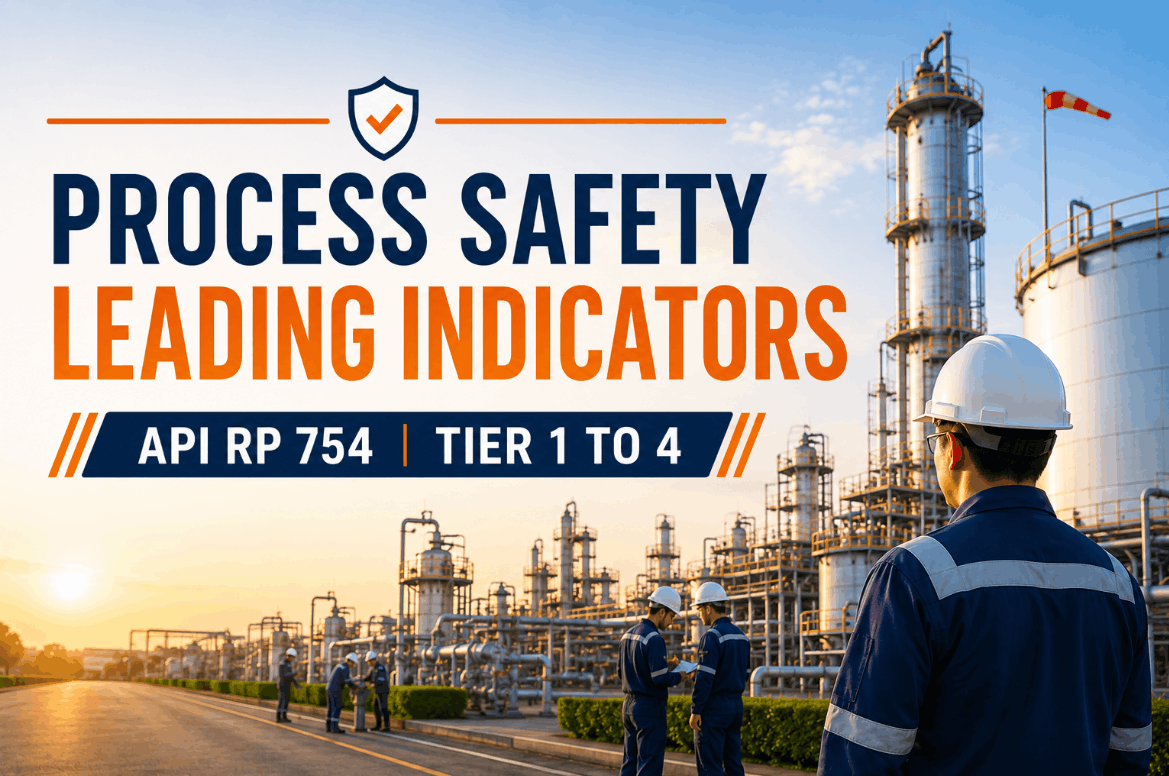
API Recommended Practice 754 was developed after the Baker Panel's investigation into the 2005 BP Texas City disaster, and it exists because refining and petrochemical companies had spent years tracking injury rates while process safety performance quietly deteriorated underneath them. The RP defines a Tier 1 process safety event as a loss of primary containment severe enough to cause a fatality, a hospital admission, or fire and explosion damage above a defined dollar threshold. A Tier 2 event is a lesser-consequence version of the same failure. Both are useful for industry benchmarking and public reporting, but both are, by definition, records of something that has already happened.
The problem isn't that lagging indicators are wrong — it's that they arrive too late to change the outcome they describe. A plant that only tracks Tier 1 and Tier 2 events is effectively driving by looking in the rearview mirror. The whole point of a four-tier framework is that Tiers 3 and 4 exist further up the pyramid, where a weakness can still be corrected before it becomes a statistic.
Lagging vs Leading: Two Different Jobs
Lagging Indicators (Tier 1 & 2)
Measure loss of primary containment events that have already occurred
Standardized under API RP 754 for benchmarking and public reporting
Tell you what failed, not what's about to
Leading Indicators (Tier 3 & 4)
Measure challenges to safety systems and operating discipline before failure
Company-defined and intended for internal, site-level use
Give a team time to intervene while the weakness is still correctable
The Four-Tier Framework at a Glance
| Tier | Focus | Typical Example | Reporting Use |
| Tier 1 |
Greatest-consequence loss of containment |
Fatality, hospitalization, major fire or explosion damage |
Public reporting & industry benchmarking |
| Tier 2 |
Lesser-consequence loss of containment |
Recordable-injury-level release or smaller fire |
Public reporting & industry benchmarking |
| Tier 3 |
Challenges to safety systems |
Safe operating limit excursion, demand on a safety device |
Internal, site-level tracking |
| Tier 4 |
Operating discipline & management systems |
Overdue PSV tests, training completion, procedure adherence |
Internal, plant-specific tracking |
The Real Cost of Waiting for Lagging Data
A Tier 1 event carries costs well beyond the direct damage threshold that defines it. Regulatory investigation, third-party liability, insurance premium increases, unplanned downtime, and the reputational cost of a public incident report all stack on top of whatever repair bill triggered the classification in the first place. None of that changes what leading indicators are for: the entire economic argument for tracking overdue PSV tests, MOC backlogs, and bypass duration is that fixing a Tier 4 gap costs a fraction of what a Tier 1 event costs once it materializes.
This is also why leading indicator programs struggle to get funded even when the case is obvious on paper. A closed MOC backlog or a cleared bypass log doesn't show up as a saved cost anywhere, because the incident it would have caused never happens. Leading indicators require a team to invest in preventing something that, if the program works, will never be visible as an avoided loss — which is exactly why the data needs to be tracked and reviewed on a fixed cadence rather than left to individual initiative.
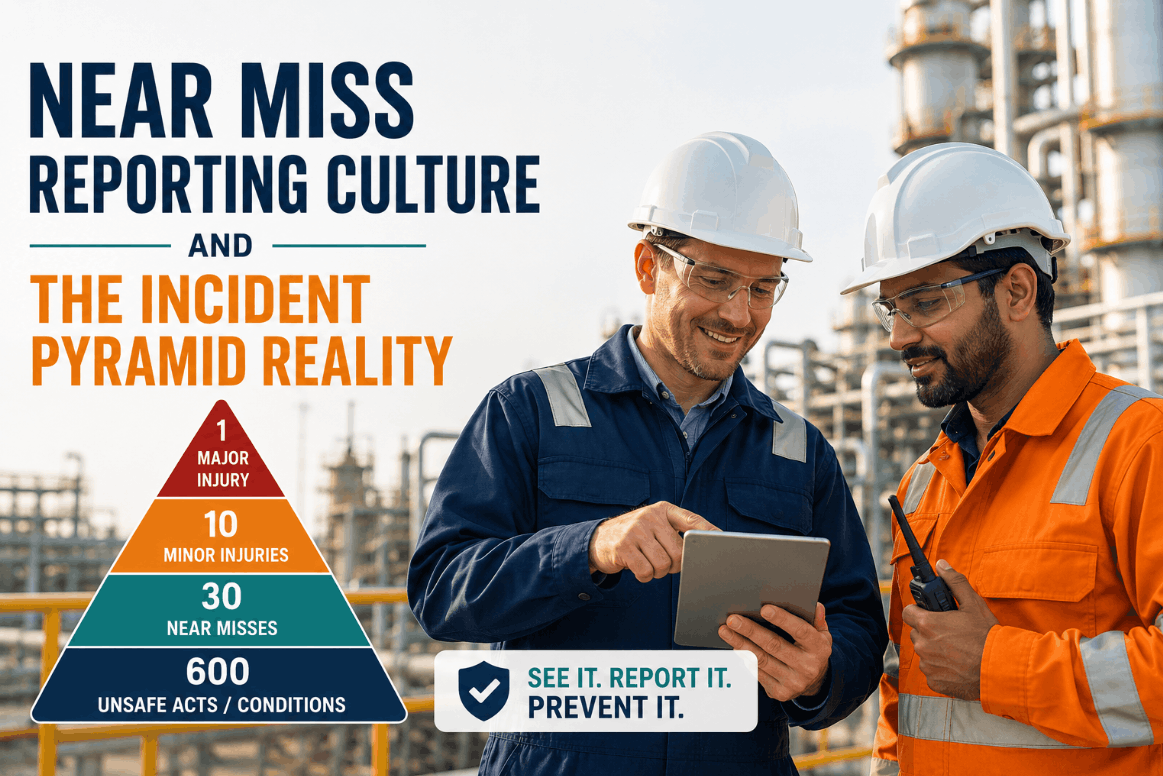
The Near-Miss Iceberg
300+
near misses are typically estimated to precede one serious injury in classic safety triangle models
2
of the four API RP 754 tiers exist purely for internal, company-defined leading measures
0
warning a Tier 1 lagging metric gives before the event it counts has already occurred
Precursor Signals Worth Watching Every Week
1
Overdue PSV and relief valve testing: pressure relief devices past their scheduled test date are a direct, measurable erosion of a protection layer.
2
Growing MOC backlog: a pile of unclosed management-of-change requests means temporary conditions are quietly becoming permanent, undocumented risk.
3
Bypassed or defeated safety devices: any interlock or shutdown system taken out of service for more than a shift should trigger visibility, not silence.
4
Repeated safe operating limit excursions: near-limit operation without an actual trip is where operating margin is quietly shrinking before anyone notices.
5
Rising safety-critical alarm rates: a spike in alarms on a protection layer, even without a demand, often precedes a control or equipment issue by days or weeks.
6
Contractor and turnaround procedure deviations: non-routine work is where unfamiliar hazards and shortcuts most often combine, making deviation tracking a strong early signal on its own.
Stop Losing Signal
Turn Near-Miss Reports Into Action, Not Paperwork
See how iFactory routes every near-miss report to the right owner and tracks it to closure instead of letting it sit in a spreadsheet.
What a Leading Indicator Program Actually Requires
1
A single source of truth: PSV schedules, MOC status, bypass logs, and near-miss reports usually live in separate systems, and a leading indicator program only works once they're pulled into one place.
2
Named ownership for every metric: a leading indicator with no assigned owner tends to sit unreviewed, which defeats the entire purpose of tracking it in the first place.
3
A fixed review cadence: weekly or biweekly review of Tier 3 and Tier 4 trends catches drift while it's still cheap to correct, rather than at the next scheduled audit.
4
Thresholds that trigger action, not just visibility: a dashboard that shows a growing MOC backlog without an escalation trigger is a report, not a program.
Why Near-Miss Reporting Programs Quietly Fail
The single biggest reason near-miss reporting programs stop producing useful data isn't a lack of a form or a policy — it's culture. When reporting is tied even loosely to discipline, operators under-report to avoid consequences, near-miss counts look artificially low, and the precursor signals that should have flagged a growing risk simply go dark. A just culture separates reporting from blame entirely, so the volume of near-miss reports goes up as trust builds rather than down, and every report becomes usable Tier 3 or Tier 4 data instead of a liability someone is trying to avoid creating.
Blame-Driven Reporting
Operators under-report to avoid discipline or scrutiny
Near-miss counts trend down even as real risk trends up
Precursor data goes dark exactly when it's needed most
Just Culture Reporting
Reporting is separated from individual discipline
Report volume rises as trust in the process builds
Every report becomes usable Tier 3 or Tier 4 leading data
Frequently Asked Questions
What's the difference between a near miss and a Tier 3 process safety indicator?
A near miss is any event that could plausibly have resulted in a loss of containment, injury, or fire but did not, while a Tier 3 indicator under API RP 754 describes a more specific challenge to a safety system, such as a demand on a safety device or an inspection result outside acceptable limits. In practice, a well-categorized near-miss report often feeds directly into Tier 3 or Tier 4 data once it's tagged correctly.
Support can help review how your current near-miss categories map to the tier framework.
How many near-miss reports should a facility expect to see?
There's no universal number, since it depends heavily on facility size, process complexity, and how mature the reporting culture already is. What matters more than the absolute count is the trend: a healthy program sees reporting volume rise as trust builds, not fall, and a sudden drop in reports is itself a leading indicator worth investigating rather than a sign that operations have gotten safer.
Does API RP 754 require companies to track leading indicators?
API RP 754 standardizes Tier 1 and Tier 2 lagging indicators for public reporting and industry benchmarking, but Tier 3 and Tier 4 leading indicators are intentionally left company-defined, since the right precursor signals vary by site, process, and equipment. The recommended practice provides the framework and the intent; selecting which specific leading indicators to track is a facility-level decision.
How long is too long for an overdue PSV test to stay open?
Can a bypassed safety device ever be acceptable?
Yes, temporary bypasses are a normal part of maintenance and troubleshooting, but they need a documented risk assessment, a defined time limit, and visible tracking so they don't quietly become permanent. The risk isn't the bypass itself, it's a bypass nobody is actively watching. Facilities that track bypass duration as a Tier 4 indicator catch overdue restorations far faster than those relying on memory or a paper log.
Ready When You Are
Give Your Process Safety Team the Full Picture
From overdue PSV tests to near-miss reports, see how iFactory brings every leading indicator into one live process safety view.