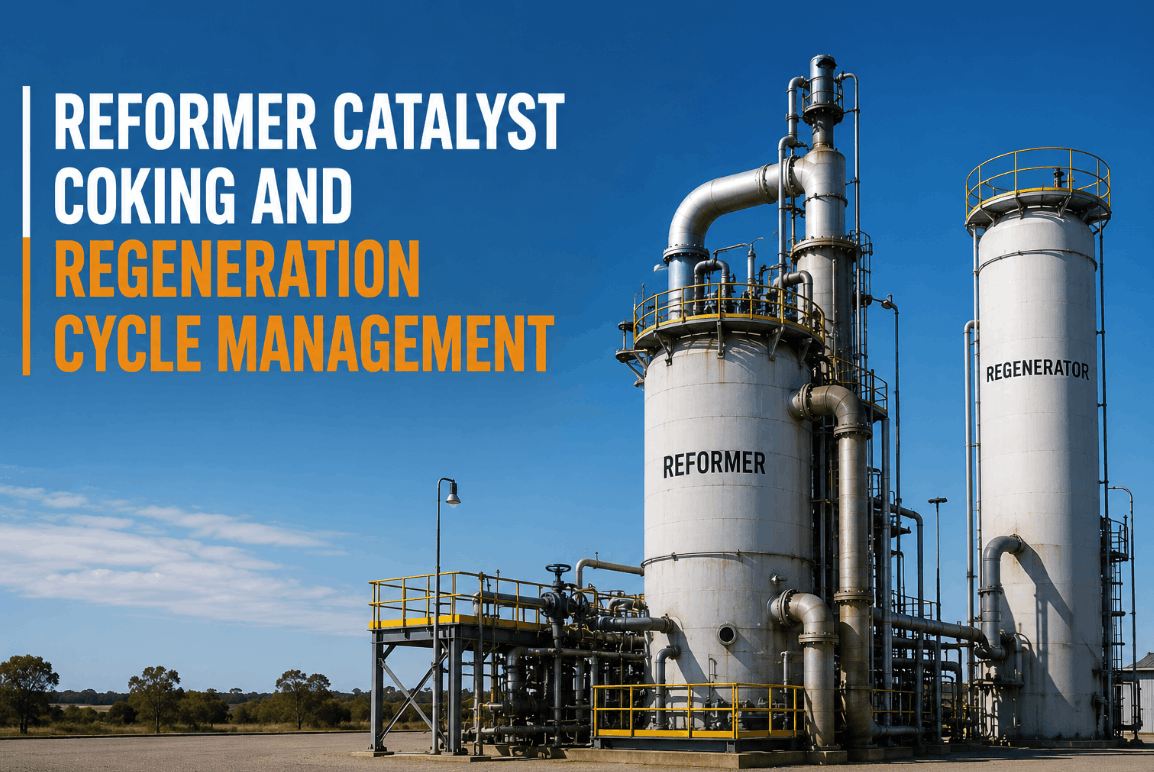
Catalytic reformer profitability is not determined at the product slate meeting — it is determined at the reactor inlet temperature, the chloride injection rate, and the coke laydown curve that no one in the control room is watching closely enough. The U.S. refining industry's reformer performance record shows a consistent and avoidable pattern: units that drift into octane shortfall, premature cycle termination, or unplanned regeneration outages are not doing so because the signals were absent. Weighted average inlet temperature trending above baseline, chloride-to-water ratio imbalances shifting the acid-metal function, RONR decline rates accelerating ahead of expected end-of-run — every one of these indicators was present in the process historian weeks before it became a margin problem. What was missing was not instrumentation. It was an AI analytics layer that connected those signals across reactor trains, applied catalyst-specific deactivation models, and delivered cycle management intelligence to a process engineer with enough lead time to intervene. iFactory's reformer analytics platform closes exactly that gap — continuously monitoring coke laydown rate, chloride balance, WAIT trajectories, and regeneration cycle pacing to maintain octane output and C5+ yield across the full run length. Refineries that have deployed iFactory's reformer cycle management platform report 18–27% extensions in semi-regen run length and measurable recovery in reformate yield across the final quarter of the catalyst cycle, where traditional management leaves the most margin on the table.
Why Reformer Catalyst Cycles Underperform — and What the Data Reveals Before the Damage Is Done
The catalytic reformer is the margin engine of the gasoline-oriented refinery. Its Pt-Re or Pt-Sn bifunctional catalyst drives paraffin dehydrocyclization, isomerization, and hydrocracking reactions that transform low-octane naphtha into high-octane reformate and refinery-grade hydrogen. When that catalyst deactivates — through coke deposition blocking active metal sites, chloride leaching disrupting the acid function, or sintering reducing platinum dispersion — the unit operator responds by raising WAIT to compensate. The compensation works, until it doesn't. By the time reactor outlet temperatures are at their maximum and octane is still declining, the cycle is over and the unit is either heading offline for regeneration or operating below spec.
The analytics gap is structural. Most refinery process historians capture WAIT, reactor delta temperatures, recycle gas H₂/HC ratio, feed N+A content, and reformate RON at the lab — but these data streams are evaluated in isolation, on a shift-by-shift basis, against static alarm setpoints that do not account for where the unit is in its deactivation curve. iFactory's reformer analytics platform aggregates these parameters into a continuous catalyst activity model that tracks the actual deactivation rate against the expected trajectory for the current feedstock and operating severity — surfacing divergences days before they become irreversible activity losses.
The Three Deactivation Mechanisms That Erode Reformer Margin — and How iFactory Tracks Each One
Reformer catalyst deactivation is not a single phenomenon. It is the simultaneous progression of three distinct mechanisms — coke deposition, chloride imbalance, and thermal sintering — each operating on a different timescale, each requiring a different monitoring approach, and each capable of terminating a cycle prematurely if management falls behind the signal. iFactory's catalyst monitoring framework addresses all three with mechanism-specific analytics built on the actual deactivation physics of Pt-Re and Pt-Sn catalyst systems.
Coke Deposition Rate Monitoring and Laydown Prediction
Coke accumulates on catalyst surface during normal operation as a byproduct of cracking and dehydrogenation side reactions. The rate of coke laydown is a function of operating severity (WAIT), H₂/HC ratio in the recycle gas, feed endpoint and N+A content, and reactor pressure. As coke builds on active sites, WAIT must be raised to maintain target RON — the classic temperature compensation that marks the progression of catalyst deactivation. iFactory monitors the actual WAIT escalation rate against a predictive deactivation model calibrated to the specific catalyst charge and operating conditions, identifying when real-world coke accumulation is accelerating beyond the expected curve.
Chloride Balance and Acid Function Management
The reformer catalyst functions through a bifunctional mechanism: the metal function (platinum) drives dehydrogenation and hydrogenation, while the acid function (alumina surface promoted by chloride) drives isomerization and ring-closure reactions. Chloride balance — maintaining the correct H₂O/HCl equilibrium in the reactor environment — is critical to acid function stability. Too little chloride and the isomerization pathway weakens, reducing octane contribution. Too much moisture and chloride washes forward, leaving the catalyst under-chlorided and driving cracking side reactions. iFactory monitors recycle gas moisture, chloride injection rates, and reactor temperature profiles to detect acid function deviation 3–5 days before a lab-confirmed chloride shift.
Sintering Detection and End-of-Cycle Activity Projection
Sintering — the thermally driven migration and agglomeration of platinum crystallites on the alumina support — is an irreversible deactivation mechanism that reduces active metal surface area and cannot be corrected by regeneration. While coke is removed during regeneration and chloride balance can be restored, sintered platinum cannot be redispersed under standard regeneration conditions. Sintering rate is a strong function of temperature: brief excursions above design WAIT accelerate sintering exponentially, permanently reducing the activity of the regenerated catalyst compared to the prior cycle. iFactory tracks WAIT excursion events, cumulative thermal exposure, and cycle-over-cycle activity comparisons to quantify sintering progression and project realistic end-of-life for the current catalyst charge.
CCR vs. Semi-Regen: How iFactory Adapts Cycle Management to Each Reformer Configuration
The analytics requirements for continuous catalyst regeneration and semi-regenerative reformers are fundamentally different — in what is monitored, what the decision window looks like, and where the margin opportunity sits. iFactory maintains separate cycle management frameworks for each configuration, calibrated to the actual operating constraints and failure modes of each unit type. Book a Demo to see how each framework is configured for your specific unit.
| Management Parameter | Semi-Regenerative (SR) Reformer | CCR Reformer | iFactory Analytics Approach |
|---|---|---|---|
| Catalyst Regeneration Frequency | Once per run cycle; full unit shutdown required (6–18 months typical) | Continuous; catalyst circulates through regenerator at controlled rate | SR: cycle-end projection model. CCR: regenerator throughput optimization and coke-on-spent-catalyst inferential |
| Operating Pressure | High pressure (15–35 bar) to suppress coke formation and extend run | Low pressure (3–8 bar) — enabled by continuous regeneration; higher yield at same octane | Pressure-adjusted deactivation baseline maintained separately; H₂/HC ratio alarm thresholds calibrated per unit |
| Coke Management Strategy | Minimize coke make to extend cycle — severity and feed quality managed to slow deactivation | Control coke on spent catalyst entering regenerator — too little starves burnoff; too much risks overtemperature | SR: deactivation rate vs. target curve. CCR: spent catalyst coke inferential model with burn zone temperature monitoring |
| Chloride Balance Risk | Moderate — fixed bed, chloride relatively stable; moisture from feed the primary variable | High — continuous catalyst movement, oxychlorination in regenerator, chloride treater breakthrough on product side | CCR chloride treater breakthrough model; oxychlorination step quality index; downstream HCl trending |
| Key Margin Opportunity | Run length extension + late-cycle yield recovery at maximum severity | Catalyst circulation rate optimization + regenerator throughput maximization at target coke | Severity optimization dashboard updated continuously; regeneration cycle pacing recommendations automated |
| Turnaround Planning Integration | Predicted end-of-run date feeds directly into turnaround scheduling window | Regenerator maintenance windows and catalyst inventory management integrated | Both: cycle projection output feeds refinery scheduling system via OPC-UA or REST API integration |
iFactory's Reformer Cycle Analytics Workflow: From Raw Process Data to Cycle Optimization Decision
The analytical gap in most refinery reformer programs is not data availability — SCADA historians are storing reactor temperatures, flow rates, and pressure data at one-minute resolution. The gap is the absence of a system that converts that raw data into a continuous, calibrated assessment of catalyst state and remaining cycle value. iFactory's cycle analytics workflow closes that gap through a structured five-stage process, from data aggregation to actionable decision output. Book a Demo to see this workflow live on a refinery historian dataset.
The Financial Impact of Unmanaged Reformer Catalyst Deactivation
The economic case for AI-driven reformer cycle management is more straightforward than most refinery capital justifications — and it is routinely undersized because margin losses accumulate gradually and rarely show up as a discrete line item. A semi-regen reformer that terminates a cycle three weeks early due to unmanaged coke laydown acceleration does not generate an incident report. It generates a maintenance event, a scheduled shutdown, and a margin loss that is accepted as normal. A CCR unit running with suboptimal catalyst circulation rate because no one quantified the tradeoff between regenerator throughput and coke-on-spent-catalyst is not alarming anyone — it is simply underperforming on reformate yield and hydrogen production, shift by shift, against a potential that was never calculated. Book a Demo to see a margin recovery calculation for your unit configuration.
- Lost reformate production during unplanned regeneration outage: 10–21 days typical downtime
- Unplanned turnaround cost premium over scheduled maintenance: 35–60% cost increase
- Hydrogen production shortfall during outage — purchased hydrogen or hydrotreater throughput reduction
- Catalyst regeneration contractor mobilization on short notice: $120,000–$280,000 premium
- Late-cycle C5+ yield decline of 1.5–3.0 vol% at maximum WAIT — recoverable with severity management
- Hydrogen yield reduction in final 20% of cycle: 0.3–0.8 wt% on feed — incremental hydrotreater constraint
- RON giveaway from conservative severity management to avoid cycle termination risk
- Octane blending cost to supplement reformate below spec during late-cycle operation
- HCl breakthrough to downstream equipment — corrosion to heat exchangers and product treaters
- Chloride treater adsorbent overrun — replacement cost plus off-spec product diversion
- Under-chlorided catalyst: isomerization activity loss requiring increased WAIT to compensate — accelerates sintering
- Regulatory reporting requirements where HCl breakthrough affects environmental permit thresholds
- Each WAIT excursion event above design limit reduces next-cycle start-of-run activity by 0.5–2.0°C equivalent
- Cumulative sintering across 3–4 cycles reduces catalyst useful life by 15–30% versus managed operation
- Precious metal recovery value reduced by sintered platinum with lower dispersion at end of catalyst life
- Early catalyst replacement cost: $800,000–$2,400,000 for a mid-size reformer charge
Expert Perspective: Why Reformer Cycle Management Remains an Underanalytical Problem in U.S. Refining
In 24 years of process engineering work on catalytic reformers at integrated U.S. refineries, the single most consistent finding is that the management of catalyst deactivation is treated as a monitoring problem when it is fundamentally an analytics problem. Every reformer I have worked on had a historian. Every reformer had a WAIT trend chart on the control room screen. What very few of them had was a system that could tell you — continuously, not on shift handover, not at the weekly process review — whether today's deactivation rate was consistent with a 12-month cycle or a 9-month cycle, and what the 90-day severity management decision implied for run length and reformate yield at end of cycle. The chloride balance situation is even more acute. Most units are managing chloride injection on a formula that was set at startup and adjusted infrequently. The H₂O/HCl equilibrium in the reactor train shifts with every feedstock change, every moisture event from upstream, every seasonal change in cooling water inlet temperature affecting the recycle gas dew point — and nobody is tracking it as a continuous function. By the time the lab confirms a chloride problem, you have already paid for it in isomerization activity. The ROI from proper cycle management analytics is not marginal. On a unit running 300 days per year at 50,000 BPD, the margin between a managed cycle and an unmanaged one over three years is several million dollars — and that does not count the catalyst life extension from avoiding sintering events.
Conclusion: The Reformer Cycle Is Being Managed on Shift Averages When It Requires Continuous Analytics
The data required to manage a catalytic reformer cycle with precision — WAIT trajectories, reactor delta temperatures, recycle gas composition, feed N+A content, chloride injection rates, moisture levels — is already being generated by the instrumentation on every unit. What is missing is the analytical layer that converts those data streams into a continuously updated catalyst state model, a real-time deviation alert when coke laydown or chloride balance drifts off trajectory, and a forward-looking cycle life projection that gives the process engineering team and the planning function a 14–30 day window to optimize decisions around severity, feed selection, and turnaround scheduling.
iFactory's reformer catalyst cycle management platform delivers exactly that capability — across both CCR and semi-regen configurations, connected to your existing historian via OPC-UA or REST API, without requiring a DCS replacement or a new instrumentation program. The economic case for deployment is documented in every unit's own process history: the premature cycle terminations, the late-cycle yield losses, the chloride events that showed up first in the downstream corrosion record. The signals are there. The question is whether your analytics program is reading them.
Frequently Asked Questions
Accelerated coke laydown is typically caused by elevated severity (WAIT above design), high-endpoint naphtha feed, declining H₂/HC ratio in recycle gas, or a moisture event that disrupts chloride balance. iFactory detects it through anomalous WAIT escalation rate diverging from the expected deactivation curve — visible 3–7 days before octane shortfall occurs.
iFactory derives the chloride balance state from existing online moisture analyzers, chloride injection flow transmitters, and recycle gas composition data — combined with a reactor temperature profile signature that indicates acid function health. For units with online HCl analyzers, these are incorporated directly into the chloride treater breakthrough model.
Yes — iFactory's end-of-cycle projection model provides a continuously updated estimate of days remaining to maximum WAIT limit, with ±5–10 day accuracy at 30-day projection horizon under stable feed conditions. The projection is recalculated every shift and output to the turnaround scheduling team via dashboard or API feed.
iFactory benchmarks post-regeneration start-of-cycle WAIT against prior cycles to quantify activity recovery — a lower-than-expected SOC activity indicates incomplete coke burnoff, inadequate oxychlorination, or cumulative sintering loss. The regeneration quality index is documented for every cycle and used to recalibrate the next cycle's deactivation model.
For a unit with an existing SCADA historian and online moisture analyzers, integration and model calibration typically requires 6–10 weeks from kickoff to live cycle monitoring — including historian connectivity, deactivation model initial calibration on 12 months of historical data, and process engineer training. First cycle deviation alerts are typically generated within 30 days of go-live.



-rollout.png)

