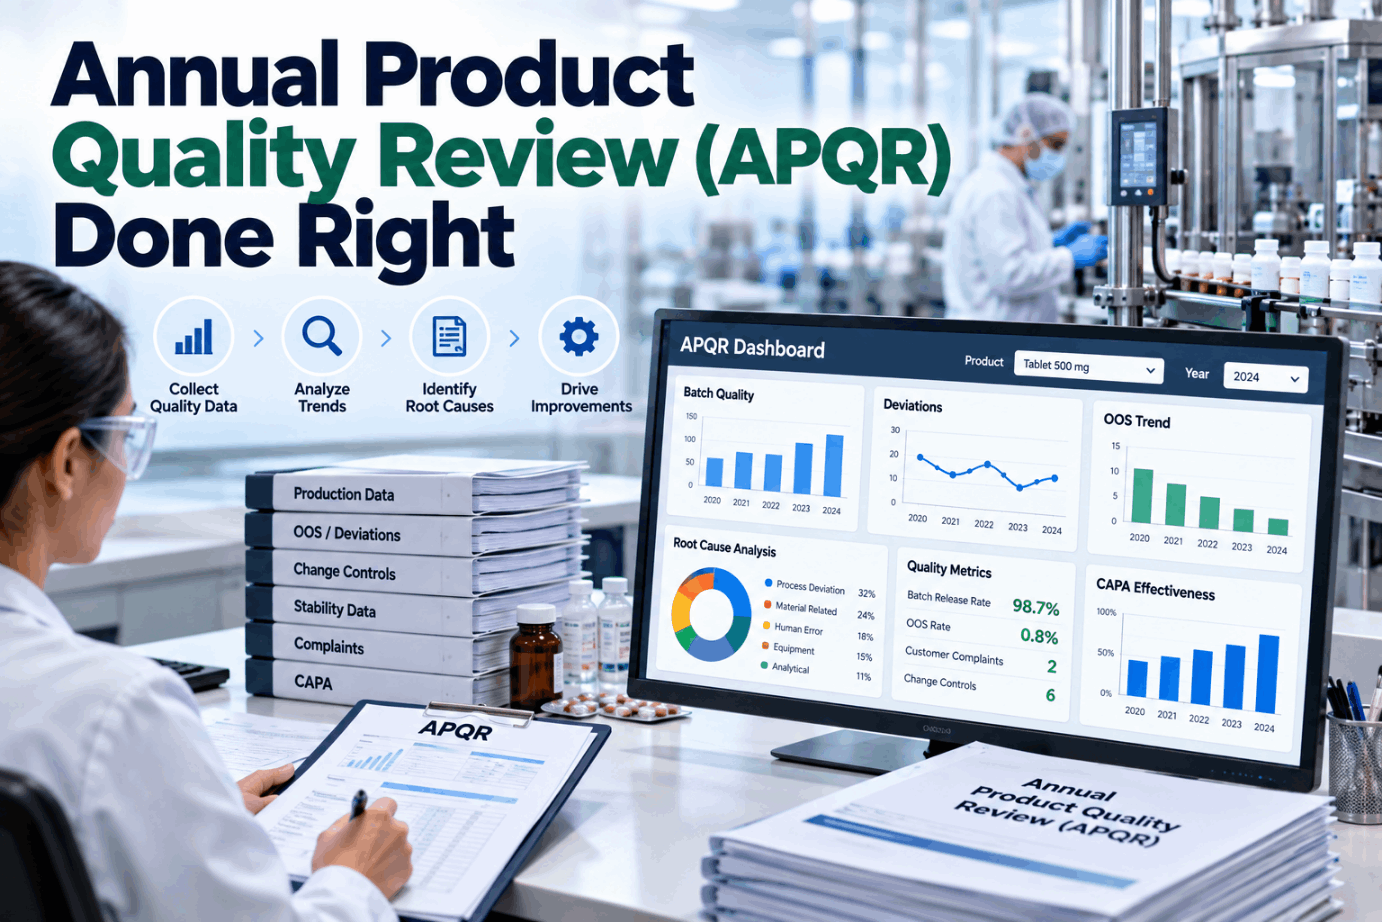
Every pharma site produces an Annual Product Quality Review, and many of them look the same: a thick document assembled over weeks from spreadsheets, LIMS exports and deviation logs, signed, filed and rarely opened again until the next inspection. That meets the letter of the requirement and misses its purpose. The review exists to find out whether a process is still consistent, whether specifications still fit, and what should change. This guide covers what EU GMP, ICH Q7 and US regulations actually require, how statistical trending turns the review into insight, a workflow that spreads the work across the year, and what a useful APQR looks like to the people who act on it. To see an APQR built from live data, book a short walkthrough.
Annual Product Quality Review (APQR) Done Right: From 200-Page PDF to Real Process Insight
Batch, lab, deviation and complaint data pulled together and trended all year, so the review shows what is changing and what to do about it.
Why Most APQRs Deliver Paper, Not Insight
The review is usually built backwards. Near the deadline, someone collects a year of data from separate systems: batch records, LIMS results, deviation and CAPA logs, complaint files, change controls and stability summaries. Most of the effort goes into finding, copying and formatting data. By the time the document is assembled, there is little time left for the part that matters: looking at the trends and deciding what they mean.
The result is predictable. Averages and pass rates are reported, but slow drifts inside specification go unnoticed. Deviations are listed but not grouped by cause, so recurring problems look like isolated events. Industry benchmarks compiled by IntuitionLabs put the typical rate at around one deviation per batch, with an average repeat rate of roughly 24% in BioPhorum data. A review that lists deviations without trending them misses exactly those repeats.
A good APQR does the collecting continuously and saves the annual effort for judgment. We can look at how your current review is assembled on a call.
What EU GMP, ICH Q7 and US Rules Actually Require
The names differ, APQR, PQR, APR, but the intent is the same: a regular, documented review that confirms the process is consistent and identifies improvements. The scope differs by region.
| Source | Scope | Key points |
|---|---|---|
| US 21 CFR 211.180(e) | Annual product review | At least annually; a representative number of batches, approved or rejected; complaints, recalls, returned or salvaged products and investigations; decide whether specifications or procedures need to change |
| EU GMP Part I, Chapter 1 | Product quality review | Regular, normally annual; starting materials, critical in-process controls and results, failed batches, deviations, changes, marketing authorization variations, stability, complaints, recalls and returns, CAPA effectiveness, equipment qualification and technical agreements |
| ICH Q7, section 2.5 | Product quality review for APIs | Regular reviews of API quality to verify process consistency, covering critical in-process controls, failed batches, deviations, changes, stability, returns, complaints, recalls and corrective actions |
| EU GMP responsibilities | Approval and follow-up | Manufacturer and marketing authorization holder evaluate results and decide on corrective and preventive action, with timely completion |
Many companies write one review that meets the broadest scope, which is usually the EU list. That is sensible, provided each element is analyzed rather than simply attached.
Where a site supplies several markets, map each element to its sources once, so the collection runs the same way every year. Our specialists can help build that map.
Turning Data Into Insight With Statistical Trending
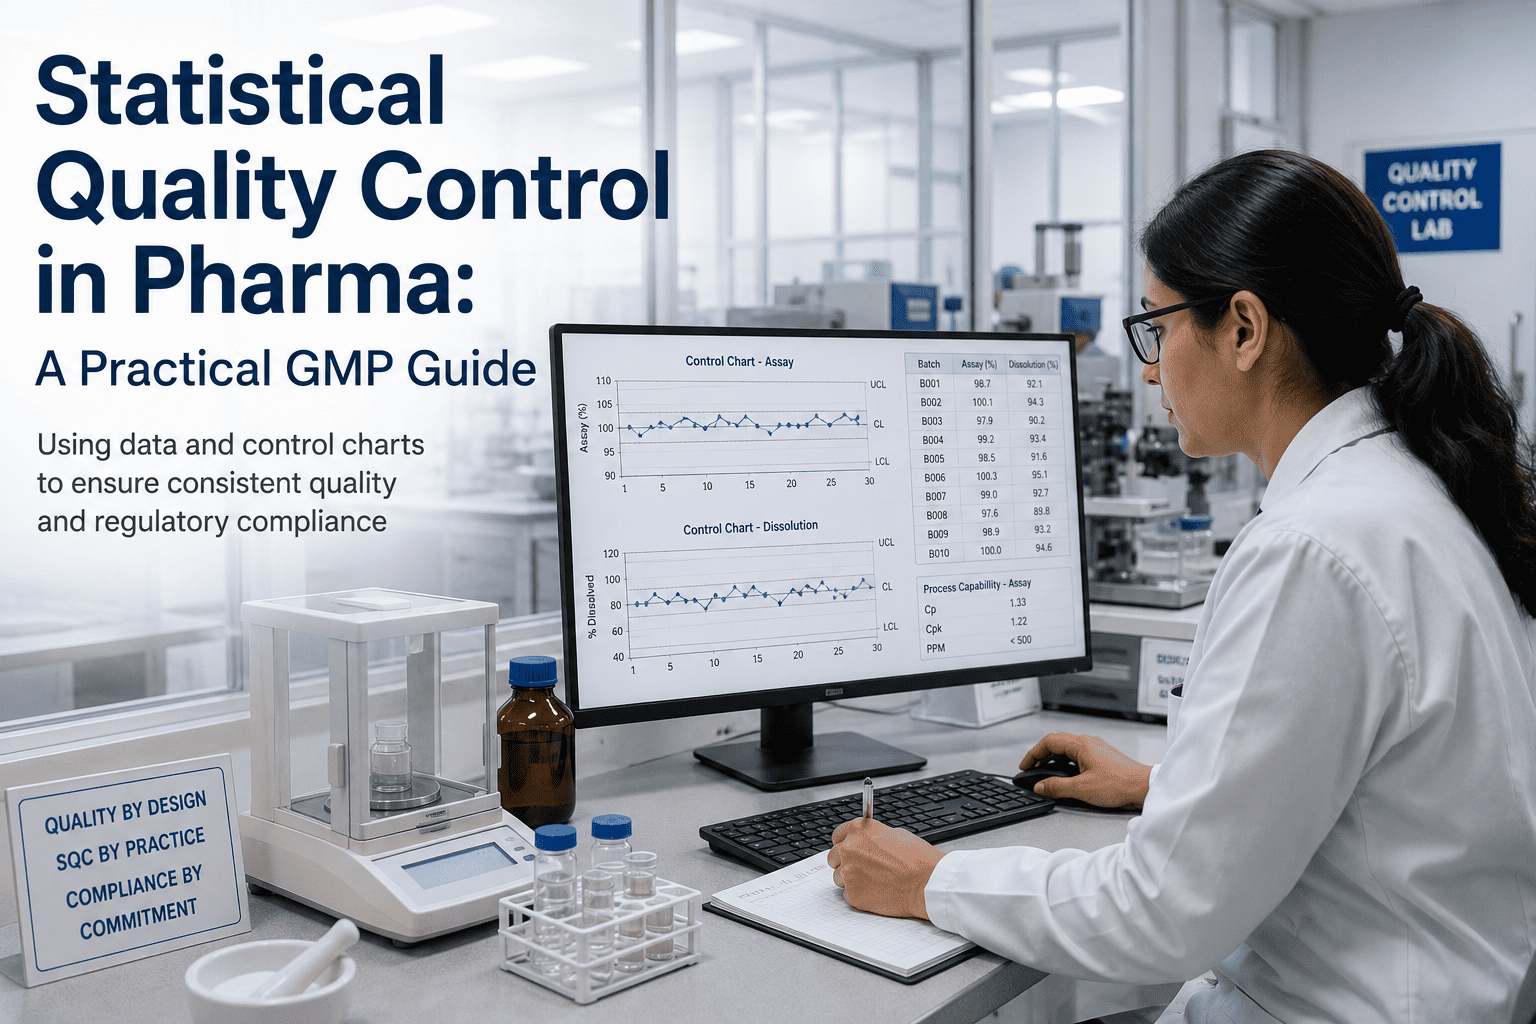
The difference between a report and a review is analysis. Statistical quality control tools show whether a process is stable and capable, not just whether batches passed.
Illustrative numbers. Tracking Cpk year on year shows whether capability is holding, improving or eroding.
Trending all year, rather than once at the end, means problems surface in weeks instead of months. That is the core of continuous process verification.
An APQR Workflow That Spreads the Work Across the Year
The annual document should be the summary of work already done, not the work itself. This workflow keeps the effort steady and the analysis fresh.
List products, elements, sources and owners once per product.
Pull batch, lab, deviation, complaint and change data as it is generated.
Review control charts and deviation Paretos with the product team.
Summarize the year, confirm conclusions and agree actions.
Raise CAPAs and change controls with owners and dates.
Sign off, record decisions and link actions to the next review.
Monthly or quarterly trending also makes the annual review meeting shorter and better. Instead of seeing data for the first time, the team confirms conclusions it already understands and spends the time on decisions.
Assigning a named owner to each review element prevents the last-minute scramble. Owner assignment is part of the review template.
What a Useful APQR Tells You
A good review answers practical questions. These are the signals that justify the effort.
A quality attribute moving steadily toward a limit while still passing, often linked to a material or equipment change.
Wider variation that raises the chance of future OOS results before any occur.
The same root cause appearing several times, showing a CAPA that did not work.
Shifts in results that start with a new supplier, lot or specification change.
Specifications too loose to detect real problems, or too tight for a capable process.
Complaint patterns that match internal trends, confirming a real effect on patients or users.
Signals are most useful when they arrive with context: the batches involved, the dates, the materials and equipment in use, and any related deviations or changes. That context is what lets the product team move from noticing a pattern to explaining it.
Each signal should lead to a decision: act, watch or accept with reason. A review that records those decisions is far more valuable to inspectors than one that only lists data. See signal reporting in a demo.
APQR Quality Checklist
Use this checklist to judge whether an APQR delivers insight or only paperwork.
If most boxes are ticked, the review is working. If not, the first fix is usually data collection, which is where software helps most. Ask our team for a gap review.
What Inspectors Look For in an APQR
Inspectors read APQRs to judge whether a site understands its processes and acts on what it learns. The same few themes come up again and again.
A review built from continuously collected data meets most of these expectations by design, because the analysis and its history already exist. We can review a recent APQR against these points in a gap check.
How iFactory Delivers an APQR That Drives Improvement
Batch, LIMS, deviation, complaint and change data linked by batch.
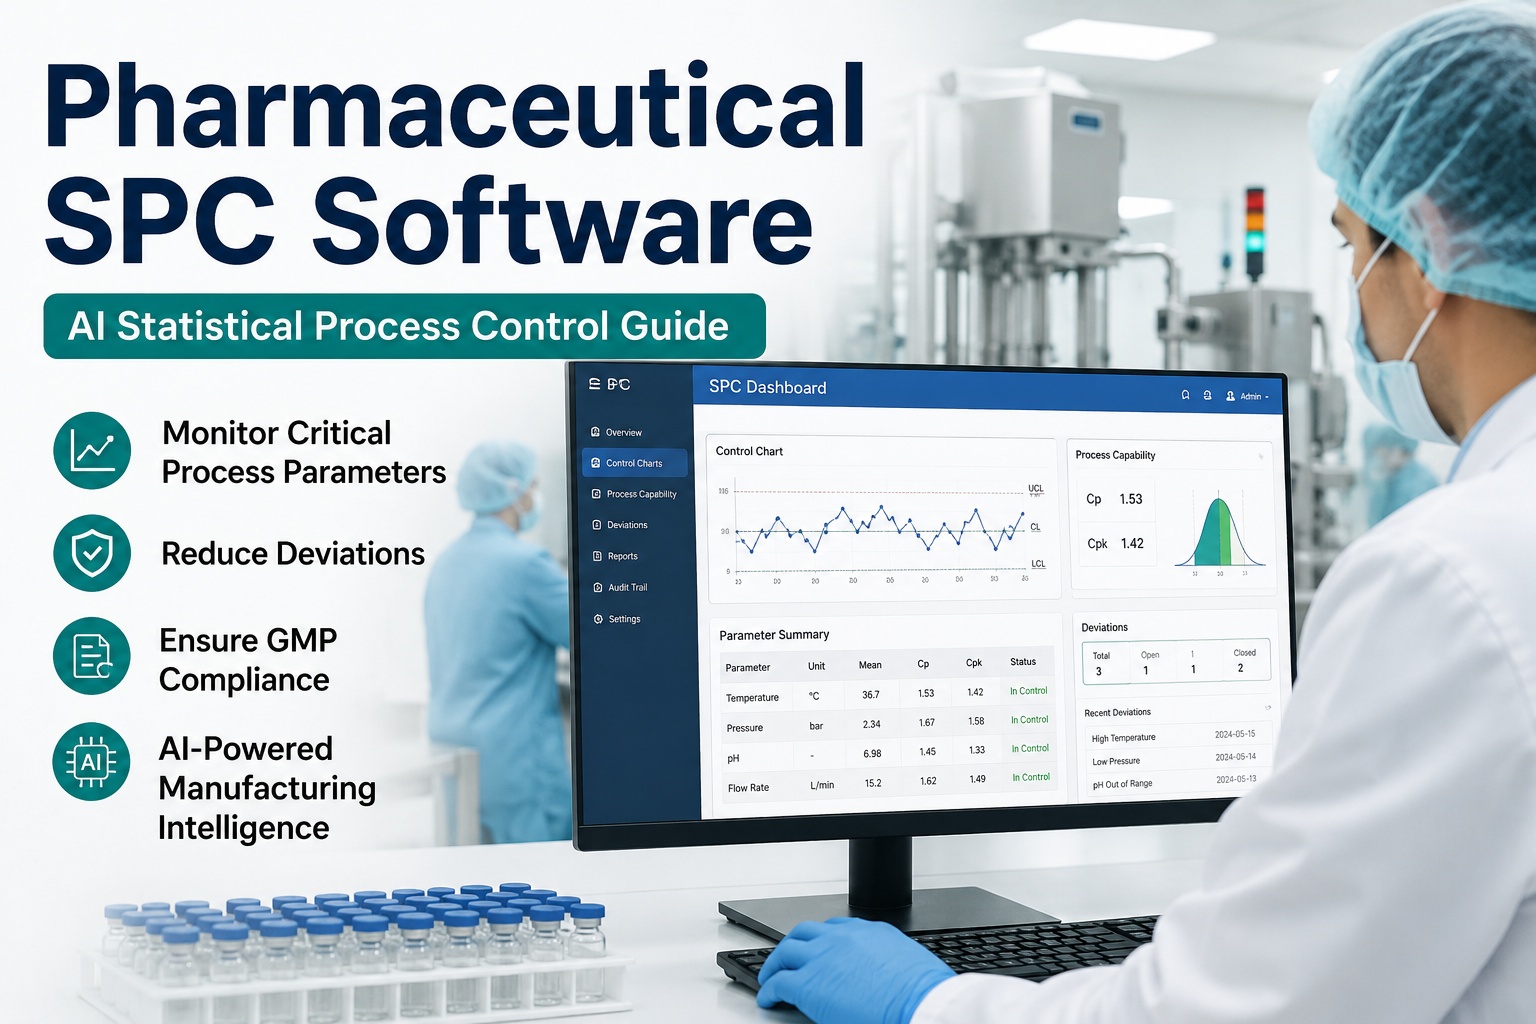
Control charts, trend rules and capability for every CQA.
Root cause Paretos and repeat detection.
Product team views with signals already flagged.
Annual report built from the year’s analysis.
CAPAs and changes linked to the signals that raised them.
It works with your existing LIMS, QMS and batch systems. Bring one product and we will show its year of data trended in a session.
Build Next Year’s Review From Live Data
Choose one product. We connect its batch, lab and quality data, trend the critical attributes and show what an insight-led APQR looks like before your next review is due.
Batch means drifting down across the last 14 batches while still inside specification. Trend starts after the second excipient supplier was approved.
A Quality Review Conversation
This exchange shows how a quality manager might prepare an APQR with iFactory.
iFactory ships as a pre-configured NVIDIA AI server, racked and ready with the quality trending and review analytics models loaded. Rack it, plug in power and Ethernet, and the AI is live on your network. Our scope covers sensors and data connections across quality, lab and production systems, PLC/SCADA, MES, LIMS and ERP integration, cabling and network setup, operator and quality team training, and 24×7 remote monitoring.
Server installed, sensors and system links live, historical batch, lab and maintenance records loaded.
Models trained on your own batches and equipment, then run in parallel on one area with your quality and engineering teams reviewing every output.
Rollout to the agreed areas under your change control and validation procedures, team training and 24×7 remote monitoring in place.
Software, server and integration come as one package. For pricing across your products, contact our sales team.
Frequently Asked Questions
It is a regular, usually annual, documented review of a product’s manufacturing and quality data to confirm the process is consistent, check that specifications remain suitable and identify improvements. The EU calls it a PQR, the US an annual product review.
Starting materials, critical in-process controls and results, failed batches and investigations, deviations, changes, marketing authorization variations, stability results, complaints, recalls and returns, CAPA effectiveness, equipment qualification status and technical agreements.
21 CFR 211.180(e) requires at least an annual review of a representative number of batches, approved or rejected, plus complaints, recalls, returned or salvaged products and investigations, to decide whether specifications or procedures need changing.
Control charts, trend rules and capability indices show drifts and falling capability while batches still pass, so problems are addressed before they become failures.
Data collection, trending and report assembly can be largely automated. Judgment, conclusions and approvals remain with the responsible people.
A first product can usually be connected and trended within a 6–12 week rollout, with more products added afterward. Plan it with our team.
Make the APQR the Most Useful Document You Write
iFactory trends your product data all year and builds the review from analysis already done, so every APQR ends with clear decisions instead of another binder.
Share of review inputs pulled straight from source systems instead of copied by hand.