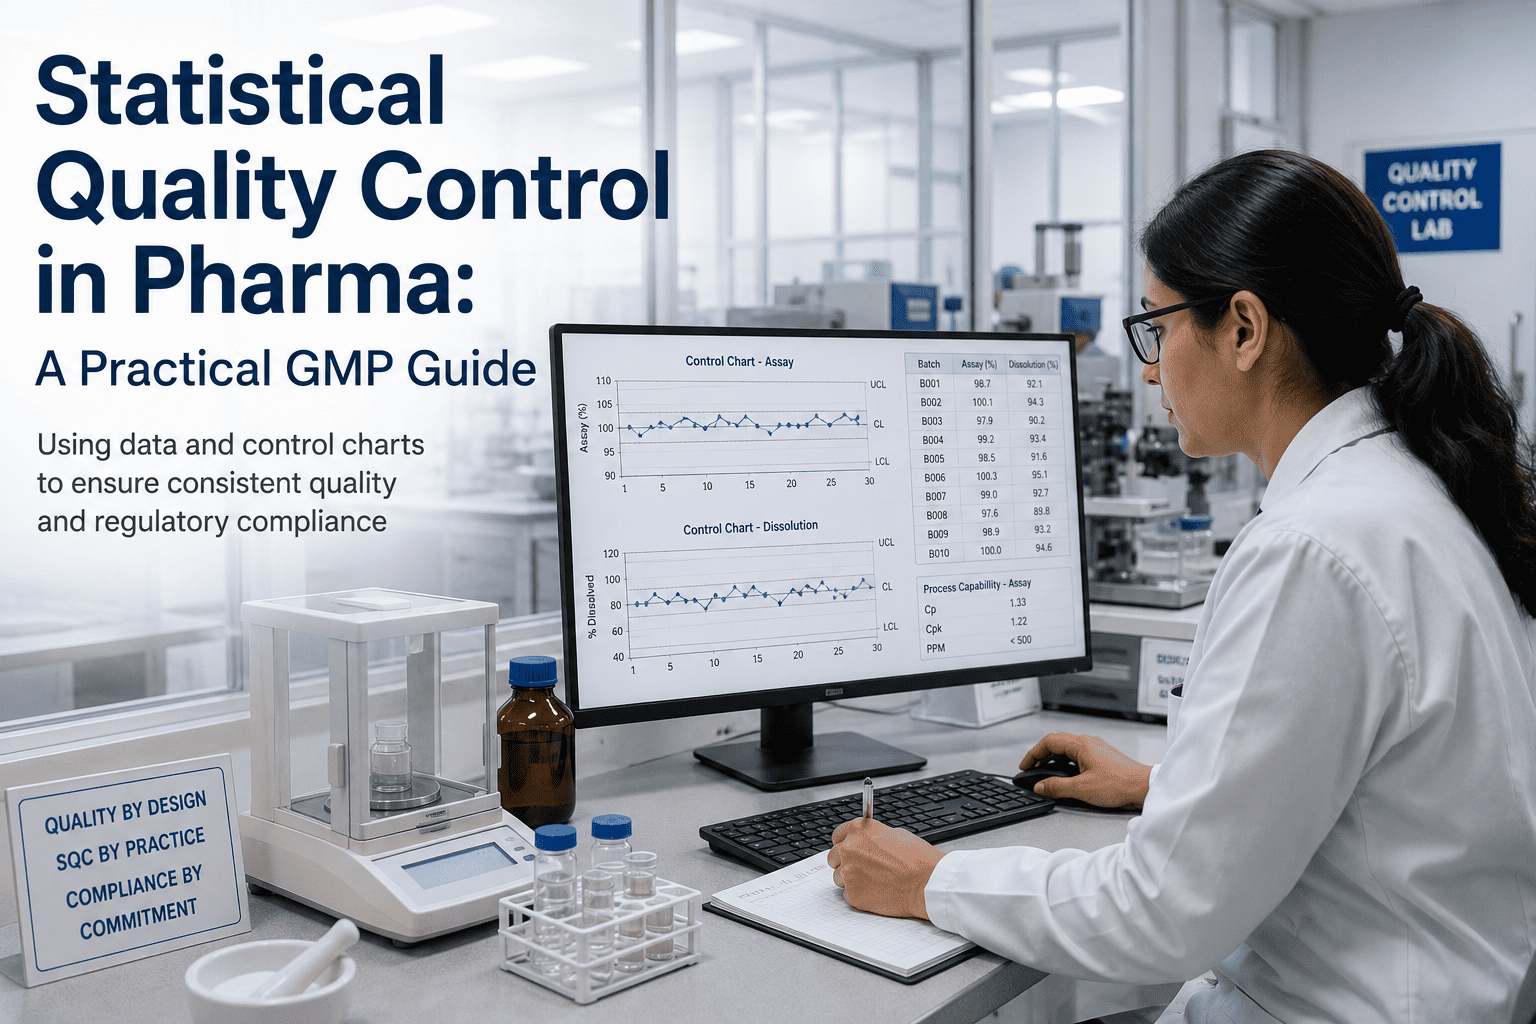
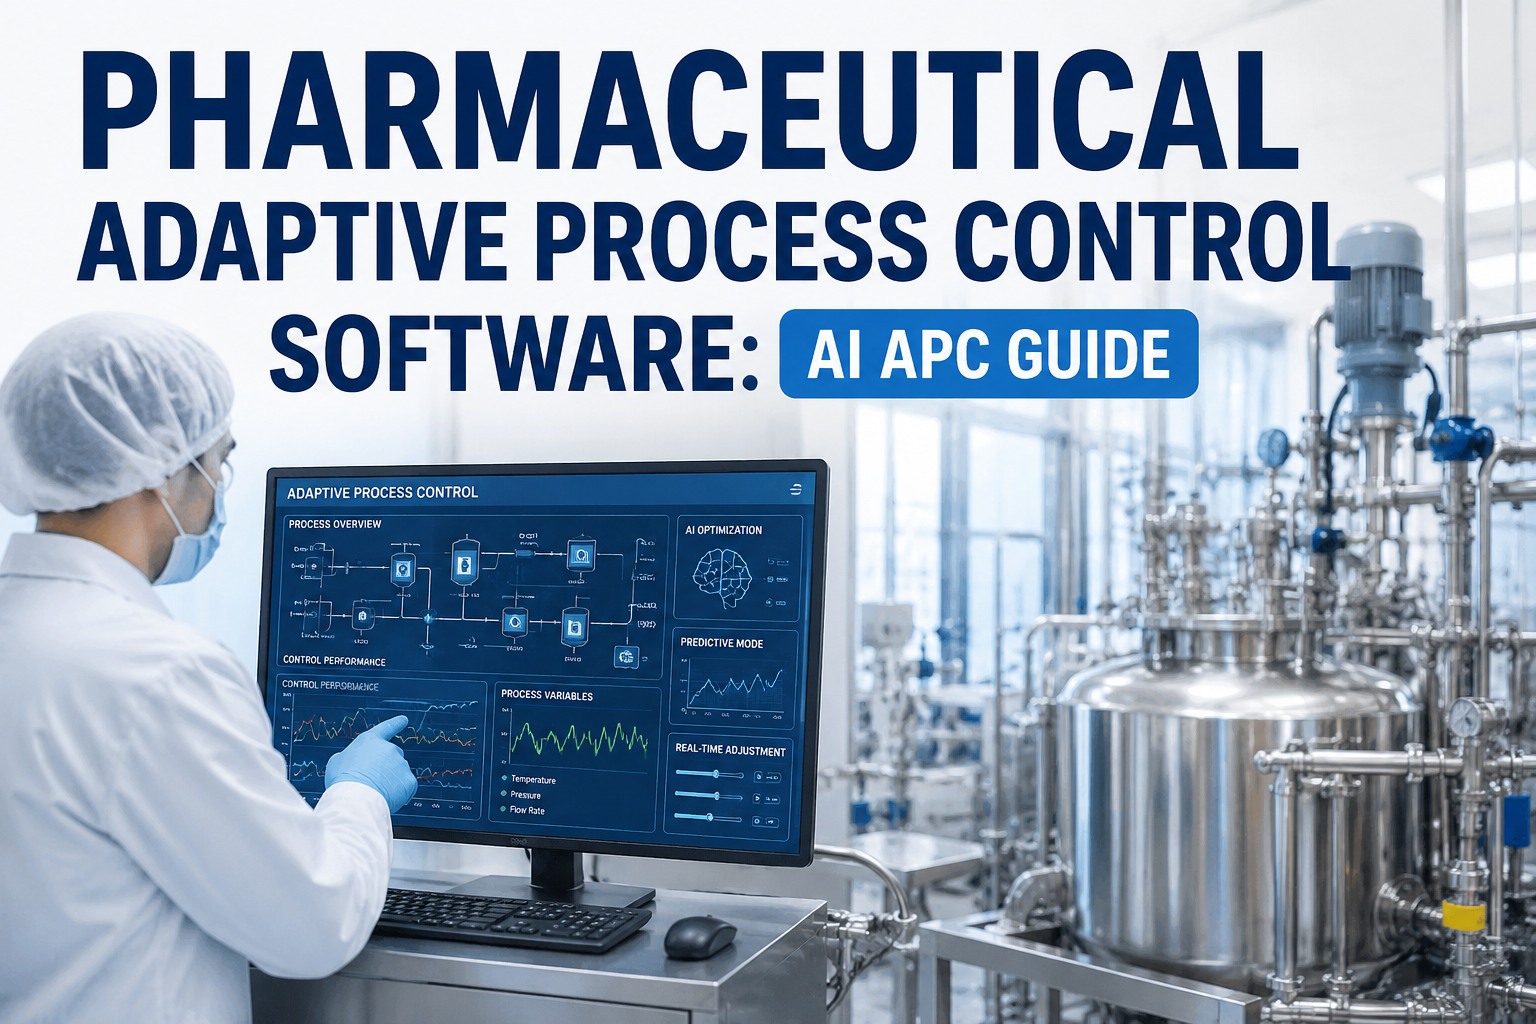
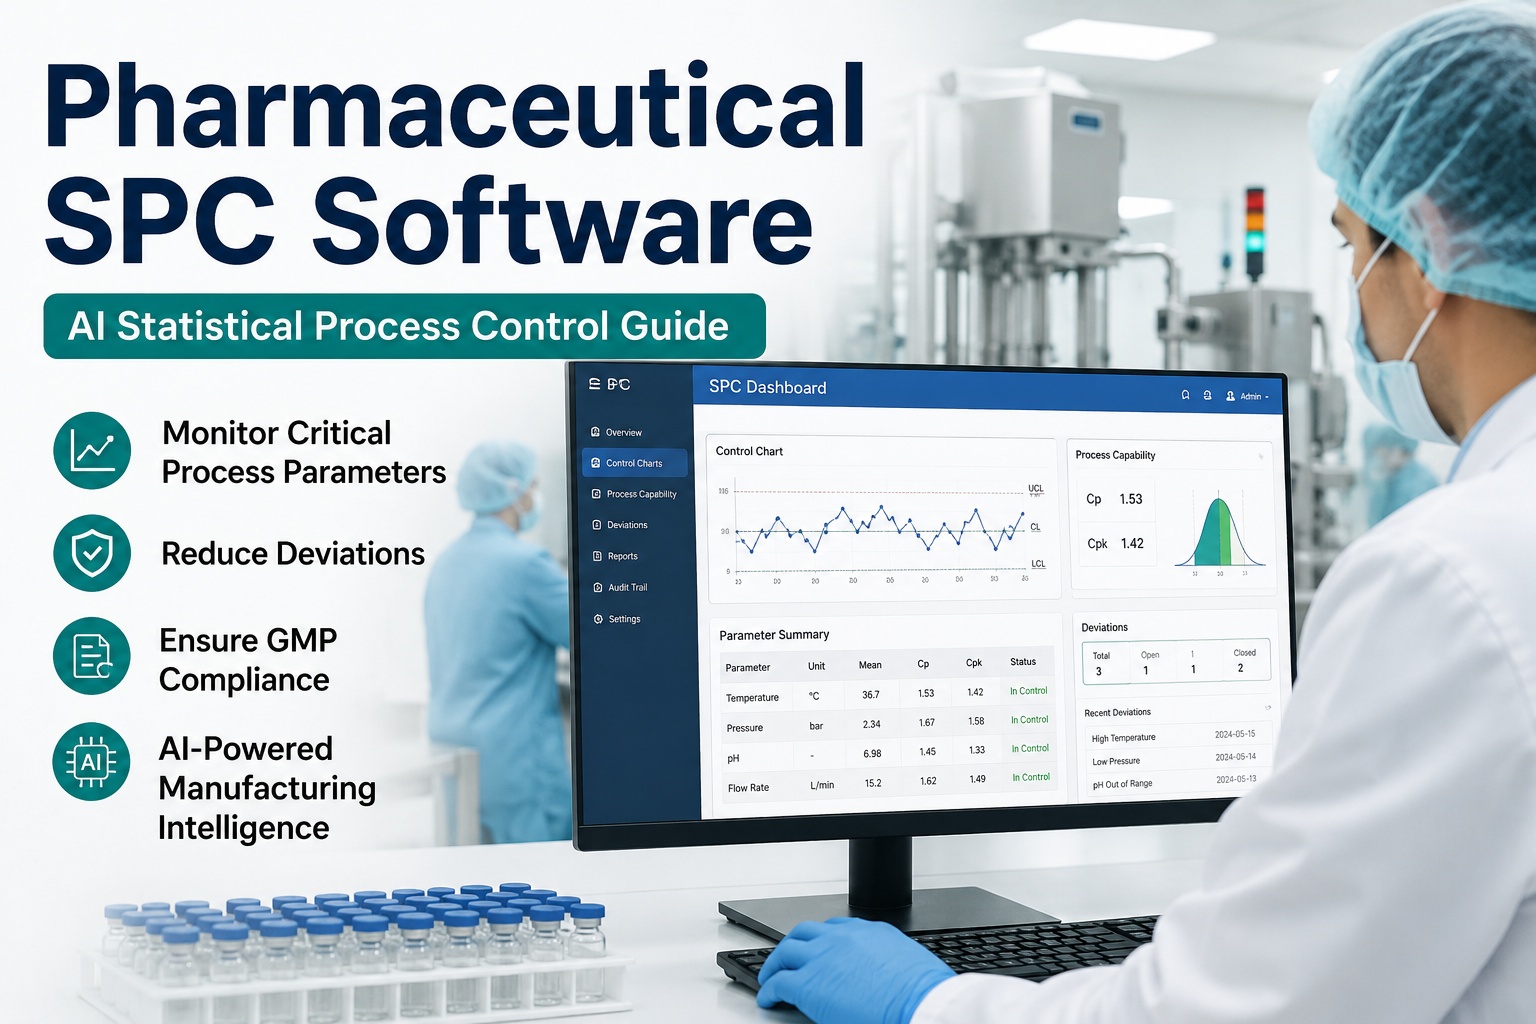
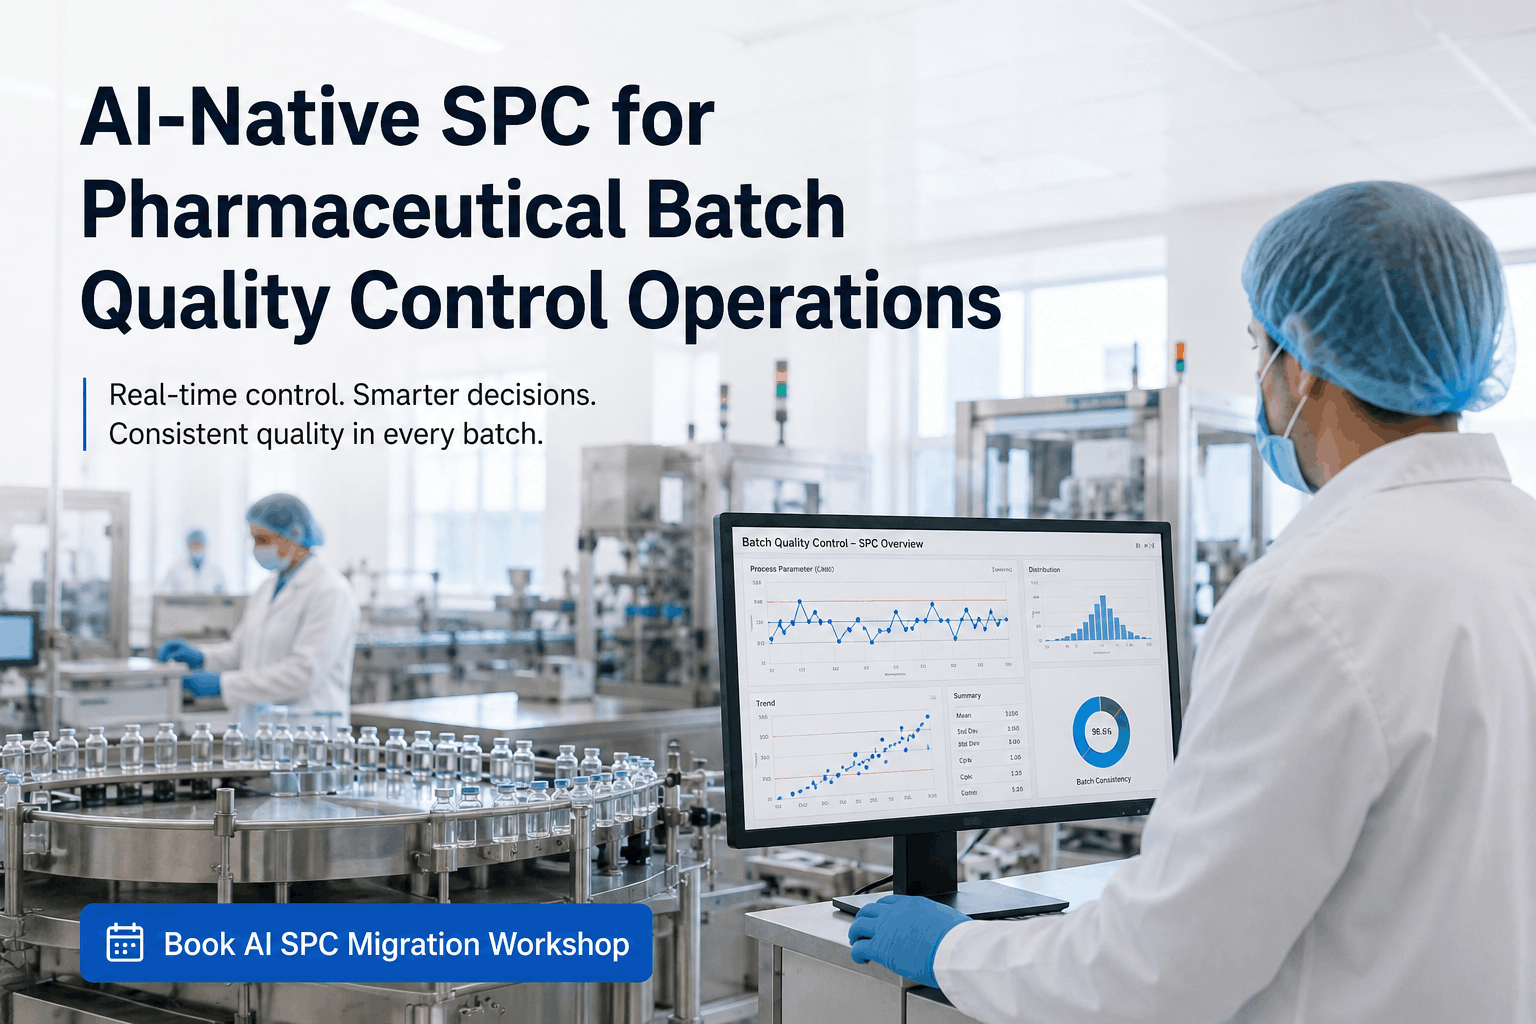
For a pharma quality team, statistical quality control is the difference between catching a process drifting toward failure and discovering it in a batch record after the batch is already made. SQC — and its core engine, statistical process control — turns lab and in-process data from a pile of pass/fail results into a live picture of whether the process is actually in control. Regulators expect it now, not as best practice but as requirement: the FDA's 2011 Process Validation guidance explicitly calls for statistical methods in continued process verification, EU GMP Annex 15 requires ongoing process verification, and ICH Q9 names control charts and process capability as tools within quality risk management. Done well, SQC distinguishes normal variation from a special-cause signal, flags a slow drift weeks before it reaches a specification limit, and produces the trended, documented evidence an FDA or EMA inspector expects to see. Done poorly — control limits set at spec, signals ignored, the wrong chart for the data — it generates findings instead of preventing them. This is a practical guide to the tools, charts, and workflows that make SQC work in a GMP environment. To see SQC running on live process data, book a demo.
SQC · PHARMACEUTICAL QUALITY CONTROL
Turn Lab Data Into Proactive Quality — and Evidence Inspectors Accept.
Statistical quality control lets a pharma quality team see the process, not just the result: separating normal variation from real signals, catching drifts before they breach a limit, and producing the trended capability evidence FDA and EMA now expect in continued process verification. This is the practical toolkit — the charts, the detection rules, and the GMP workflow that turns a chart signal into a documented investigation.
1.33
Minimum Cpk expected for established pharma processes
1.5+
Cpk target for critical quality attributes
±3σ
Where control limits sit — the voice of the process
Stage 3
CPV, where FDA explicitly requires statistical methods
SQC, SPC, and Why They Matter to a Quality Team
Statistical quality control is the broad discipline of using statistics to monitor and control product and process quality; statistical process control is its most-used engine — control charts and capability indices applied to a running process. The reason it matters isn't academic. Every process varies, and the entire job of SQC is to answer one question that a pass/fail result can't: is this variation the normal, expected noise of a stable process, or is it a signal that something has changed? Confuse the two and a quality team either chases phantom problems or misses real ones, and both are expensive in a GMP environment.
Common Cause vs Special Cause
Common-cause variation is the inherent, random noise of a stable process — it's expected and requires no action. Special-cause variation is a signal that something specific changed: a material lot, a calibration drift, a worn part. SQC exists to tell them apart, because reacting to common cause as if it were special ("tampering") makes a process worse, while ignoring special cause lets a real problem run.
A State of Control, Continuously
Regulators require a process to remain in a validated state across its entire commercial life — not just pass three validation batches once. SQC is how you demonstrate that continued state of control: collecting parameter data every batch, trending it against statistical limits, and calculating capability at defined intervals to catch drifts and shifts before they become failures.
Proactive, Not Post-Mortem
A specification result tells you whether a batch already made passed or failed. A control chart tells you the process is trending toward the edge while there's still time to act. That shift from post-mortem to early warning is the whole value: catching a moderate shift in tablet weight, fill volume, or assay before it reaches the action limit rather than after.
Evidence, Built In
SQC doesn't just improve control — it produces the documented, trended record that regulators expect. Control charts, capability indices, and investigated signals feed directly into Annual Product Reviews and Product Quality Reviews, so the same activity that keeps the process healthy also assembles the inspection evidence, rather than being reconstructed at review time.
The Regulatory Basis: What FDA and EMA Actually Require
SQC in pharma isn't optional discipline — it's woven into the process-validation lifecycle both major regulators enforce. Both the FDA and EMA require a process to be shown in statistical control and capable, and both name statistical methods explicitly. Understanding exactly where the requirement lives is what lets a quality team defend its program in an inspection.
FDA
Process Validation Guidance & Stage 3 CPV
The FDA's 2011 Process Validation guidance frames validation as a three-stage lifecycle, and Stage 3 — Continued Process Verification — explicitly requires statistical methods. FDA expects a formally documented CPV program with SPC charts, capability indices, periodic trending reviews, and integration of that data into Annual Product Reviews, with no predetermined endpoint for the monitoring across a product's commercial life.
EMA
EU GMP Annex 15 & Ongoing Process Verification
EU GMP Annex 15 governs process validation and requires ongoing process verification to confirm the process stays in a validated state. The EMA framework aligns philosophically with the FDA's lifecycle model but differs structurally — for example, EMA explicitly requires a Validation Master Plan defining scope, responsibilities, and timelines, which is a common inspection focus point.
ICH Q9
Quality Risk Management
ICH Q9 names control charts and process capability among the statistical tools available within quality risk management, tying SQC directly to the risk-based thinking regulators expect throughout the product lifecycle. This places control charting not as a standalone QC activity but as part of how a facility identifies, evaluates, and controls risk to product quality.
The practical consequence is that SQC data is inspection material. Every out-of-control signal requires a documented investigation, regardless of what the root cause turns out to be — ignoring signals, dismissing them as "random," or failing to document the investigation reliably generates regulatory findings. A rule firing is not a deviation; it is a signal that warrants investigation, and the investigation record is what the inspector reads.
See SQC Running on Your Process Data
Bring a critical quality attribute and its recent batch data to the call. iFactory engineers will show the right chart for it, the detection rules that fit your sampling, and how a signal becomes a contextualized, documented investigation — with capability trending feeding your APR and PQR.
Choosing the Right Control Chart
The most common SQC mistake a quality team makes is picking the wrong chart for the data — and a mismatched chart doesn't just look wrong, it hides real shifts or invents false ones. The chart has to match two things: the type of data (measured versus counted) and the sampling strategy (individual points versus subgroups). Match the chart to how you sample and how you'll respond to a signal, not the other way around.
A real trap: using individual points where subgroups belong. An I-MR chart on data that should be subgrouped is often too noisy to detect a moderate mean shift, so the chart reads "stable" while the process quietly drifts — until incoming results start failing. Subgroup charts separate within-subgroup from between-subgroup variation and surface that shift immediately. Most programs start with Shewhart charts and add EWMA or CUSUM only for critical attributes where small shifts carry real cost.
The Distinction That Trips Everyone: Control Limits Are Not Spec Limits
This is the single most important — and most violated — concept in pharma SQC. Control limits and specification limits are different things with different sources, and confusing them defeats the entire purpose of a control chart. Setting control limits at the specification limits is a common FDA observation precisely because it turns a proactive early-warning tool into a delayed pass/fail check.
CONTROL LIMITS
The Voice of the Process
Control limits are calculated from the process data itself, typically at ±3σ from the center line, using at least 20–25 subgroups from a stable process. They describe how the process actually behaves — its natural, expected range of variation. When a point breaks a control limit, the process has changed, and that's true whether or not the result is anywhere near a specification.
SPECIFICATION LIMITS
The Voice of the Customer
Specification limits come from requirements — the registered limits, the pharmacopoeia, the customer. They define what's acceptable in the finished product, not how the process runs. A process can be perfectly in statistical control and still fail spec if it's not capable, or be well within spec while a control signal warns of a change. The two answer different questions.
Why it matters: if you set control limits at the spec limits, the chart only alarms when you're already out of specification — exactly the failure you were trying to prevent. Real control limits, tighter than spec, are what give the quality team lead time to investigate a drift while every batch is still passing. That gap between "process changed" and "product out of spec" is the entire value of SQC, and collapsing the two throws it away.
Detection Rules: Reading the Signal Beyond a Single Point
A single point outside the limits is the obvious signal, but most process changes announce themselves as patterns long before a point breaks a limit. Western Electric and Nelson rules divide the chart into zones — A, B, and C, with A nearest the limit — and look for the runs and clusters that indicate a special cause. The art is enabling the right rules for the timescale, because pharma SQC runs on two clocks at once.
A Run to One Side
Nine consecutive points on one side of the center line signals the process mean has shifted — a new material lot, calibration drift, or tool wear. It's often the earliest reliable sign of a sustained change, firing well before any single point approaches a limit.
A Sustained Trend
Six or more points trending steadily up or down catches gradual change — a slow pH drift, a temperature creep in a coating pan, a persistent humidity change in a granulator. These slow walk-downs are exactly what a single-point rule misses, and where a trend rule earns its place on a critical attribute.
The "Too Good" Signal
The under-rated rule: a run hugging the center line too tightly. A pharma process looks "too good" only when something is wrong — a stuck sensor, a sample line that lost flow, or values being recorded at target instead of measured. It's a data-integrity signal as much as a process one, and one inspectors care about.
Expanded Variance
Points spreading into the outer zones more than expected shows process variance has grown beyond its historical baseline — the signature of a maintenance event, a raw-material lot change, or two suppliers' material running on the same chart. It's a change in spread rather than center, and it needs its own detection.
Two disciplines keep the rules honest. First, match the rule set to the timescale: rules that work brilliantly within a single batch run can mislead across batches, and mismatching them is a leading source of false alarms. Second, don't over-rule — piling on every rule at once inflates false signals, and chasing "root causes" that turn out to be data-pipeline hiccups burns weeks. Enable the rules that fit the attribute and the sampling, and treat each firing as a question, not a verdict.
Process Capability: Cpk, Ppk, and What Inspectors Look For
Control charts tell you if a process is stable; capability indices tell you if a stable process is good enough to meet its specifications with margin. The two are sequential — you must demonstrate the process is in statistical control before a capability number means anything, because capability calculated on an unstable process is meaningless. This ordering is one of the first things an inspector checks.
Cp
Potential Capability
Cp measures the potential capability — how the spread of the process compares to the width of the specification, assuming the process is perfectly centered. It's the best case, ignoring where the process actually sits, so a high Cp with a poor Cpk tells you the process is capable but off-center.
Cpk
Actual Capability
Cpk reflects actual performance, accounting for both variation and centering. The industry minimum for an established process is 1.33; for critical quality attributes the target is 1.5 or higher. A Cpk barely at the limit tells an inspector the process has little margin and predicts future failures.
Ppk
Performance, Total Variation
Ppk captures total observed variation over a longer period, and is what's typically reported during PPQ, the process performance qualification stage. Where Cpk reflects short-term within-subgroup variation, Ppk reflects the full real-world spread — the honest number for how the process actually performed.
In a pre-approval inspection, the FDA probes the whole chain: were the statistics done correctly, was the data normal or properly transformed, was the process shown in control before capability was calculated, does it run with adequate margin or barely meet limits, and is capability stable or degrading over time. A marginal number isn't automatically a failure — but it demands a documented plan for what you'll do about it. Capability that's trending down without a response is the finding.
The SQC Workflow, From Signal to Documented Investigation
SQC only delivers if a chart signal reliably becomes a documented action. The workflow below is what turns statistics into GMP-compliant quality control — and where a manual, spreadsheet-based program most often breaks down, because signals get missed, context gets lost, and investigations get reconstructed after the fact.
1
Capture Clean Data
Pull parameter data automatically where possible — from the line, the lab system, the MES — to avoid manual transcription errors and the late-arriving data that makes a chart signal "out of control" while the process is fine. Data quality is the foundation; a false signal from a pipeline hiccup costs as much investigation time as a real one.
2
Establish Limits From a Stable Baseline
Calculate control limits from at least 20–25 subgroups of a demonstrably stable process — never from unstable data — and recalculate only on a documented re-qualification. These limits become the reference every future point is read against, so they must reflect the process at its genuine baseline.
3
Monitor With the Right Chart and Rules
Run each attribute on its correct chart with the detection rules matched to its timescale, updating as each new point arrives. Critical quality attributes carry the small-shift rules by default; the rule set stays lean enough to avoid false-alarm fatigue while sensitive enough to catch real change early.
4
Contextualize and Investigate the Signal
When a rule fires, the signal carries its context — which batch, which material lot, which operator, which equipment — so it points toward a root cause instead of just flagging a number. Every signal gets a documented investigation regardless of outcome, because the record itself is what an inspector reviews.
5
Trend Capability Into APR and PQR
Calculate Cpk and Ppk at defined intervals, trend them over time to catch slow degradation, and feed the charts, indices, and investigations directly into the Annual Product Review and Product Quality Review — so the monitoring that keeps the process healthy also assembles the regulatory record continuously.
What Changes for the Quality Team
A well-run SQC program changes the quality team's day from reacting to failures to preventing them — and from scrambling to assemble inspection evidence to having it always ready.
01
Catch Drifts Before They Fail
Real control limits and trend rules surface a shift while every batch is still passing, so the team investigates a drift with time to correct it instead of writing a deviation on an out-of-spec batch. Quality moves upstream, from disposition after the fact to intervention before the fact.
02
Fewer False Alarms, Less Wasted Time
Matching charts to sampling, keeping the rule set lean, and capturing clean data cuts the false signals that send a team chasing pipeline hiccups for weeks. The signals that do fire are more likely to be real, so investigation effort goes where it actually matters.
03
Signals Point to Root Cause
When a signal arrives tagged with its batch, material lot, operator, and equipment, the investigation starts from context rather than a bare number on a chart. That contextual link turns a control-limit violation into a focused root-cause inquiry, shortening investigations and strengthening the record.
04
Inspection Evidence Assembles Itself
Because charts, capability trends, and documented investigations feed the APR and PQR as they happen, the CPV evidence an inspector asks for is already built. The team stops reconstructing a year of statistics before a review and can show a continuous, trended state of control on demand.
How iFactory Enables Pharma SQC
SQC at scale needs more than a charting tool — it needs clean data, the right chart per attribute, contextualized signals, and a documented path to investigation and review. iFactory provides that layer, built for the GMP realities a pharma quality team works under.
1
Automated, Clean Data Capture
Process and lab data flow in automatically from the line and connected systems, removing manual transcription and the late-arriving data that produces false signals — so the charts run on trustworthy numbers from the start.
2
Right-Chart Selection and Live Limits
The correct chart is applied per attribute and data structure, control limits are calculated from stable baseline data and recalculated only on documented re-qualification, and charts update in real time as new points arrive.
3
Contextual Rule Detection
Western Electric and Nelson rules run continuously with the set matched to each attribute's timescale, and every signal arrives tagged with batch, material lot, operator, and equipment so it points straight toward a root-cause investigation.
4
Capability Trending and Review Integration
Cpk and Ppk are calculated and trended at defined intervals, and charts, indices, and investigations feed the Annual Product Review and Product Quality Review — keeping continued process verification evidence continuously inspection-ready.
Frequently Asked Questions
The questions pharma quality teams ask most often when implementing or maturing an SQC program.
What's the difference between SQC and SPC?
Statistical quality control is the broad discipline of applying statistics to monitor and control quality across products and processes, including acceptance sampling and capability analysis. Statistical process control is the most-used part of it — the control charts and capability indices applied to a running process to distinguish normal from abnormal variation. In everyday pharma use the terms are often used interchangeably, but the useful distinction is that SPC is the live process-monitoring engine, while SQC is the wider umbrella that also covers sampling plans and finished-product quality methods. Either way, control charts and capability indices are the core tools. To see them applied to your process,
book a demo.
Why can't we just set our control limits at the specification limits?
Because it defeats the entire purpose of a control chart, and it's a common FDA observation. Control limits are calculated from the process data — the voice of the process — and typically sit tighter than spec, so a signal fires when the process changes, while every batch is still well within specification. Specification limits are the voice of the customer and define finished-product acceptability. If you set control limits at spec, the chart only alarms once you're already out of specification — exactly the failure SQC is meant to prevent. The gap between "the process changed" and "the product is out of spec" is the lead time that lets you investigate and correct a drift proactively, and collapsing the two throws that away.
What Cpk value do we actually need to satisfy regulators?
The industry minimum for an established process is a Cpk of 1.33, and for critical quality attributes the target is 1.5 or higher; during process performance qualification, Ppk is typically reported to capture total observed variation. But the number alone isn't the whole answer — an inspector also checks that the process was demonstrated to be in statistical control before capability was calculated, that the data was normal or appropriately transformed, and that capability is stable rather than degrading over time. A marginal Cpk isn't an automatic failure if you have a documented plan to improve it; what generates a finding is capability trending downward with no response. Treat the index as a managed metric, not a one-time pass mark.
A control chart rule fired — is that a deviation we have to report?
A rule firing is a signal that warrants investigation, not automatically a deviation. The correct response is to investigate what the signal means and document that investigation regardless of what the root cause turns out to be — even if the conclusion is a false alarm from a data-pipeline issue. Whether it escalates to a formal deviation depends on what the investigation finds about product impact. What reliably generates a regulatory finding is the opposite: ignoring signals, dismissing them as "random," or failing to document the investigation at all. So the signal triggers a documented inquiry every time; the deviation determination comes from the inquiry's findings, and the record of that reasoning is exactly what an inspector wants to see.
How do we avoid drowning in false alarms when we turn on detection rules?
Two disciplines control false alarms. First, don't over-rule — enabling every Western Electric and Nelson rule on every chart inflates false signals dramatically, so apply the rules that fit each attribute and reserve the small-shift rules for critical quality attributes where they earn their keep. Second, match the rule set to the timescale: pharma SQC runs both within a single batch and across batches, and rules that work well on one clock mislead on the other. Beyond the rules themselves, clean data matters enormously, because late-arriving or mistimed data makes a stable process look out of control and sends teams chasing pipeline hiccups for weeks. Lean rules plus trustworthy data is what keeps signals meaningful. Contact
iFactory support to tune a rule set for your attributes.
FROM PASS/FAIL RESULTS TO A LIVE STATE OF CONTROL
Make SQC the Quality Team's Early-Warning System — and Its Inspection Evidence.
The right chart per attribute, control limits that actually warn you early, detection rules matched to your sampling, and capability trending that feeds your APR and PQR — with every signal contextualized and every investigation documented. Catch the drift before the batch, and walk into any inspection with a continuous state of control already on the record.