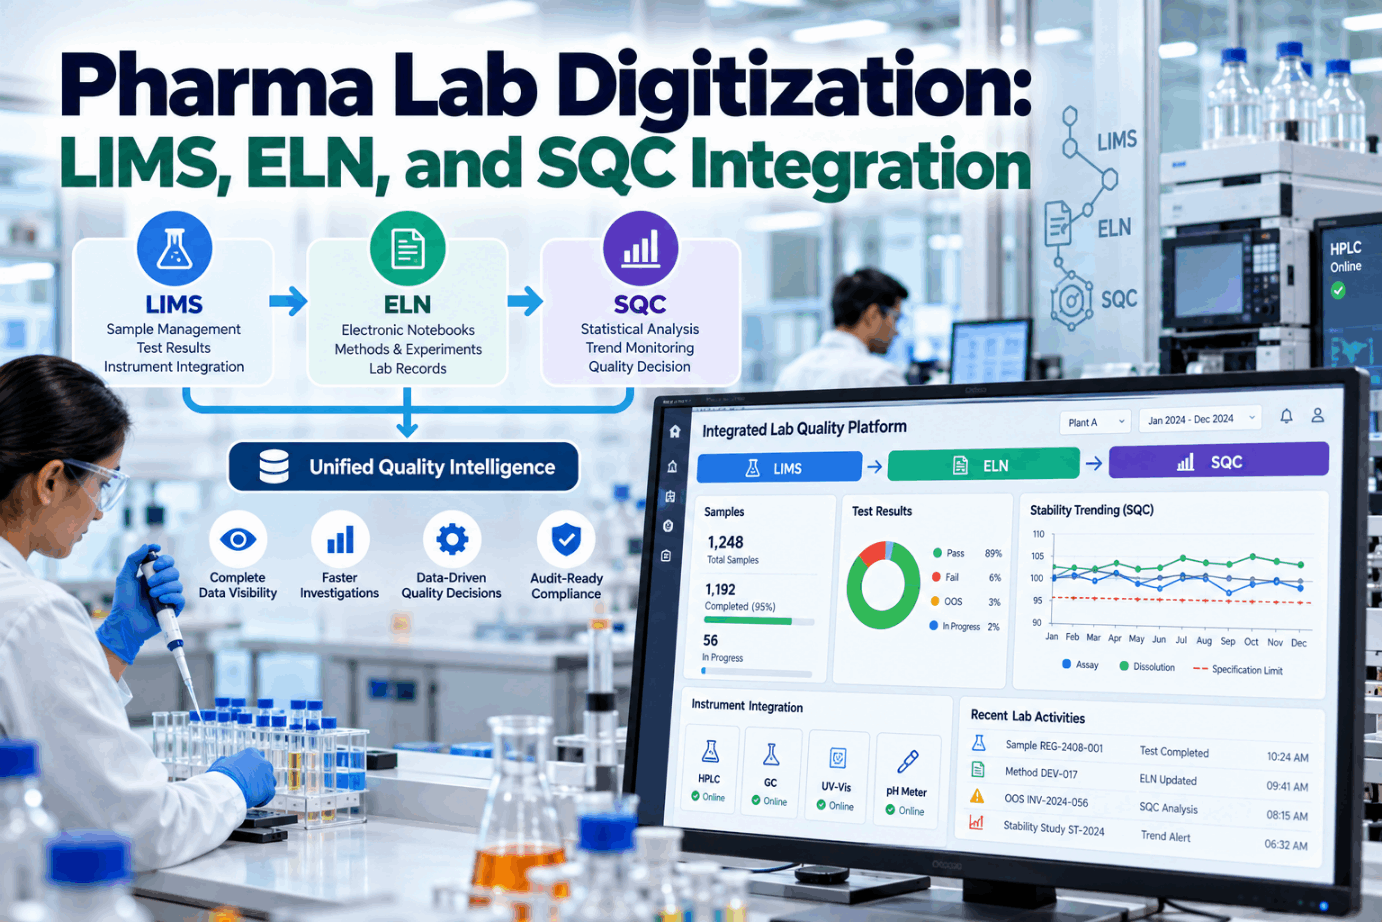
Most pharma labs are already digital in parts. There is a LIMS for samples and results, an ELN for methods and experiments, a chromatography data system for raw data, and a statistics tool somewhere for trending. Each works. Together, they often do not. Results are re-typed, context is lost between systems and a question such as whether an out-of-trend assay relates to a process change can take days to answer. This guide explains what each system does, why isolated systems give data but not insight, how to connect them into a single quality intelligence layer, and how to keep data integrity intact while doing it. To see an integrated lab data flow, book a short walkthrough.
Pharma Lab Digitization: Integrating LIMS, ELN and SQC Into One Quality Intelligence Layer
Instrument, lab, process and quality data connected by batch and method, so trends, investigations and reviews draw on one version of the truth.
Why Isolated Lab Systems Give Data but Not Insight
Each lab system was usually bought to solve one problem. The LIMS managed samples and results. The ELN replaced paper notebooks. The chromatography data system controlled instruments and kept raw data. SQC software arrived later, often fed by exports. Each is valuable, but the connections between them are frequently manual: results copied, files exported, batch numbers typed again.
Every manual transfer is a data integrity risk and a delay. The FDA’s 2018 guidance on data integrity expects data to be attributable, legible, contemporaneously recorded, original or a true copy, and accurate, and it states plainly that recording data on paper that is later discarded after transcription is not acceptable. Isolated systems also hide relationships: the lab sees an assay trending up, production sees a process change, and nobody connects the two until an investigation forces it.
Integration does not mean replacing systems that work. It means connecting them so data moves once, with context. We can map your current lab data flow on a call.
What Each Lab System Should Own
Clear ownership stops systems competing to be the record for the same data. A practical split looks like this.
The last role is the one most labs are missing. It is where SQC lives, and where lab, process and quality data finally meet. It is the layer iFactory adds, as shown in a demo.
How the Integrated Data Flow Works
An integrated lab keeps each system in its role and connects them through defined interfaces. Data flows once, from its origin, carrying the identifiers that link it to everything else.
Measurement captured with metadata and audit trail.
Reportable result calculated and reviewed in the system of record.
Batch, material, equipment and process data joined from MES.
Results charted with trend rules and capability, per method and product.
Out-of-trend signals raised to QMS with the linked evidence.
Identifiers are the glue. Batch number, sample ID, method version, instrument ID and material lot must be consistent across systems, or the joins fail. Agreeing them, and cleaning up legacy mismatches, is often the largest part of an integration project.
Interfaces should be read-only wherever possible from the intelligence layer, so systems of record stay the single source of truth. Our engineers design interfaces this way by default.
Keeping Data Integrity Intact Across Systems
Integration must strengthen data integrity, not weaken it. These principles apply to every interface.
US Part 11 and EU GMP Annex 11 set the rules for electronic records and computerised systems. Integration projects should follow your existing validation approach, and our team plans interfaces around it.
Point-to-Point Links Versus an Integration Layer
Labs typically connect systems in one of two ways. The choice affects cost, validation effort and what becomes possible later.
- Each pair of systems linked directly
- Quick for the first one or two links
- Number of interfaces grows with every system
- Each link validated and maintained separately
- Analysis still happens in exports
- Hard to add process context
- Systems connect once to a shared layer
- More planning at the start
- Adding a system means one new connection
- Validation focused on fewer, standard interfaces
- Analysis runs on linked, current data
- Lab, process and quality data meet in one place
Many labs keep a few direct links, such as instruments to LIMS, and use an integration layer for everything that needs cross-system context. That balance keeps critical record paths simple while opening up analysis.
If your site already runs a data historian or data lake, the integration layer can build on it rather than duplicate it. We assess that during the site review.
What Becomes Possible Once Lab Data Is Connected
Connected data turns routine lab work into early warning and faster investigation.
Results trending toward limits are flagged before they fail, with process context attached.
OOS and OOT investigations see batch, equipment and material history in one view.
System suitability, column lots and instrument performance trended over time.
Degradation trends compared across batches, sites and conditions.
Sample backlog and turnaround times visible for planning.
Product reviews and continued process verification draw on the same linked data.
Each outcome reduces time spent searching for data and increases time spent understanding it. See connected investigations in a session.
A Practical Lab Digitization Roadmap
Integration projects succeed when they deliver value in steps rather than waiting for a full platform.
List systems, owners, identifiers and every manual transfer between them.
Agree batch, sample, method and material IDs and clean the worst mismatches.
Start with a high-value path, such as release testing results into SQC with batch context.
Turn on trend rules for critical methods and route signals to QMS.
Add stability, method performance and process data for more products.
Measure the baseline before starting: how many manual transfers, how long investigations take, how often exports are used.
Involve QA early in each step. Their agreement on identifiers, interfaces and validation scope avoids rework later and keeps the project aligned with how records are reviewed on site.
The first flow usually pays for the effort by removing a manual step and giving the lab its first cross-system trend. That builds support for the next steps.
Most labs see the first connected trends within weeks. Ask our support team for a sample roadmap.
Where Lab Time Goes Before Integration
The cost of disconnected systems is easy to underestimate because it is spread across many small tasks. A simple estimate makes it visible.
Illustrative numbers. Replace them with your own result counts and timings to size the benefit.
Time is only part of the case. Each manual transfer is also a point where an error can enter a GMP record, and each export used for trending is a copy that can fall out of step with the system of record. Removing them improves data integrity as well as productivity.
Investigation time is the other large saving. When batch, material and equipment history sit beside the lab result, much of the searching disappears. We can help you estimate both for your lab in a scoping call.
How iFactory Delivers the Quality Intelligence Layer
LIMS, ELN, CDS, MES and QMS data linked without replacing systems.
Batch, sample, method and material identifiers reconciled.
Control charts, trend rules and capability per method and product.
Signals raised with linked process and lab context.
Batch, equipment and material history in one place.
Every derived value traceable to its source record.
It follows your validation approach and keeps systems of record unchanged. Bring one lab data flow and we will map it in a workshop.
Connect One Lab Data Flow and See the Difference
Pick a high-value flow, such as release testing for one product. We connect it with batch context, turn on SQC trending and show the first cross-system signals within the pilot.
Results trending toward the upper limit on column lot C-117 only. Process data for the same batches is stable.
An Out-of-Trend Result With Context
This exchange shows how a lab manager might use the integrated view.
iFactory ships as a pre-configured NVIDIA AI server, racked and ready with the lab data integration and SQC models loaded. Rack it, plug in power and Ethernet, and the AI is live on your network. Our scope covers sensors and data connections across labs, quality and production systems, PLC/SCADA, MES, LIMS and ERP integration, cabling and network setup, operator and quality team training, and 24×7 remote monitoring.
Server installed, sensors and system links live, historical batch, lab and maintenance records loaded.
Models trained on your own batches and equipment, then run in parallel on one area with your quality and engineering teams reviewing every output.
Rollout to the agreed areas under your change control and validation procedures, team training and 24×7 remote monitoring in place.
Software, server and integration come as one package. For pricing across your labs, contact our sales team.
Frequently Asked Questions
A LIMS manages samples, tests, specifications, results and certificates in a structured way. An ELN records methods, experiments, investigations and observations, often in a more flexible format. Most labs need both.
SQC needs clean, timely results with context. Integration removes manual exports, adds batch and process data and lets trends and out-of-trend alerts run on current information.
Done well, it improves data integrity by removing transcription, keeping raw data in systems of record and making every derived value traceable. Interfaces should be validated as part of your computerised system approach.
No. Most labs keep their LIMS, ELN and CDS and add an integration and analytics layer that links their data and provides trending and alerts.
In the US, 21 CFR Part 11 for electronic records and signatures and the FDA’s data integrity guidance. In the EU, GMP Annex 11 for computerised systems. Both expect audit trails, access control and validated systems.
A first data flow is typically live within a 6–12 week rollout, with more flows added in stages. Plan it with our engineers.
Turn Lab Results Into Explained Results
iFactory links your LIMS, ELN, CDS and process data into one quality intelligence layer, so trends come with context and investigations start with evidence.
Each manual step removed is one less transcription and one less data integrity risk.
.png)