Somewhere between the original construction drawings and today's control room sits a plant that no longer matches its own paperwork. A tie-in added during a 2013 outage, a support bracket relocated because a conduit run changed, a pump swapped for a different footprint model — none of it made it back onto the P&ID. Studies of built facilities consistently find that roughly thirty percent of a facility's actual elements differ from what the original drawings show, and every one of those differences is a clash, a delay, or a safety incident waiting for the next outage crew to discover it in the field. iFactory's 3D laser scanning and as-built modeling captures your plant exactly as it stands today — not as it was designed — so the next outage is planned against reality instead of paper. See it mapped against your own facility with a Book a Demo.
Your Drawings Say One Thing. Your Plant Says Another.
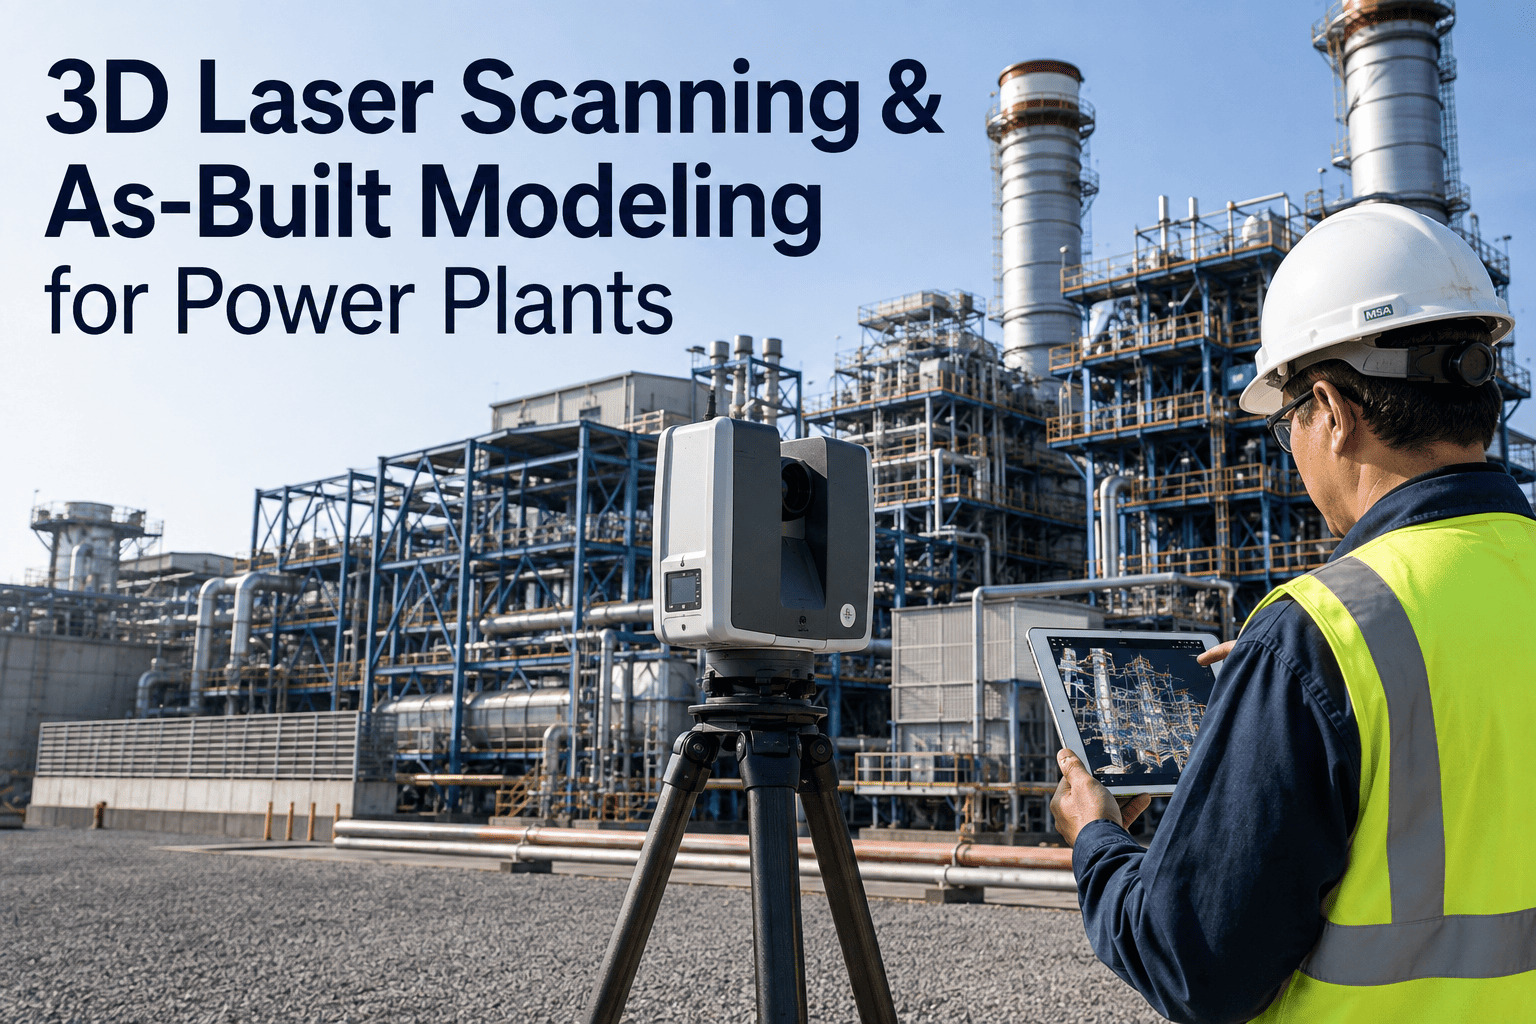
iFactory's 3D laser scanning captures your facility as a millimeter-accurate point cloud and converts it into an as-built model your engineers can trust — for clash detection, modification planning, and outage scope that doesn't fall apart on day one of execution, no matter how many undocumented changes have accumulated since commissioning.
How A Plant Slowly Stops Matching Its Own Drawings
No single event makes the drawings wrong. It happens one modification at a time, across years, until the gap between paper and reality is wide enough to derail an outage plan. Each of the changes below is routine on its own — the danger is that they accumulate silently, with nobody assigned to keep the master drawing set current as the plant evolves underneath it. By the time someone notices the gap, it's usually because a clash has already surfaced in the field, mid-execution, with the crew standing there and the clock running on a limited outage window.
Where Outdated Drawings Turn Into Real Money
The cost of planning against wrong geometry doesn't show up as a single line item — it shows up as delay, rework, and change orders scattered across the project, each individually explainable and collectively enormous. Engineering teams tend to underestimate the total because no single incident looks catastrophic on its own; a two-week schedule slip here, a redesigned bracket there. When you add them up across a full modification or outage program, the numbers below are large enough to fund the survey many times over, and they recur every single planning cycle the drawings stay unfixed.
From Laser Pulses To A Model Your Engineers Can Trust
Laser scanning uses time-of-flight measurement to capture millions of precise spatial coordinates per second across the facility, building a point cloud dense enough to represent every pipe, support, and structural element exactly as it exists today — not as it was drawn, not as it was specified, but as it physically sits in the plant right now. That raw capture is then converted into an intelligent, usable model through a defined four-step process, moving from raw geometry to something your engineering team can actually design against.
Scan
Survey-grade scanners capture up to two million points per second across the facility, typically achieving two to four millimeter accuracy even in congested plant rooms, elevated structures, and hard-to-reach areas that a manual survey would struggle to access safely.
Register
Individual scans from multiple positions are aligned into a single unified point cloud covering the full facility footprint, with overlapping coverage eliminating blind spots behind equipment and structure.
Model
Pipes, structural steel, and equipment are extracted from the point cloud and converted into intelligent solid elements with real diameters, thicknesses, and positions — the as-built 3D or BIM model.
Deliver
Models are delivered in the formats your engineering team already works in, with metadata linking each modeled component to material, specification, and inspection data.
Four Ways An As-Built Model Pays For Itself
A single scan survey doesn't just solve one project — the resulting model becomes reusable infrastructure across multiple planning cycles, engineering tasks, and maintenance decisions long after the initial capture is complete. Facilities that treat the scan as a one-time deliverable for a single outage are leaving most of the value on the table; the model keeps paying dividends every time someone needs to answer "what's actually there" without scheduling another site visit.
Catch Interferences Before Fabrication
Overlaying new design onto the as-built model highlights every point where a proposed pipe, support, or cable tray collides with what's actually there, before a single piece of steel is fabricated or a crew is dispatched to install something that won't fit.
Rehearse The Outage Before It Happens
Teams walk the planned outage sequence inside the model, surfacing access constraints, floor loading conflicts, and clearance issues that a spreadsheet or Gantt chart would never reveal until a crew is already standing in the space.
Design Against What's Really There
Engineers designing a revamp, retrofit, or tie-in work from verified existing geometry instead of an outdated drawing set, eliminating the single largest source of field rework on brownfield projects and shortening the design review cycle considerably.
Build The Record That Never Existed
For facilities where as-built documentation was never properly maintained, a single scan survey creates the accurate baseline record that should have existed since commissioning, giving every future project a trustworthy starting point.
Give Your Engineers A Model They Can Actually Trust
Bring your last outage report or modification project to the walkthrough. We'll show you exactly where an as-built model would have changed the outcome.
Planning Against Paper vs Planning Against The Point Cloud
The difference between an outdated drawing set and a current as-built model is not cosmetic — it changes what kind of surprises show up during execution and how expensive they are to fix once they do. A drawing that's wrong doesn't announce itself; it just quietly produces a clash or a misfit part on the day the schedule can least absorb it. The comparison below lays out exactly what changes across the factors that matter most to engineering and outage planning teams.
| Factor | Original / Outdated Drawings | Laser-Scanned As-Built Model |
|---|---|---|
| Accuracy vs Reality | Drifts further every year without updates | Millimeter-accurate as of scan date |
| Clash Detection | Not possible on 2D drawings | Automated overlay against new design |
| Field Surprises | Discovered mid-outage, under time pressure | Surfaced during planning, before execution |
| Rework Exposure | 5–20% of project budget typical | Substantially reduced by design certainty |
| Reusability | Single-use, decays immediately | Reusable across future projects and outages |
| Digital Twin Readiness | Not compatible | Foundation layer for a facility digital twin |
Deliverables Built For Your Existing Engineering Workflow
A scan survey is only useful if it lands in the tools your engineering and maintenance teams already use. Outputs are matched to your workflow rather than forcing a new platform on your team, because the goal is to make the next design review or outage planning session faster, not to hand your engineers another system to learn. Every deliverable below traces back to the same underlying point cloud, so nothing gets lost or reinterpreted between formats.
Registered Point Cloud
The full raw capture, registered into a single coordinate system, viewable and measurable in standard point cloud software for anyone who needs to check a dimension directly against reality.
2D As-Built Drawings
Accurate floor plans, elevations, and sections dimensioned directly from the point cloud, delivered in DWG, DXF, or PDF for teams still working primarily in 2D or needing quick reference drawings without opening a full 3D model.
Intelligent 3D / BIM Models
Parametric models with real pipe diameters, structural profiles, and equipment geometry, delivered in Revit, Navisworks, AutoCAD Plant 3D, or the platform your engineering team standardizes on for detailed design and coordination work.
Digital Twin Foundation
Metadata-linked models tagged with material, specification, and inspection data form the starting layer for a facility digital twin that can absorb live operational data over time.
Scanning That Fits Your Planning Cycle, Not The Other Way Around
The highest-value moment for a scan survey is right before a major planning cycle begins, and the second-highest is right after execution ends. Capturing both ends of the outage creates a before-and-after record that compounds in value across every future cycle, because each outage stops starting from scratch and instead builds on a verified, current baseline from the cycle before it. Plants that adopt this rhythm consistently report shorter planning phases and fewer surprises with each successive outage.
Verified Spatial Baseline
A current scan captured before planning begins gives every stakeholder a shared, accurate reference — eliminating the disputes that arise when different teams are working from different drawing revisions and nobody can agree on which version is current.
Live Reference For Field Teams
Field crews can reference the accurate model directly for access routing, clearance verification, and sequencing, cutting down on the repeated site visits and radio calls back to the engineering office that eat into limited outage time.
As-Left Documentation
A follow-up scan captures the as-left condition of the plant, documenting exactly what changed during execution and becoming the verified starting point for the next planning cycle rather than another drawing set that starts decaying immediately.
From A Single Survey To A Living Digital Twin
Reality capture and a digital twin are related but distinct — reality capture is the process of collecting spatial data from the physical world, while a digital twin is a dynamic, data-rich virtual replica that continues absorbing operational data over time. The first scan survey is the entry point into that longer trajectory, not the end state, and facilities that treat it that way get compounding returns rather than a one-time deliverable that starts decaying the moment it's issued.
Static As-Built Model
The initial scan and model delivery — an accurate spatial snapshot of the facility as it exists on the day of capture, immediately usable for clash detection and planning.
Metadata-Enriched Model
Component-level data — material, design pressure, inspection history — gets linked to modeled elements, turning a geometric model into a searchable asset record.
Rescan & Deviation Tracking
Periodic rescans — quarterly, or tied to outage cycles — reveal deviation between the model and current reality, catching drift, wear, or unauthorized modification before it becomes a failure.
Live Operational Digital Twin
Real-time operational and condition data layers onto the spatial model, creating the dynamic virtual replica that supports condition-based maintenance and predictive planning at facility scale.
Facilities that pursue this path consistently report measurable results: maintenance cost reductions of up to twenty-five percent and unplanned outage reductions of up to fifty percent, driven by the shift from reactive response to proactive intervention that a current, trustworthy spatial model makes possible. None of that is achievable while planning against a drawing set that's a decade out of date.
We used to walk into outage planning meetings with three different versions of the same drawing, none of which matched what was actually in the plant. The scan survey ended that argument permanently. Every stakeholder is now looking at the same accurate model, clashes get caught on a screen instead of on the outage floor, and our engineers stopped budgeting contingency time for "drawing surprises" because those surprises mostly stopped happening. The rescan after our last outage has already become the baseline for planning the next one, which is exactly the compounding benefit we were hoping for when we first brought the survey team in.
Frequently Asked Questions
Q: How accurate is a laser-scanned as-built model compared to a traditional field survey?
Q: Can scanning happen while the plant is operating, or does it require a shutdown?
Q: What file formats and software do the deliverables work with?
Q: How long does a full facility scan and model delivery typically take?
Q: Does this replace our existing CMMS or facility management system, or work alongside it?
Plan Your Next Outage Against Reality, Not Paper
Book thirty minutes with our team, share your facility layout and next planning cycle, and see what a millimeter-accurate as-built model could do for your engineering and outage teams.