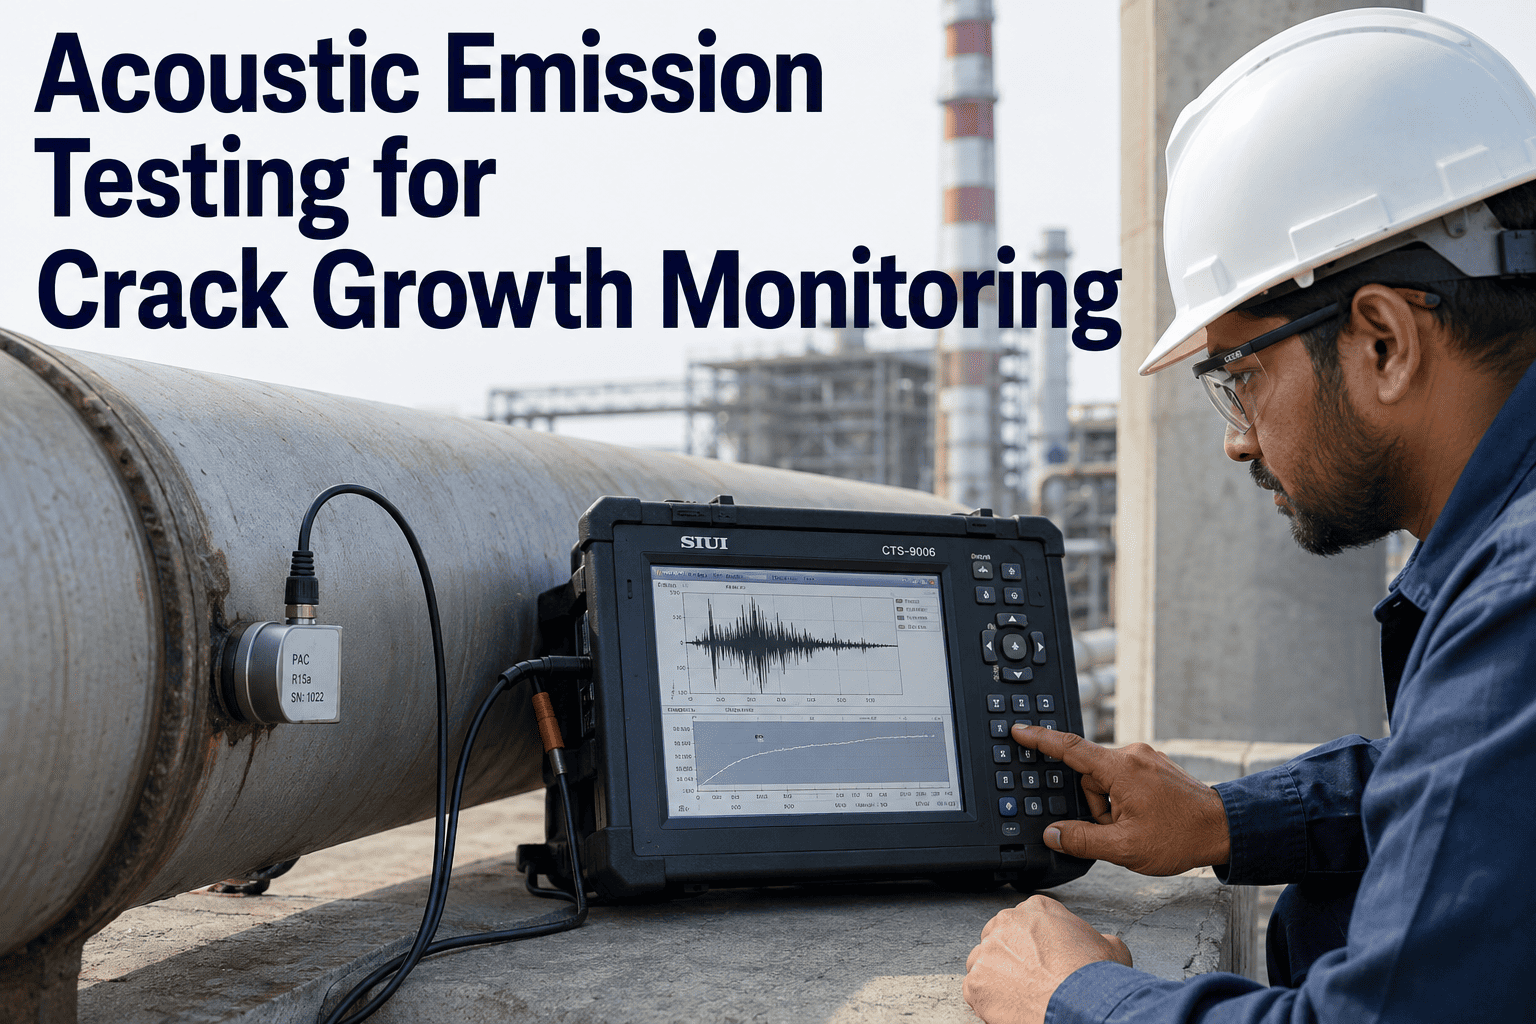
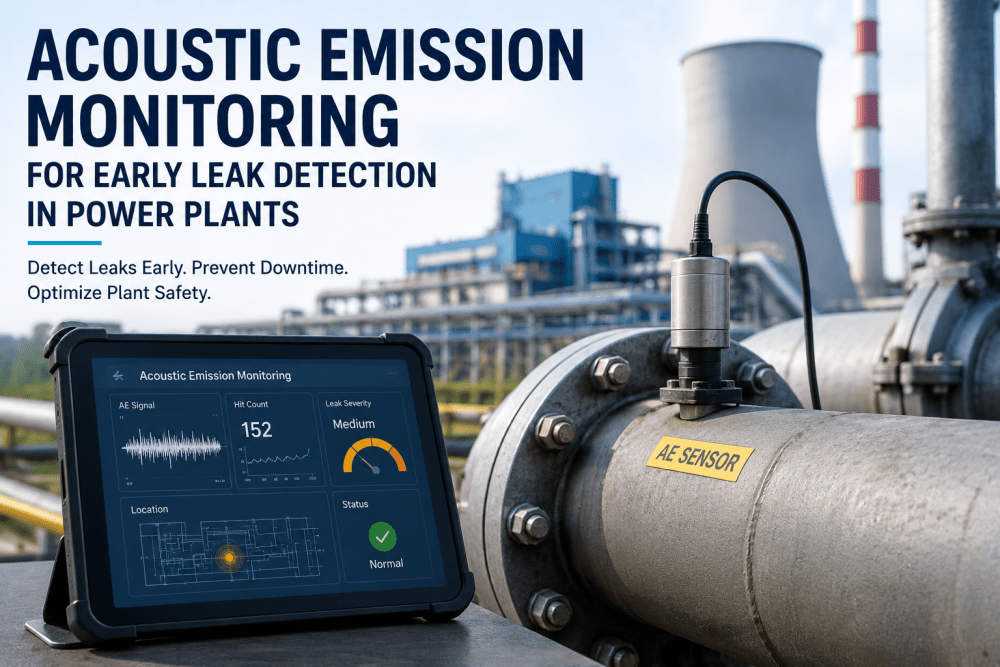
Acoustic emission testing listens to the sounds that materials make when they are actively deforming, cracking, or leaking under load, converting those high-frequency stress waves into electrical signals that reveal where damage is happening inside pressure vessels and piping in real time, while the equipment remains in service. Unlike conventional NDT methods that look for cracks that already exist, acoustic emission detects cracks that are actively growing, which makes it uniquely valuable for monitoring pressure equipment during hydrostatic testing, startup and shutdown cycles, and continuous operation where the loading conditions that drive crack growth are actually present, and iFactory integrates AE findings with visual inspection data in a unified condition monitoring workflow available through iFactory support.
Acoustic Emission Testing · Pressure Equipment Integrity
Acoustic Emission Testing for Real-Time Crack Growth Monitoring in Pressure Equipment
Listen to what your pressure vessels and piping are telling you under load. Acoustic emission testing detects active crack growth, leak initiation, and structural deformation as it happens — without shutting down, without emptying, and without guessing.
Passive Load
No AE Activity Detected
Active Crack Growth
AE Signals Detected — Source Located
How Acoustic Emission Works
The Physics Behind Listening to Materials Under Stress
When a crack grows in steel under load, the sudden release of stored elastic energy at the crack tip generates a stress wave that propagates through the material at the speed of sound, typically between 3000 and 6000 meters per second in steel depending on the wave mode. Acoustic emission sensors bonded to the exterior surface detect these waves, convert them to electrical signals, and the analysis system extracts the timing, amplitude, frequency content, and arrival pattern across multiple sensors to determine where the source is, what type of event produced it, and how energetically significant it is. The entire chain from crack tip energy release to classified source location happens in microseconds.
1
Stress Wave Generation
A crack advances, dislocation moves, or inclusion debonds under applied stress. The sudden localized strain release at the source point radiates elastic energy as a transient stress wave into the surrounding material. The wave characteristics — amplitude, rise time, frequency — are determined by the source mechanism, not by the sensor or the electronics, which is why AE can distinguish between crack growth, fretting, and leak noise based on the wave shape alone.
2
Wave Propagation and Attenuation
The stress wave travels through the pressure vessel wall, reflecting from boundaries and mode-converting at surfaces. In thin-walled vessels, the dominant wave mode is the extensional or Lamb wave that spreads across the plate. In thick-walled components, bulk longitudinal and shear waves dominate. Attenuation reduces the amplitude with distance, so sensor spacing must be calculated based on the material attenuation characteristics and the minimum detectable source amplitude for the application.
3
Sensor Detection and Conversion
Piezoelectric sensors bonded to the exterior surface convert the arriving stress wave motion into a voltage signal. Sensor selection depends on the frequency range of interest — resonant sensors between 30 and 300 kHz for most metal pressure vessel applications, with broadband sensors used when detailed waveform analysis is needed for source discrimination. Sensor coupling quality is critical because even a thin air gap between sensor and surface will attenuate the signal beyond detection.
4
Signal Processing and Source Location
The acquisition system measures the arrival time of each signal at multiple sensors and uses the known wave velocity and sensor positions to triangulate the source location through time-difference-of-arrival calculations. Each detected event is characterized by parameters including peak amplitude, duration, rise time, energy, counts, and frequency content. These parameters feed the classification logic that separates crack-related emissions from noise sources.
AE Source Classification
Not Every Sound Is a Crack — Knowing the Difference Is What Makes AE Valuable
The primary technical challenge in acoustic emission testing is not detecting signals — it is determining which signals come from active structural damage and which come from benign noise sources that exist in every industrial environment. Misclassifying noise as crack growth leads to unnecessary shutdowns and repairs, while missing crack signals leads to undetected degradation. The classification system below represents the standard framework used in pressure equipment AE applications.
Critical
Crack Growth Emissions
Amplitude: High, 60-100 dB
Duration: Short, 50-500 microseconds
Frequency: Broad, 100-300 kHz
Pattern: Clustered at single location, rate increases with load
Generated by the sudden energy release at an advancing crack tip. These events cluster spatially at the crack location and exhibit a characteristic load-dependence where the emission rate increases as the stress intensity at the crack tip increases. Felicity ratio analysis — the ratio of the load at which emissions reappear during a reload cycle to the previous maximum load — provides additional confirmation that the source is crack-related rather than noise.
Warning
Leak Flow Noise
Amplitude: Moderate, 40-75 dB
Duration: Continuous, sustained signal
Frequency: Lower, 20-100 kHz
Pattern: Continuous at fixed location, load-independent
Turbulent flow through a leak path generates continuous acoustic emission that is spatially stable and does not exhibit the burst-like characteristics of crack growth. While not a crack signal, leak detection is a valuable secondary capability of AE monitoring on pressure equipment, particularly during hydrostatic testing where small leaks may not be visually detectable on the exterior surface immediately.
Noise
Mechanical Contact and Fretting
Amplitude: Variable, 30-80 dB
Duration: Variable, often long
Frequency: Lower, 20-80 kHz
Pattern: At structural interfaces, may correlate with vibration
Fretting between vessel supports, piping restraints, insulation clips, and structural attachments generates AE signals that can mimic crack emissions in amplitude but differ in frequency content and spatial distribution. Guard sensors placed on known noise source locations, frequency filtering, and pattern recognition algorithms are used to separate mechanical noise from structural damage signals.
Noise
Electromagnetic and Environmental
Amplitude: Variable, can be high
Duration: Often very short or periodic
Frequency: Often below AE range
Pattern: Correlates with electrical activity or weather
Electromagnetic interference from welding equipment, motor drives, radio transmitters, and lightning can couple into the AE sensor cables and appear as signals. Rain, hail, and wind impinging on the vessel surface generate physical noise. Proper cable shielding, grounding practices, and environmental monitoring during the test window are essential to maintain signal validity.
Sensor Placement Strategy
Where Sensors Go on Pressure Vessels and Piping, and Why Position Matters More Than Quantity
Source location accuracy depends entirely on sensor geometry. More sensors do not automatically mean better location accuracy — what matters is the geometric relationship between the sensor array and the area being monitored. The following placement strategies address the most common pressure equipment geometries encountered in refineries, chemical plants, and power generation facilities.
Zone A
Spherical Vessel Shell
Spherical pressure vessels such as LPG storage spheres are monitored with sensors arranged in a triangular grid on the external surface. The curved geometry means that wave propagation follows the sphere surface, and location algorithms must account for the curvature in their time-difference calculations. A minimum of six sensors provides full surface coverage for source location on a standard-diameter sphere, with additional sensors added to reduce the location uncertainty zone size in areas of known concern such as weld seams and nozzle attachments.
Key Parameters
Sensor spacing: 1-2m typical, Wave velocity: calibrated on-sphere, Coverage: full external surface
Zone B
Cylindrical Vessel Shell and Welds
Cylindrical pressure vessels present a more complex geometry because the shell, heads, and longitudinal and circumferential weld seams each have different structural behavior under load. Sensors are arranged in rings at multiple elevations along the cylinder, with additional sensors positioned at weld intersections and nozzle-to-shell junctions. The cylindrical geometry allows planar location algorithms within each ring section, with out-of-plane location requiring sensors on the heads or on opposing sides of the cylinder.
Key Parameters
Ring spacing: matched to attenuation length, Extra sensors: at nozzles and weld junctions, Location: planar per section
Zone C
Piping Systems and Welds
Piping AE monitoring focuses on specific weld joints or short piping spools rather than entire piping runs, because wave attenuation in piping is high due to the small cross-section and multiple supports and fittings that reflect and scatter the waves. Sensors are placed in pairs or arrays on either side of the weld of interest, with spacing calculated to ensure the weld volume falls within the locatable zone. Long piping runs are monitored by zoning multiple sensor arrays along the length with overlapping coverage.
Key Parameters
Sensor spacing: 0.5-1.5m on pipe, Focus: specific weld joints, Array type: paired or triangular per weld
Zone D
Nozzle and Attachment Junctions
Nozzle-to-shell junctions, support lug attachments, and skirt-to-shell welds are geometric discontinuities that concentrate stress and are among the most common locations for fatigue crack initiation in pressure equipment. These locations receive dedicated sensor arrays because the complex geometry creates wave mode conversion and reflection patterns that make source location more challenging. Guard sensors on the nozzle flange or support structure help separate noise from the attachment itself from crack signals at the attachment-to-shell weld.
Key Parameters
Dedicated arrays per junction, Guard sensors on attachments, Higher sensor density than shell
Application Scenarios
When Acoustic Emission Testing Is the Right Tool for Pressure Equipment
AE is not a replacement for conventional NDT — it is a complementary method that provides information no other technique can deliver. The value of AE is greatest in situations where the equipment is under load, where the degradation mechanism is active, and where knowing whether a defect is growing is more important than knowing it exists. The following application scenarios represent where AE delivers the most significant value in pressure equipment integrity programs.
Primary
Hydrostatic Test Monitoring
During hydrostatic pressure testing of new or repaired pressure vessels, AE monitoring provides real-time indication of whether any active flaw growth is occurring as the pressure increases. Instead of pressurizing to the test pressure, holding, depressurizing, and then performing conventional NDT to find out if anything happened, AE tells you during the test whether the vessel is generating crack signals at any pressure level. Vessels that pass the AE criteria during hydrotest have a strong probability of passing conventional NDT, allowing the NDT scope to be focused on any AE-indicated areas rather than applied blanket-coverage. This application is the single most widely adopted use of AE in pressure equipment and has been standardized in ASME, ASTM, and EN codes.
High Value
In-Service Continuous Monitoring
Permanent or semi-permanent AE sensor installations on critical pressure equipment allow continuous monitoring during operation. This is applied to vessels operating in fatigue-critical service, to equipment with known flaws that are being monitored for growth under Fitness-For-Service assessment, and to high-consequence vessels where unexpected failure would have severe safety or environmental impact. The monitoring system runs continuously and alerts when emission patterns indicate active crack growth, providing the early warning that time-based inspection cannot deliver between inspection intervals.
High Value
Startup and Shutdown Monitoring
The thermal transient and pressure cycling that occurs during startup and shutdown creates the most severe loading conditions that many pressure vessels experience. AE monitoring during these transient periods captures any crack growth or damage that occurs specifically during the thermal gradient and pressure ramp conditions. This is particularly valuable for vessels in cycling service where the fatigue damage accumulates disproportionately during these transient events rather than during steady-state operation.
Targeted
Known Flaw Growth Assessment
When a flaw is found by conventional NDT — a crack in a weld, a crack-like indication in a nozzle junction — the critical question is whether it is growing under current operating conditions or whether it is stable. AE monitoring focused on the known flaw location during a controlled pressurization or during normal operation provides direct evidence of whether the flaw is actively propagating, which determines whether immediate repair is required or whether continued monitoring is an acceptable risk management approach.
Conventional NDT Tells You Where Cracks Are. Acoustic Emission Tells You Which Ones Are Growing Under Load Right Now.
Real-time crack growth monitoring during hydrotest, startup, and operation — with source location, severity classification, and integration into your asset integrity record through iFactory.
Severity Classification
How AE Findings Are Graded and What Each Grade Means for Your Equipment
AE evaluation criteria for pressure equipment have been developed through decades of correlated testing — AE monitoring performed simultaneously with conventional NDT and sometimes with deliberate flaw introduction — to establish the signal patterns that correspond to different levels of structural concern. The following classification framework follows the general approach used in ASME Section V, Article 12, and ASTM E1067 for AE evaluation of fiber-reinforced plastic vessels, adapted for metallic pressure equipment applications.
Grade
AE Characteristics
Structural Interpretation
Required Action
Grade A
No significant AE activity above threshold during entire load cycle. Isolated low-amplitude events that do not cluster spatially and do not exhibit load dependence.
No evidence of active flaw growth or structural damage under the applied loading conditions.
Accept the vessel for continued service per the applicable code and operating conditions. No AE-driven NDT follow-up required.
Grade B
Low-level AE activity with some spatial clustering. Events are low to moderate amplitude and may show mild load dependence. Felicity ratio above 0.95 on reload cycles.
Possible minor flaw activity or incidental emissions from non-critical sources. No strong indication of significant crack growth.
Perform targeted conventional NDT at the AE-indicated locations. If NDT confirms no significant flaws, accept for service with enhanced monitoring frequency.
Grade C
Moderate to high AE activity with clear spatial clustering at one or more locations. Events show definite load dependence with increasing rate at higher loads. Felicity ratio between 0.85 and 0.95.
Indicative of active flaw growth, likely crack propagation, at the clustered locations. The load dependence confirms the source is stress-related rather than noise.
Perform detailed conventional NDT at all AE-indicated locations before returning to service. Repair or perform engineering evaluation per Fitness-For-Service procedures if flaws are confirmed.
Grade D
High-amplitude, high-rate AE activity with strong spatial clustering. Emissions persist or accelerate at constant load. Felicity ratio below 0.85. Possible continuous emission at high load levels.
Strong indication of significant active crack growth or structural damage. Continuous emissions at constant load may indicate unstable crack propagation or imminent failure.
Do not pressurize further. Depressurize under controlled conditions. Perform comprehensive NDT and engineering assessment before any return to service. Repair or replace.
Method Comparison
How Acoustic Emission Complements Rather Than Replaces Conventional NDT
AE is frequently misunderstood as an alternative to ultrasonic testing, radiography, or magnetic particle inspection. It is not. Each method provides different information, and the most effective pressure equipment integrity programs use them together. The comparison below clarifies what each method contributes and where AE fills gaps that conventional methods cannot address.
Ultrasonic Testing (UT)
Measures wall thickness and detects internal flaws at the specific locations the technician scans
During shutdown when the surface is accessible for coupling
Only examines locations the technician reaches. Cannot determine if a found flaw is growing or stable without repeated measurements over time. No real-time capability during pressurization.
AE monitors the entire instrumented volume simultaneously during loading and tells you which locations are actively generating crack signals, directing UT to the right spots with the right urgency.
Radiographic Testing (RT)
Produces an image of internal volumetric flaws such as porosity, slag, and incomplete fusion in welds
During shutdown with access for film or digital detector placement on both sides of the weld
Detects flaw presence but not flaw activity. A crack visible on a radiograph may have been there for years without growing. No information on whether the flaw is stable or propagating under current operating loads.
AE determines whether a crack found by RT is actively growing under load. A stable crack found by RT with no AE activity during a pressurization cycle has fundamentally different risk implications than the same crack with active AE emissions.
Magnetic Particle Testing (MT)
Detects surface and near-surface linear indications such as cracks and lack of fusion in ferromagnetic materials
During shutdown with surface access for magnetization and particle application
Surface-only detection. Cannot see internal flaws. Like UT and RT, shows flaw presence without indicating whether the flaw is actively propagating. Requires clean surface preparation for reliable results.
AE monitors for active crack growth from the internal surface or through-wall, which MT cannot detect. AE during a hydrotest can indicate internal crack initiation that would not be visible to MT until the crack reaches the external surface.
Field Application
Detecting Active Crack Growth in a Hydrogen Service Vessel During Hydrostatic Re-Test
A carbon steel pressure vessel in hydrogen service at a refinery was due for its periodic hydrostatic re-test as required by the jurisdictional code. The vessel had been in service for eighteen years with a documented history of wet hydrogen sulfide exposure that created a known susceptibility to hydrogen-induced cracking. Conventional NDT at the previous outage three years earlier had identified several crack-like indications in the longitudinal weld of the upper shell course, all below the critical size for immediate repair under the applicable Fitness-For-Service assessment, but flagged for monitoring at the next inspection.
The integrity engineering team specified AE monitoring during the hydrostatic re-test to determine whether any of the known indications were actively growing under pressure loading, and to screen the entire vessel for any new active flaw locations that might have developed since the last inspection. Twenty-four resonant sensors were installed in a zoned array covering the shell, heads, and all nozzle junctions. The vessel was pressurized in increments to the test pressure with holds at each step, and the AE system recorded and located all emissions in real time throughout the pressurization cycle.
At approximately 85 percent of test pressure, the AE system detected a cluster of high-amplitude, short-duration events at a single location on the longitudinal weld in the upper shell course — the same area where the previous UT inspection had identified the largest crack-like indication. The emission rate increased with pressure and the events showed clear spatial clustering with a Felicity ratio of 0.82 on a partial depressurization and repressurization cycle, placing the finding firmly in Grade C severity. The test was paused, and the AE data were provided to the inspection team who performed targeted UT and phased array inspection at the AE-indicated location, confirming that the known indication had grown since the previous inspection and now exceeded the acceptable size under the Fitness-For-Service assessment. The vessel was not returned to service, the weld was repaired, and the repair was verified by both conventional NDT and a confirmatory AE monitored hydrotest that showed no significant emissions at the repair location.
85% test pressure
Load level where AE first detected active crack growth
Single weld location
AE source location confirmed by targeted UT
Felicity ratio 0.82
Confirmed active crack propagation under load
Repair verified
Post-repair AE hydrotest showed no emissions at repair
Integration With AI Vision
Combining Acoustic Emission Data With Visual Inspection in a Unified Condition Record
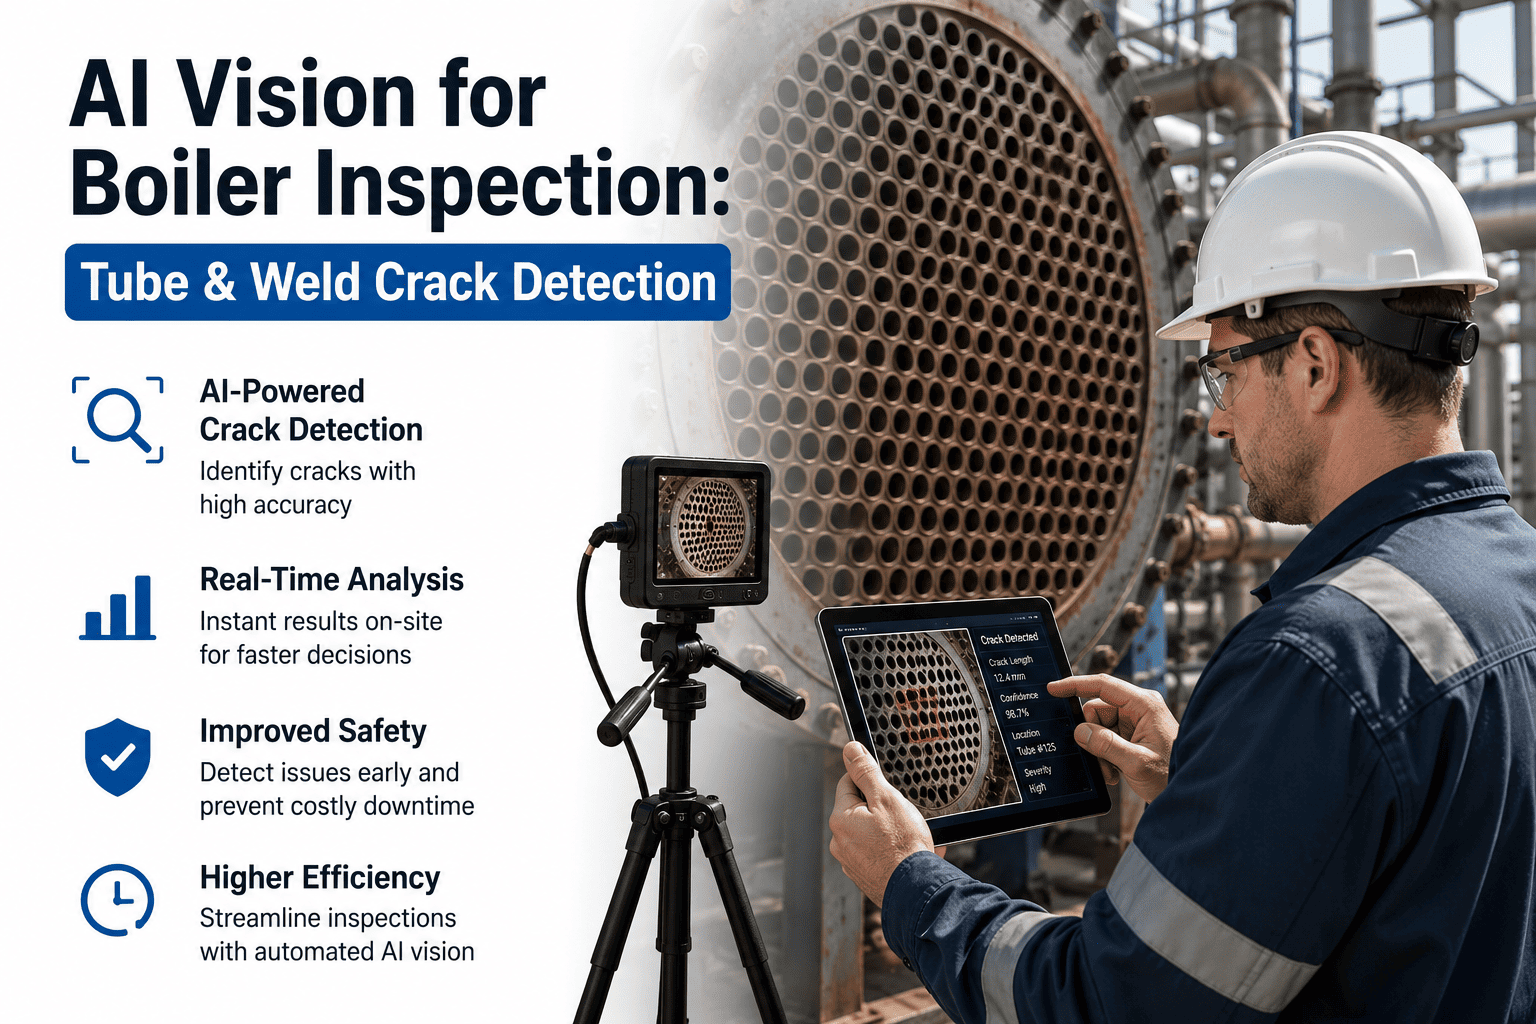
AE and visual inspection address different aspects of the same problem. AE detects active damage inside the material under load. Visual inspection detects surface-visible degradation that may or may not be active. When both data streams are brought into the same condition monitoring platform, the combined picture is significantly more powerful than either alone. A crack that generates AE signals during a pressurization cycle and also shows visible surface staining in the camera imagery is assessed very differently from a crack that generates AE signals but shows no external surface indication — the first suggests a through-wall or near-surface propagating crack, while the second suggests an internal flaw that has not yet reached the surface.
AE
Acoustic Emission Data Stream
Source locations, severity grades, emission rate trends, Felicity ratio measurements, and load-correlation data from each monitoring event. This data answers the question: is damage actively happening right now under the current loading conditions?
AI
Unified Condition Platform
Both data streams are tied to the same asset model with location referencing, so AE source locations and visual inspection findings can be overlaid on the equipment geometry. The platform cross-references the two data types to generate combined severity assessments that neither method could produce independently.
VIS
Visual Inspection Data Stream
Surface condition imagery, crack detection, corrosion mapping, staining patterns, and deformation measurements from camera-based inspection. This data answers the question: what does the surface condition look like, and how has it changed since the last inspection?
Scenario 1
AE Active + Visual Confirmation
AE detects active emissions at a location. Visual inspection shows surface cracking or staining at the same location. Combined assessment: confirmed active through-wall or near-surface crack propagation. Priority: highest. Action: immediate NDT follow-up and engineering assessment before return to service.
Scenario 2
AE Active + No Visual Indication
AE detects active emissions but visual inspection of the same area shows no surface degradation. Combined assessment: active internal flaw that has not yet reached the surface. Priority: high. Action: schedule internal UT or phased array inspection at the AE-indicated location during next available access.
Scenario 3
No AE + Visual Finding
Visual inspection finds a crack or corrosion but AE monitoring during pressurization shows no emissions from that location. Combined assessment: existing flaw that is stable under current loading conditions. Priority: moderate. Action: monitor visually and with AE at next test cycle, no immediate intervention required.
Frequently Asked Questions
What Pressure Equipment Engineers and Inspectors Ask About Acoustic Emission Testing
Can acoustic emission detect cracks that are not growing, or does it only work on active crack propagation?
Acoustic emission fundamentally detects the stress waves generated by sudden energy release at a source, which means it is sensitive to active crack growth, not to the static presence of a crack. A crack that has been in the material for years but is not propagating under the current load does not generate acoustic emission and will not be detected by AE. This is not a limitation but a defining characteristic — AE answers the question of whether damage is actively happening, which is exactly the information that conventional NDT methods like ultrasonic testing and radiography cannot provide. For a complete integrity assessment, AE is used alongside conventional NDT: conventional methods find the cracks, and AE determines which ones are growing. To see how AE and visual inspection data are combined in a single platform,
book a demo.
How do you know the AE signals are actually from crack growth and not from some other noise source in the plant?
Distinguishing crack-related AE from noise is the central technical challenge in every AE application, and it is addressed through a combination of techniques applied simultaneously during the test. Guard sensors are placed on known noise sources such as supports, piping connections, and structural attachments to identify and filter out noise originating from those locations. Frequency filtering separates the broadband, higher-frequency content typical of crack emissions from the lower-frequency content typical of mechanical noise and leak flow. Spatial clustering analysis identifies whether events are concentrating at a structural location consistent with a flaw or are distributed randomly. Load correlation analysis determines whether the emission rate increases with applied stress, which is the hallmark of a stress-driven source like crack growth rather than a load-independent source like environmental noise. The combination of these filters, applied by experienced AE analysts with support from automated classification algorithms, achieves reliable source discrimination in the vast majority of industrial pressure equipment applications. The
support team can provide detailed guidance on noise discrimination approaches for your specific equipment and operating environment.
What codes and standards govern AE testing on metallic pressure vessels?
The primary standards for AE testing of metallic pressure equipment are ASME Section V, Article 12 for acoustic emission examination, which provides the general requirements for AE personnel qualification, equipment calibration, sensor placement, examination procedures, and evaluation criteria. ASTM E569 covers AE monitoring of structures during controlled loading, and ASTM E976 addresses AE sensor calibration. For specific applications, CARP (Compressed Air and Gas Institute) and ASME have developed evaluation criteria for specific vessel types and services. EN 13554 provides the European framework for AE testing. The key point is that AE is a recognized and codified NDT method for pressure equipment, and the standards provide detailed procedural requirements that ensure the test produces reliable and defensible results. When AE is used for in-service monitoring or Fitness-For-Service applications, the results are evaluated within the framework of API 579-1/ASME FFS-1, which accepts AE data as part of the flaw assessment input for determining continued service suitability.
Can AE monitoring be performed while the vessel is in normal operation, or does it require a special pressurization?
Both are possible, and the choice depends on the objective. For hydrostatic test monitoring, AE is performed during the controlled pressurization and hold cycle, which provides clean load-dependent data that is highly diagnostic for crack growth evaluation. For in-service monitoring, AE sensors are installed on the operating vessel and the system monitors continuously during normal operation, including pressure and temperature fluctuations, process upsets, and startup and shutdown cycles. In-service monitoring is technically more challenging because the loading conditions are less controlled and the noise environment is more complex, but it provides the between-inspection visibility that is the primary value proposition of continuous monitoring. Many facilities start with AE during hydrostatic testing to build confidence in the method and then extend to in-service monitoring on their highest-consequence equipment where the between-inspection visibility is most valuable. To discuss which approach fits your equipment and integrity program,
book a demo.
What is the typical duration and logistics of an AE monitoring event on a pressure vessel?
For a hydrostatic test monitoring application, sensor installation typically takes four to eight hours depending on the vessel size and number of sensors, including surface preparation, sensor coupling verification, and cable routing. The actual AE monitoring runs for the duration of the pressurization cycle, which is typically four to twelve hours depending on the test procedure. Data analysis and preliminary reporting are usually completed within 24 to 48 hours after the test, with a final report that includes source location plots, severity grading, load-correlation graphs, and recommended follow-up actions. For in-service monitoring installations, the initial sensor installation follows the same process, but the monitoring system then runs continuously for weeks or months with periodic data review and reporting. The logistics footprint is significantly smaller than conventional NDT — AE requires no surface cleaning beyond the sensor mounting spots, no consumables, no radiation safety, and no confined space entry for the monitoring activity itself. The
support team can provide specific logistics planning for your vessel geometry and test requirements.
Stop Waiting for Your Next Shutdown to Find Out Whether the Cracks in Your Pressure Equipment Are Growing.
Acoustic emission testing gives you real-time crack growth detection during hydrotest, startup, and operation — with source location, severity classification, and integration into a unified condition record alongside visual inspection data.