Biomass and waste-to-energy plant failures are rarely sudden events. They are forecast in the data for hours and days before they become visible as alarms — yet most facilities lack the analytics layer required to read those forecasts and act before the failure threshold is crossed. U.S. biomass and WtE facilities operate combustion systems, fuel handling trains, emission control equipment, and ash handling infrastructure that generate thousands of condition data points per hour through SCADA, historian, CMMS, and continuous emissions monitoring systems. Book a Demo to see how your facility compares.
Why Biomass and Waste-to-Energy Plants Need Predictive Analytics, Not More Alarms
The analytics gap in biomass and WtE operations is structural. A typical facility generates thousands of real-time data points per hour across boiler control systems, continuous emissions monitors, fuel handling PLCs, ash handling controls, and CMMS inspection records. Each system generates its own alarms at its own thresholds — but no single system can detect the compound failure mode that spans two or three of these data streams.
The Four Critical Asset Groups Where AI Analytics Prevents the Most Costly Failures
Biomass and waste-to-energy plants present a unique analytics challenge because their fuel variability — moisture content, calorific value, ash composition, contaminant load — creates operating conditions that shift continuously. AI analytics must be calibrated to the specific failure physics of each asset class while adapting to the fuel-driven variation that is inherent to biomass and WtE operations. iFactory's analytics library defines four high-impact asset groups responsible for the majority of unplanned downtime, emission exceedances, and maintenance cost in U.S. biomass and WtE facilities.
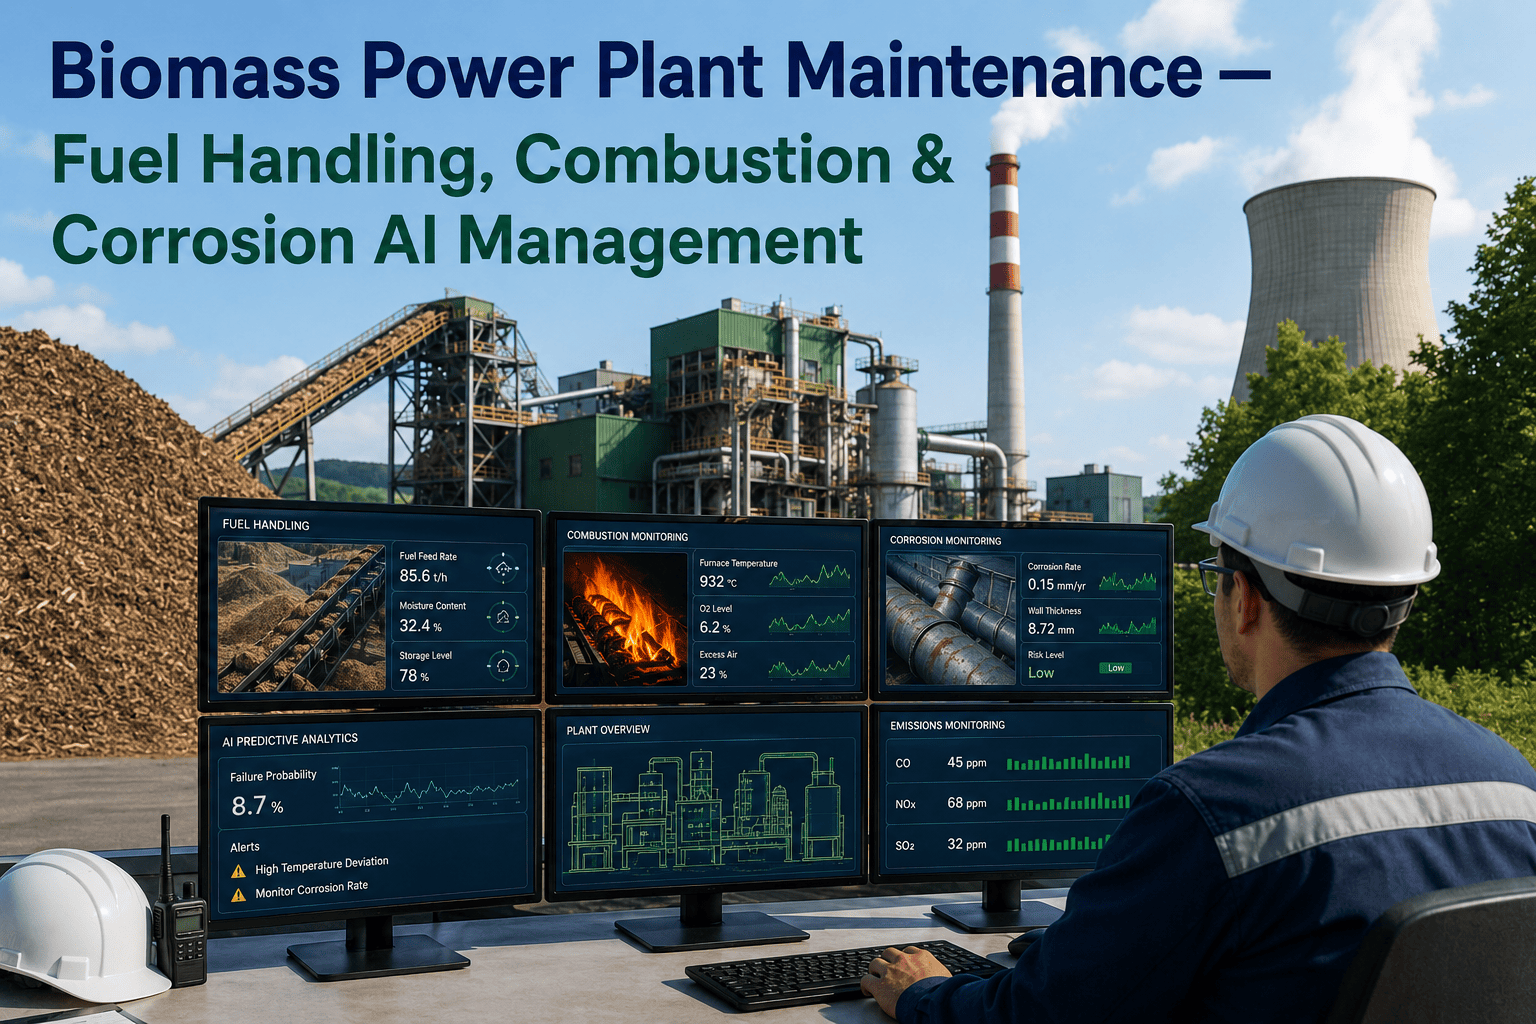
Biomass Boiler, Grate, and Combustion System Monitoring
The combustion system is the single highest-impact asset group in any biomass or WtE facility — a failure here means full plant outage, and the failure modes are among the most complex to detect because they are masked by the normal variability of burning heterogeneous fuel.
Fuel Handling, Preparation, and Feed System Monitoring
Fuel handling is the most common source of unplanned downtime in biomass and WtE facilities — not from the failure of the boiler itself, but from the fuel feed system that supplies it. Conveyor belt tracking, bearing condition, drive motor current, and fuel moisture content at the feed point are the critical parameters. A conveyor seized by a failed bearing starves the boiler of fuel, causing load reduction at best and a cold restart at worst.
Emission Control Systems: Baghouses, Scrubbers, and CEMS
Emission compliance is the single highest regulatory exposure in U.S. biomass and WtE operations. A baghouse filter breach, scrubber pH excursion, or CEMS calibration drift can produce a reportable emission exceedance within minutes. The cost of a single Title V violation — including penalty, required corrective action plan, and increased regulatory scrutiny — routinely exceeds $250,000.
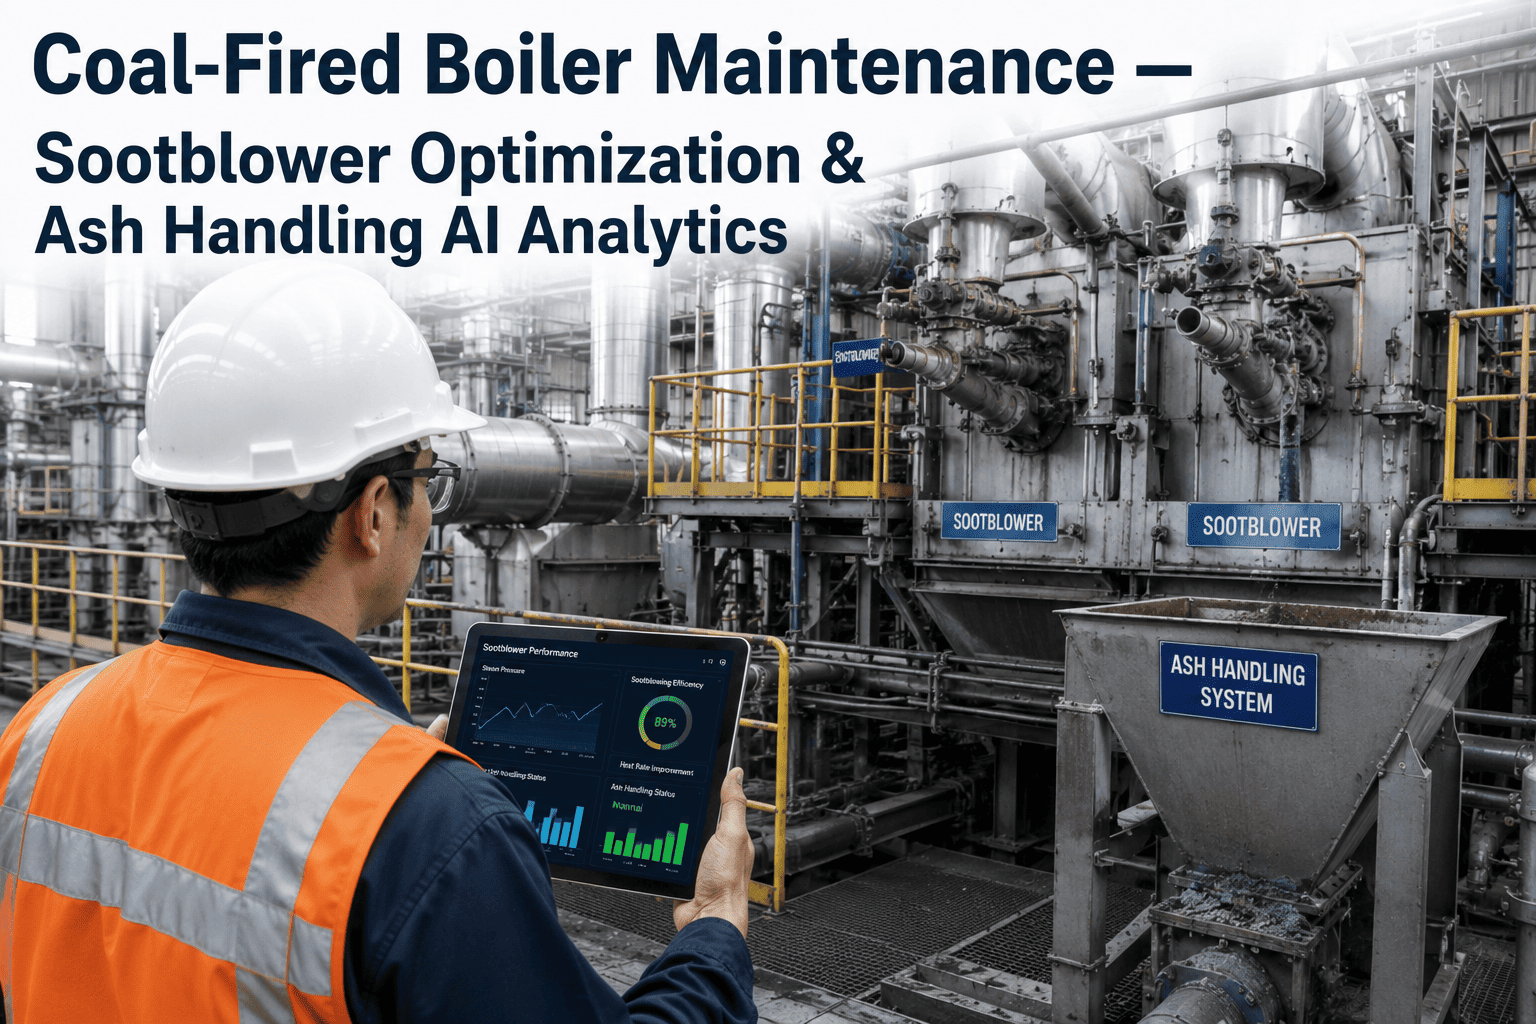
Ash Handling and Recovery System Monitoring
Ash handling systems are the most frequently deferred maintenance items in biomass and WtE facilities — they operate in challenging conditions of high temperature, abrasive material, and moisture, and their failure does not immediately stop production, which creates the deferral cycle that leads to catastrophic failure at the worst possible time. A bottom ash conveyor failure during peak loading, an ash silo bridging condition that requires manual clearing, or a fly ash pneumatic transport line blockage can force a full boiler outage.
How iFactory's Consequence-Weighted Risk Engine Converts Condition Data into Prevented Outages
Standard SCADA alarm systems monitor individual parameters against fixed setpoints. When one parameter breaches its threshold, an alarm fires — regardless of whether that threshold breach represents a 2% exceedance on a non-critical asset or a 20% exceedance on equipment whose failure mode involves a full boiler outage. The result is the alarm flood that characterizes every biomass and WtE plant control room.
Automated Inspection and Maintenance Scheduling for Biomass and WtE Operations
The gap between condition data and maintenance action is the single largest source of preventable downtime in biomass and WtE facilities. Calendar-based inspection schedules cannot account for the variable operating conditions introduced by heterogeneous fuel — a boiler that burned high-moisture wood chips for three weeks requires different inspection timing than one burning processed refuse-derived fuel.
| Maintenance Function | Traditional Approach | iFactory AI Approach | Operational Impact | Compliance Benefit |
|---|---|---|---|---|
| Boiler Tube Inspection | Annual shutdown-based UT survey | Condition-triggered by erosion rate trending and operating hours at elevated temperature | Inspections scheduled when actual wear conditions warrant, not when calendar dictates | NBIC repair documentation maintained per condition event |
| Baghouse Compartment Testing | Semi-annual schedule regardless of operating conditions | Differential pressure trend-triggered testing; compartment isolated when breach probability exceeds threshold | Filter replacement optimized to actual condition, not calendar — extends median filter life | Title V compliance records supported by continuous condition documentation |
| Conveyor Bearing Inspection | Quarterly vibration survey, manually scheduled | Continuous vibration monitoring with automatic work order at trend threshold | No bearing operates past degradation threshold undetected; unplanned conveyor stoppage eliminated | OSHA 1910.219 maintenance records complete and auditable |
| SCR Catalyst Condition | Annual performance test, catalyst replaced at fixed interval | Continuous NOx reduction efficiency trending with ammonia slip monitoring | Catalyst replacement optimized to actual activity loss; 20–35% increase in useful catalyst life | State emission permit conditions supported by continuous efficiency documentation |
| Ash Conveyor Chain Wear | Quarterly visual inspection, replacement on failure | Drive current trending correlated to ash loading; progressive wear detected before failure | Chain replacement scheduled during planned outages rather than emergency shutdowns | None specific — pure operational reliability improvement |
| CEMS QA / QC Verification | Daily automated calibration with manual quarterly audits | Continuous cross-instrument validation against process conditions; drift detected between calibration cycles | Calibration drift identified and corrected before invalid compliance data is generated | 40 CFR Part 60 / 75 compliance data integrity assured between QA cycles |
iFactory customers in the biomass and WtE sector deploying automated condition-based inspection scheduling report a 73% increase in high-priority inspection completion rate within 90 days of go-live — converting from a maintenance program where overdue inspections were discovered reactively to one where every condition threshold breach generates an accountable, prioritized work order in the maintenance queue. Book a Demo to see iFactory's condition-based scheduling in a live biomass environment.
The Financial Case for Predictive Analytics in Biomass and Waste-to-Energy Operations
The economics of predictive analytics for biomass and WtE facilities are unambiguous. The cost of unplanned downtime — lost power and steam production, emergency repair premiums, startup fuel cost for a cold restart, ash disposal delays — far exceeds the investment required to prevent it.
- Average unscheduled boiler outage duration: 4–12 days depending on failure mode and parts availability
- Lost power and steam revenue: $120,000–$280,000 per day depending on PPA rate and capacity factor
- Emergency repair premium: 40–70% above planned maintenance cost for same scope
- Cold restart fuel and auxiliary power cost: $35,000–$80,000 per restart event
- Ash disposal backlog cost: $15,000–$45,000 per week of lost ash handling capacity
- Title V violation penalty: $25,000–$95,000 per day per violation, each exceedance day counted separately
- EPA corrective action order costs: $100,000–$500,000 for required engineering study and implementation
- Increased compliance monitoring cost: $40,000–$120,000 per year following a reportable exceedance
- Citizen suit exposure for facilities with recurring or continuing violation patterns
- State-level penalty additive to federal enforcement in most jurisdictions
- Condition-based inspection reduces unnecessary preventive maintenance by 35–50%
- Extended component life through optimized replacement timing: 20–40% increase for major cost items
- Emergency repair premium eliminated for assets covered by predictive monitoring
- Inventory optimization through predictable maintenance scheduling and parts planning
- Reduced overtime labor: 25–35% reduction in unplanned overtime maintenance hours
- Improved capacity factor translates to $400K–$1.2M incremental annual revenue for 2–5% CF improvement
- Insurance premium impact: facilities with documented AI-driven reliability programs negotiate 5–15% better rates
- PPA compliance: avoided liquidated damages from forced outages during peak demand periods
- Repowering and expansion capital access improved with documented operational performance history
- Renewable energy credit (REC) revenue protected by demonstrated operational reliability and compliance record
Expert Review: Why Predictive Analytics Is the Missing Layer in Biomass and WtE Plant Reliability Programs
In 22 years of managing biomass, waste-to-energy, and industrial power operations across the United States, I have reviewed the root cause analysis on more than 80 unplanned outages. The finding that appears in the majority of those reports — the one that never surfaces in the executive summary — is that the data existed to predict the failure. Temperature trending on the economizer outlet. Bearing vibration on the induced draft fan. Differential pressure creep on the baghouse. The plant had the information to prevent the outage. What was missing was a system that could pull those signals out of the background noise of hundreds of daily alarms, correlate them across systems, and deliver a prioritized action that a shift team could execute with confidence. The gap is not instrumentation. It is not the quality of the operators or mechanics.
Conclusion: The 48-Hour Window That Separates Prevented Outages from Incident Reports
Biomass and waste-to-energy plant failures are not unavoidable consequences of operating complex thermal processes with variable fuel. The 48-hour average warning window that exists in sensor data before most critical equipment failures means that every unplanned outage that does occur is a failure of data utilization — not a failure of technology availability. The instrumentation exists. The data is being generated and stored in historians.
The question is whether your reliability program is connected to it. Book a Demo to see iFactory's biomass and WtE analytics platform in action.
Frequently Asked Questions
The most common cause of unplanned downtime in U.S. biomass and WtE facilities is boiler tube failure — either from erosion caused by fly ash impingement or from corrosion accelerated by chlorine and alkali compounds present in biomass and refuse-derived fuel flue gas. Tube failures are almost always preceded by detectable signatures: localized temperature excursions at the tube surface, steam side pressure and temperature trending that indicates reduced heat transfer at the affected section, and feedwater chemistry deviations that accelerate scaling and under-deposit corrosion. These signals are present in the process data for days to weeks before tube wall loss reaches the failure point. iFactory monitors boiler tube condition through steam temperature and pressure trending across each superheater and evaporator section, feedwater chemistry parameters, and flue gas temperature profile at multiple boiler elevations — applying asset-specific baselines that adapt to current fuel mix and operating conditions. When the AI model detects a tube degradation signature, it generates a prioritized inspection work order targeting the affected section during the next planned outage. The second most common downtime cause is fuel handling conveyor failure — typically bearing failure or belt tracking issues — which iFactory monitors through continuous vibration and temperature trending that detects degradation 24–72 hours before failure.
Fuel variability is the defining analytics challenge in biomass and WtE operations — moisture content can shift from 25% to 55% within a single fuel delivery, calorific value varies by fuel source, and ash composition and contaminant load change with seasonal and supply factors. A furnace temperature of 1,850 degrees Fahrenheit is normal when burning dry wood pellets but indicates a developing grate overheating condition when burning high-moisture urban wood waste.
Biomass and WtE facilities operate under multiple overlapping regulatory frameworks that iFactory's analytics platform supports. Under the Clean Air Act, Title V operating permits require continuous compliance with emission limits for NOx, CO, SO2, particulate matter, HCl, and other pollutants — with CEMS data quality assured through 40 CFR Part 60 and Part 75 QA/QC procedures. combustion temperature minimums, and activated carbon injection verification — all of which iFactory tracks continuously.
Baghouse fires in biomass and WtE facilities follow a predictable chain of events: elevated furnace exit gas temperature caused by combustion upset or fuel quality excursion, combined with a baghouse inlet temperature approaching the filter material limit, and often accompanied by elevated CO or unburned carbon carryover from incomplete combustion.
For a typical 30–50 MW biomass or WtE facility with an existing DCS or SCADA system and partial sensor coverage on critical equipment, a full iFactory deployment requires $75,000 to $160,000 in total investment over an 8–14 week implementation timeline. The cost breakdown is approximately: sensor connectivity and OPC-UA data integration for existing DCS, PLC, and CEMS networks ($18,000–$35,000); iFactory platform configuration including consequence-based risk matrix build, asset criticality registration, and condition-based inspection interval setup ($30,000–$65,000); inspection workflow automation including work order templates, escalation logic, and mobile inspection checklist deployment ($18,000–$35,000); and training and commissioning including operations team onboarding and 30-day supervised operation ($12,000–$25,000). Additional sensor hardware for assets currently without condition monitoring — furnace zone temperature thermocouples, baghouse compartment differential pressure transmitters, fuel moisture NIR sensors, conveyor vibration and temperature sensors — is typically $15,000–$35,000 depending on scope. Implementation proceeds in three stages: Stage 1 (weeks 1–3) covers asset criticality register build, sensor connectivity verification, and data validation; Stage 2 (weeks 4–8) covers risk matrix configuration, inspection workflow deployment, and initial alert threshold calibration using 60–90 days of historical data; Stage 3 (weeks 9–14) covers system optimization and operations team training to full operational confidence. ROI is typically demonstrated within the first 90 days through improved inspection compliance, extended maintenance intervals, and the first prevented failure detected before reaching the outage threshold.