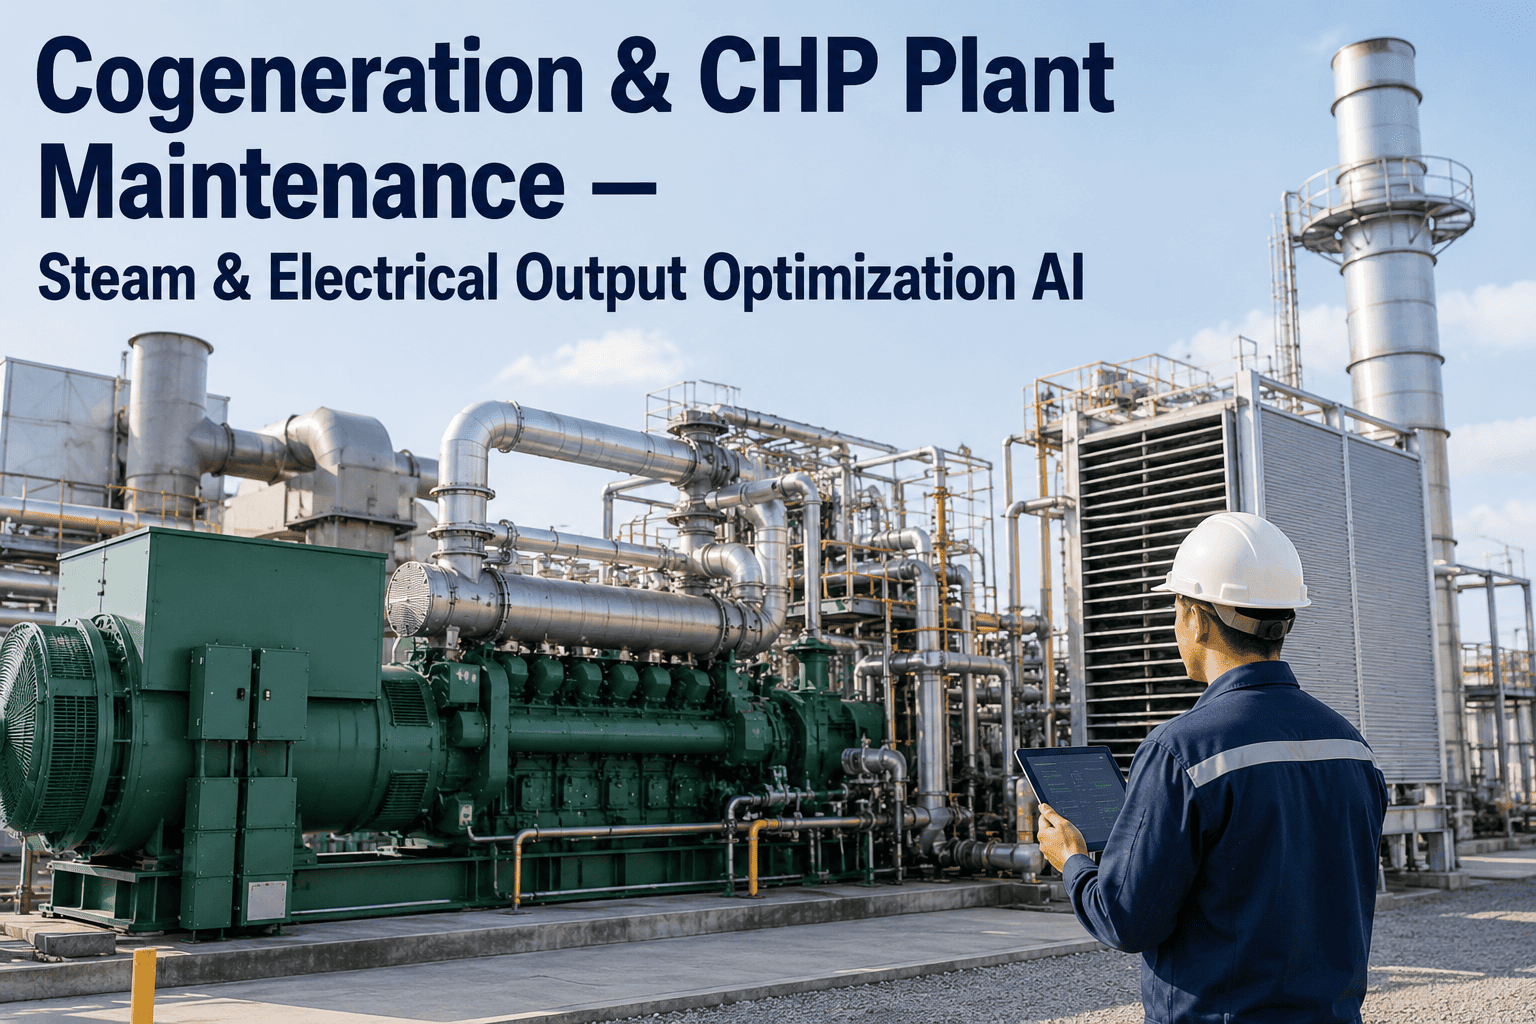
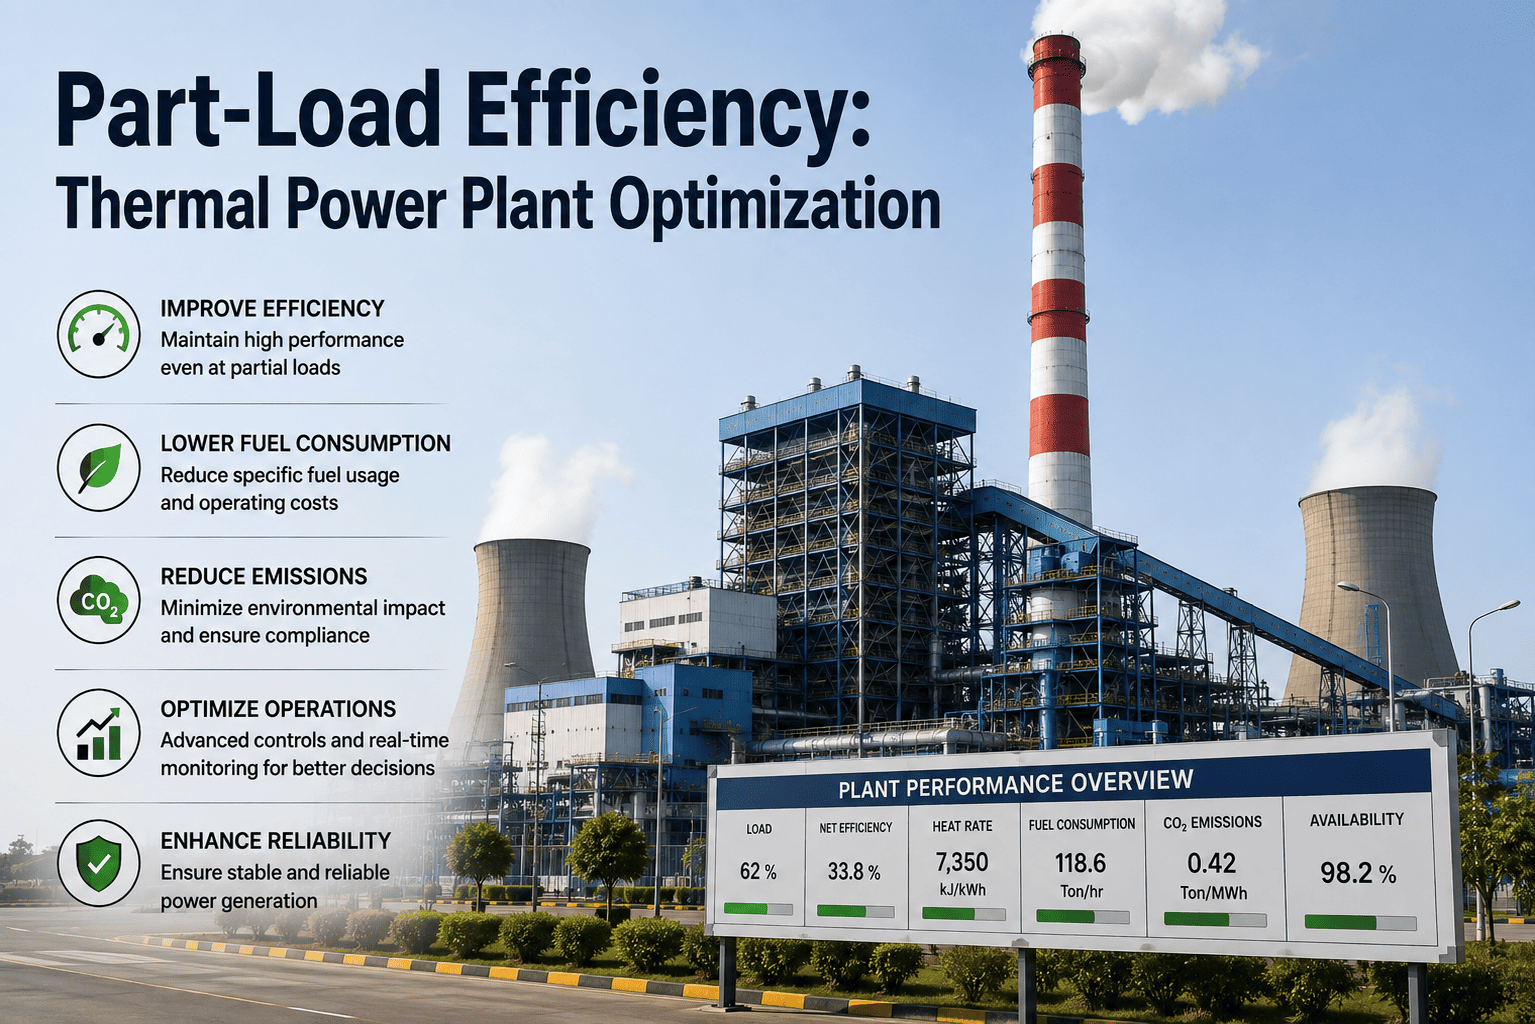
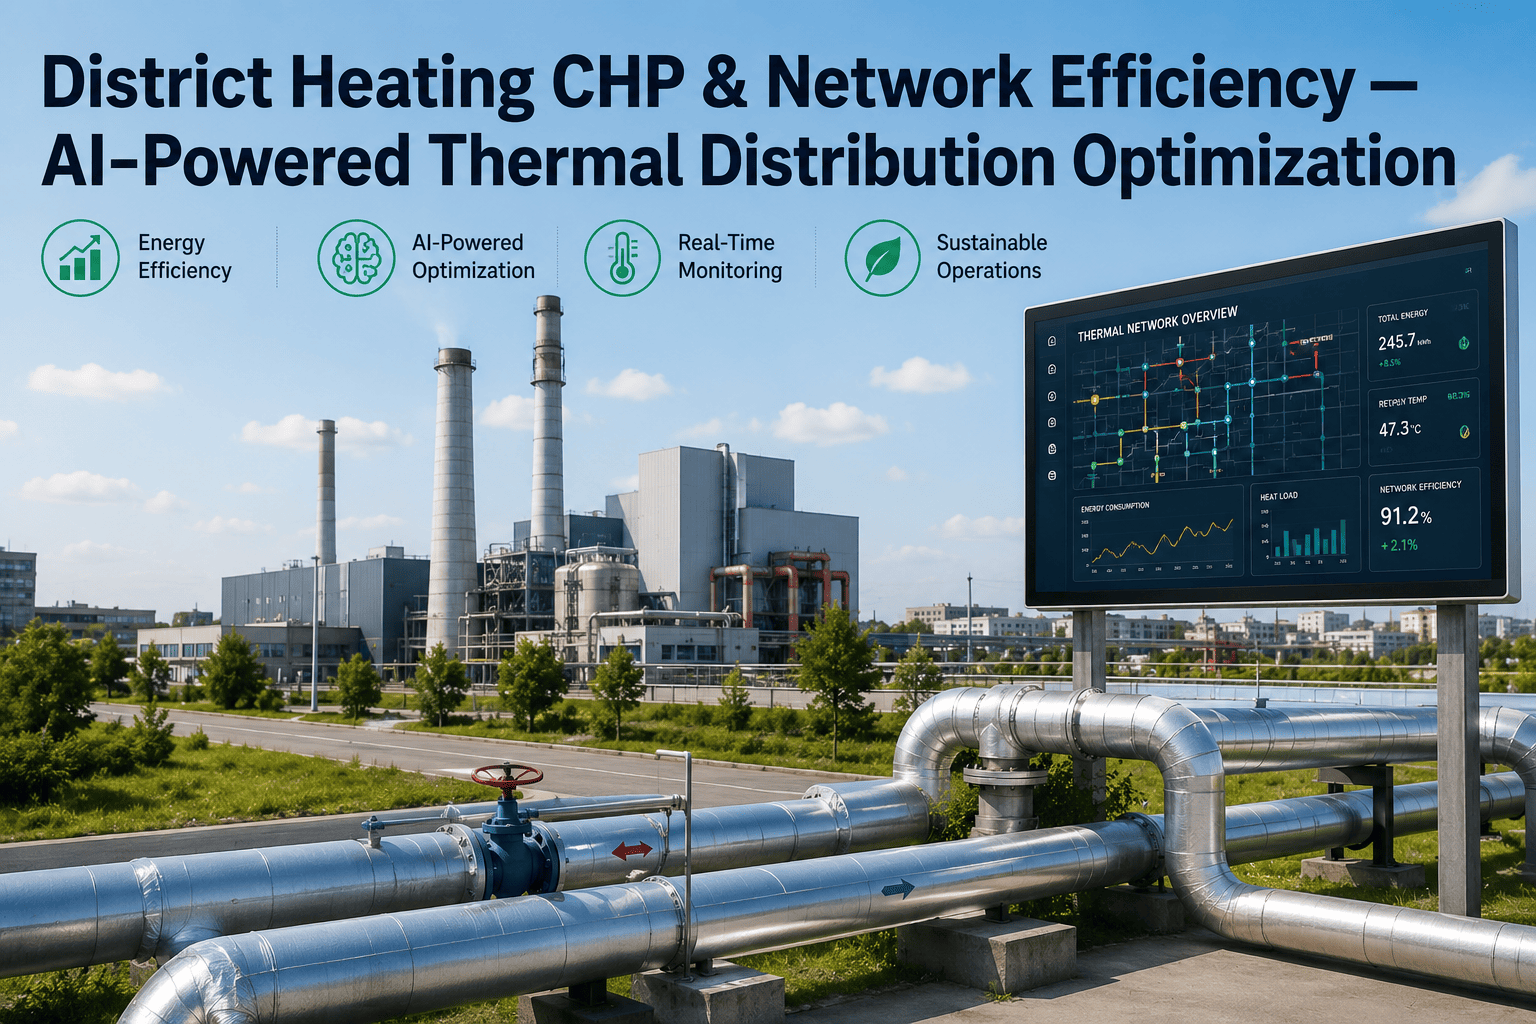
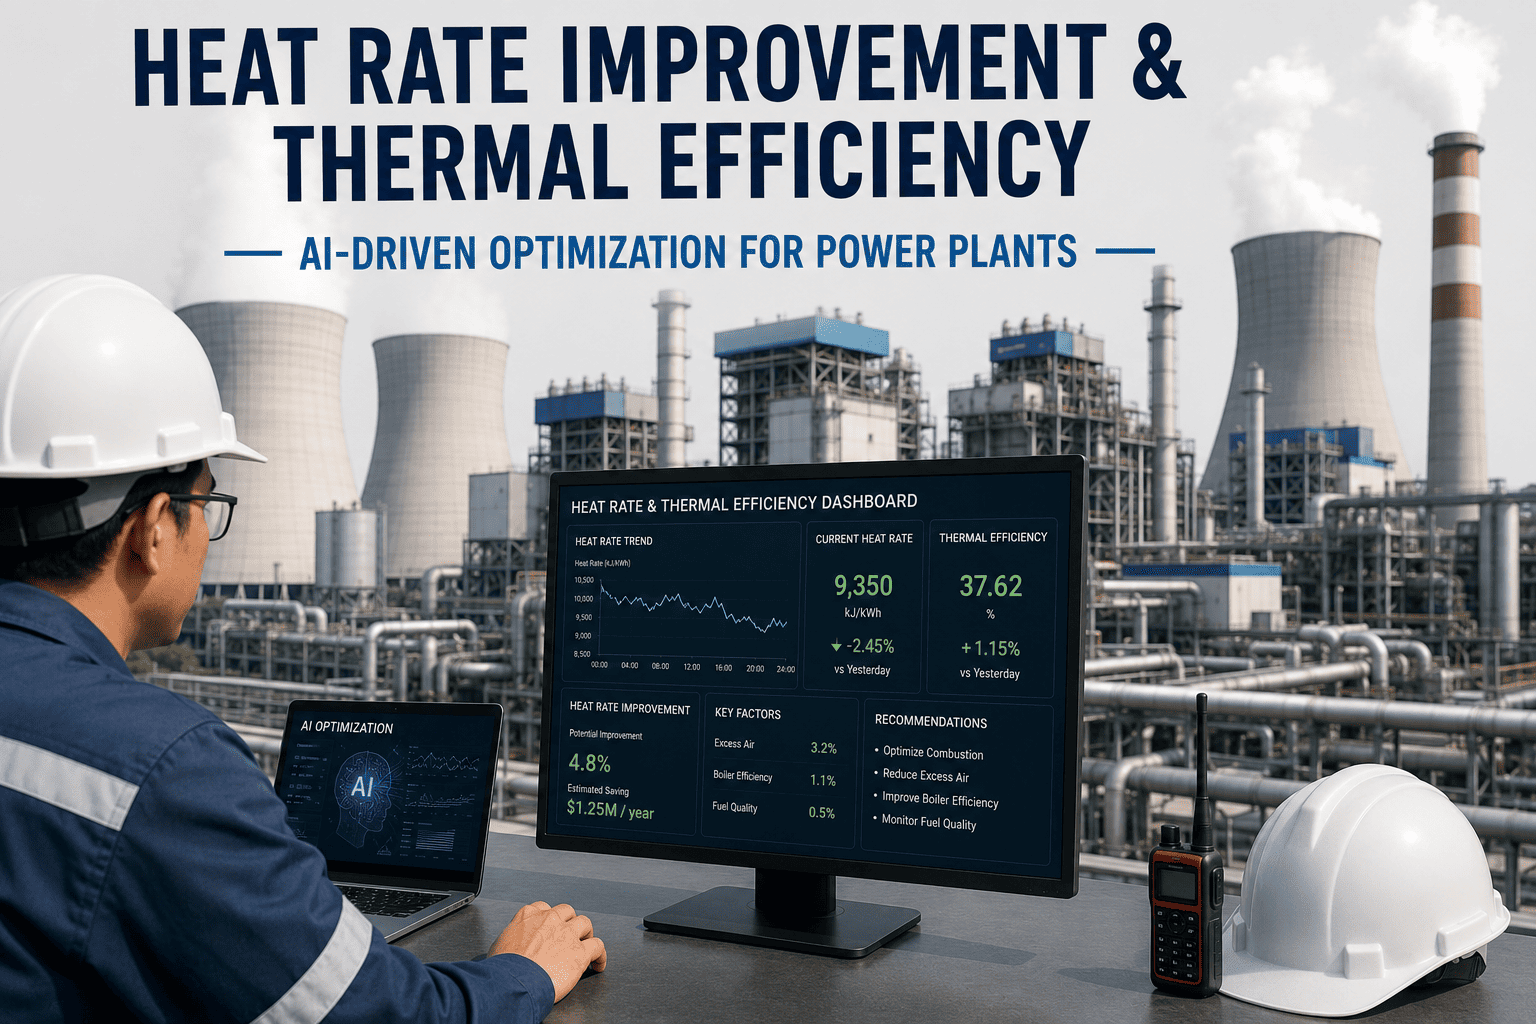
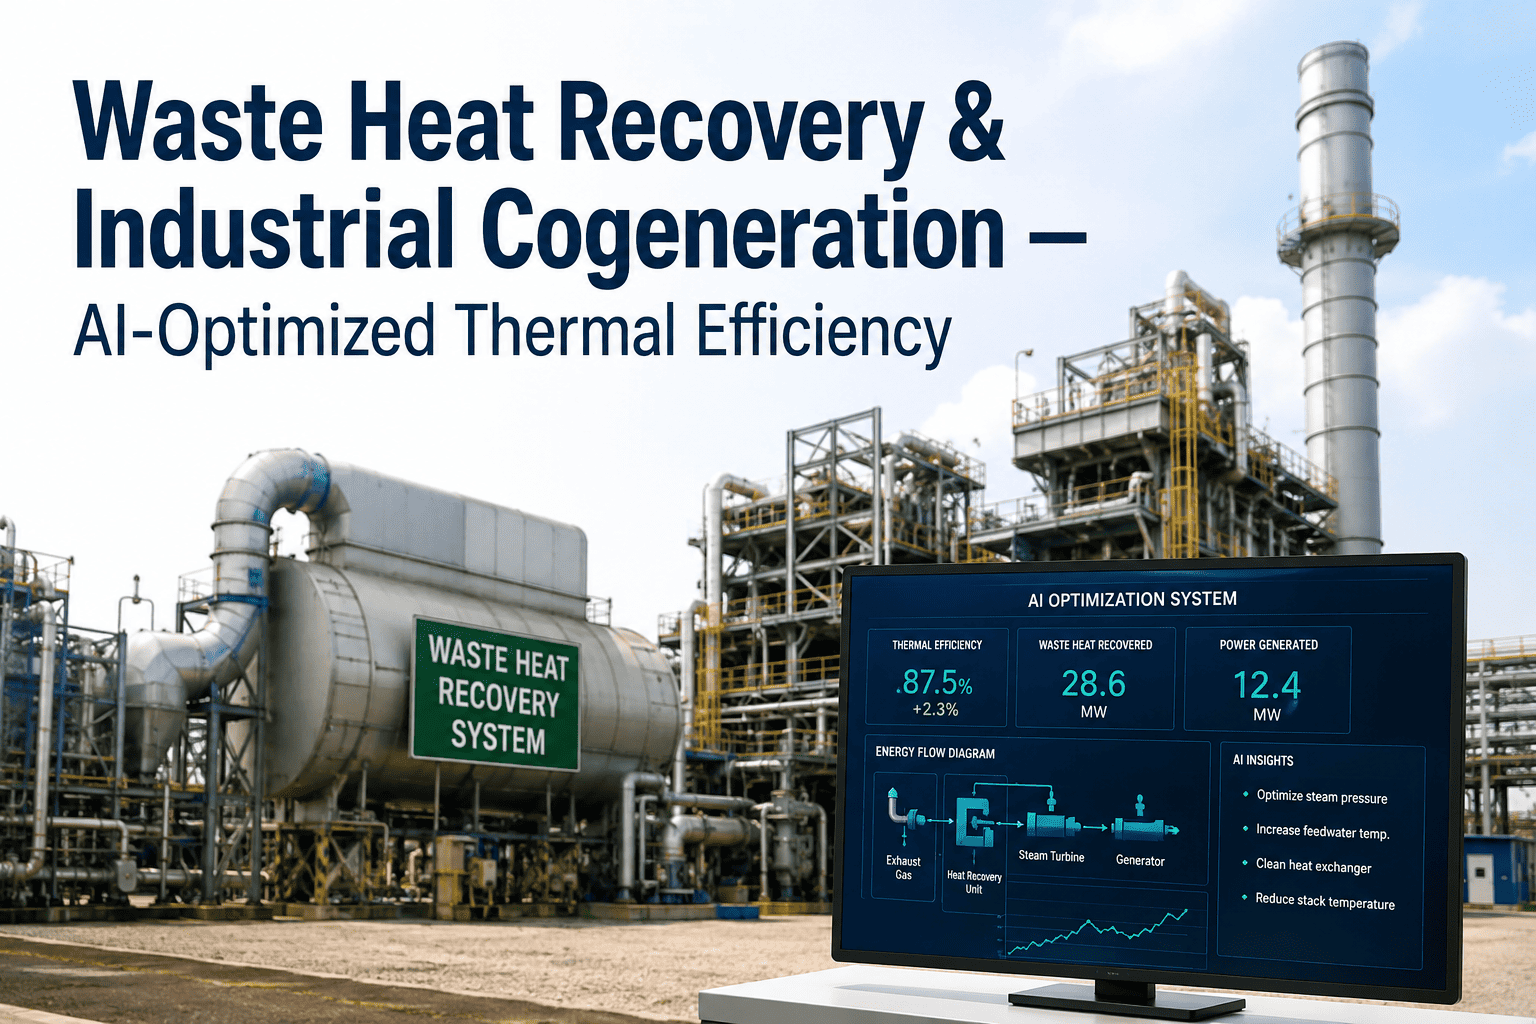
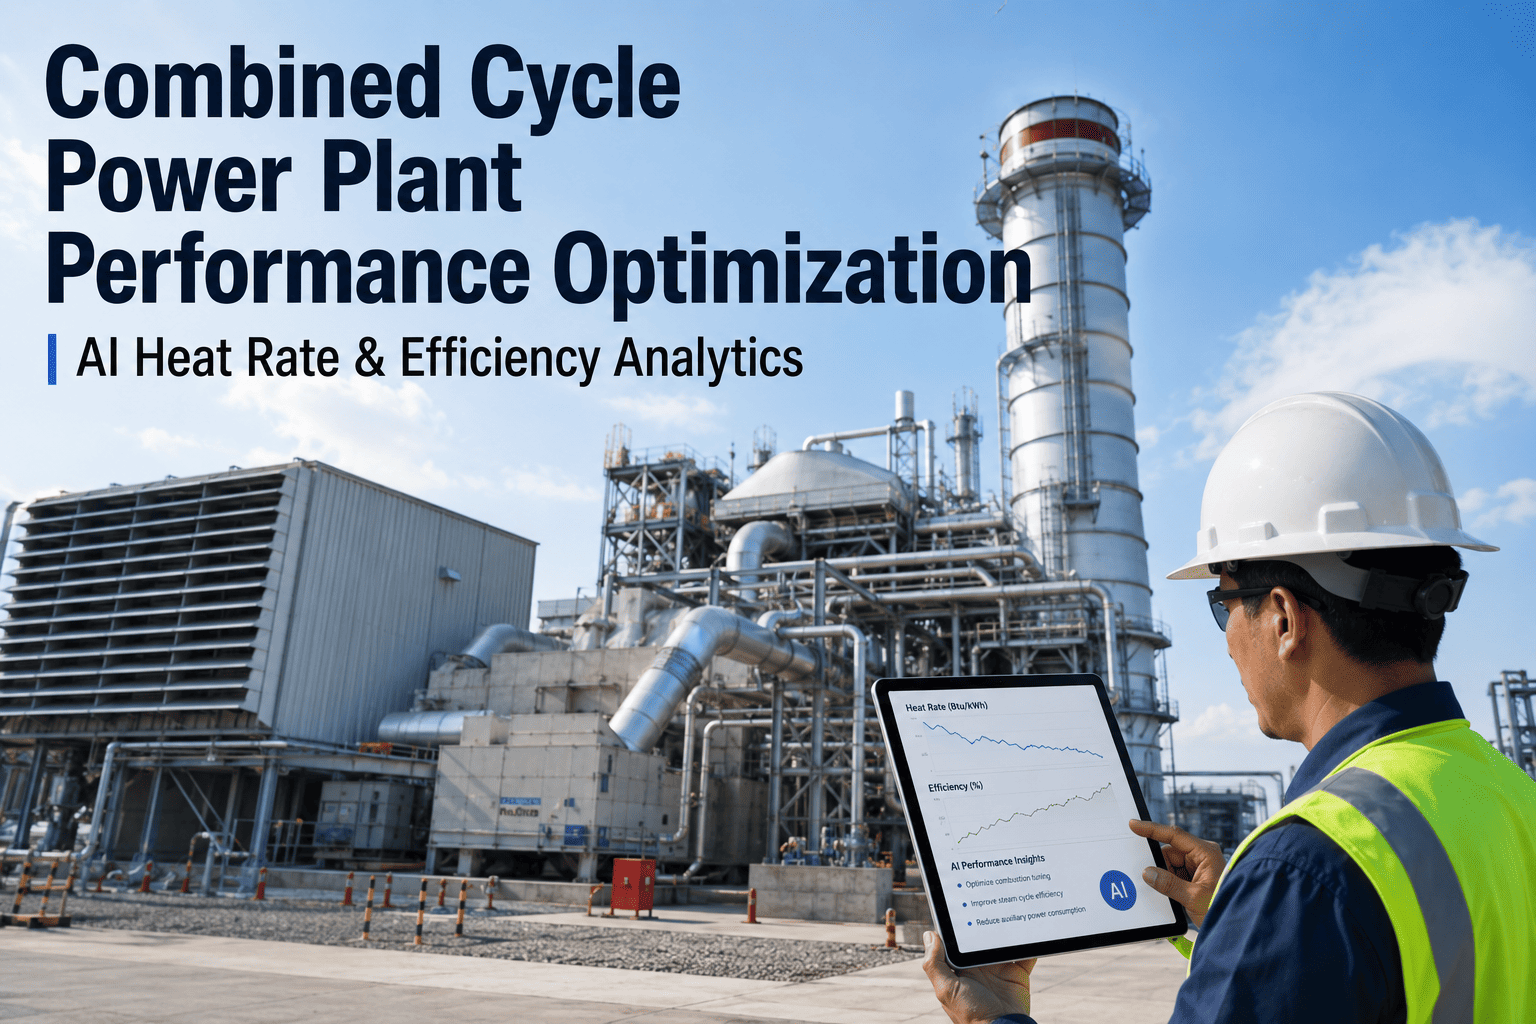
A cogeneration plant is really two power plants sharing one prime mover, which is exactly why maintenance on CHP systems is harder than either a standalone generator or a standalone boiler — a fouled heat recovery steam generator doesn't just cost thermal efficiency, it forces the electrical side to compensate, and an unplanned prime mover outage costs $8,000 to $15,000 per hour in replacement energy on top of the lost steam host obligations. Most plants still track electrical output, thermal output, and prime mover condition in three disconnected systems, discovering fouling or degradation only after generation output has already dropped 8–12%. iFactory AI Cogeneration Platform unifies dual-output monitoring into one view, tracking prime mover condition, heat recovery performance, and combined efficiency continuously so neither output stream degrades without warning. Book a Demo to see your plant's electrical and thermal output modeled side by side.
Fouled HRSG Tubes Quietly Cost 3–8% of Thermal Recovery Efficiency. AI Catches It Before the Fuel Bill Does.
iFactory tracks your prime mover, heat recovery steam generator, and combined efficiency ratio in one continuously updated model, so degradation on either the power side or the heat side surfaces weeks before it forces a supplemental boiler to pick up the slack.
Electrical Output
Prime mover health tracked continuously
Thermal Output
HRSG approach temperature trended continuously
90%+
Fuel utilization efficiency achievable at well-maintained CHP plants
4 Wks
Early warning before fouling reaches an efficiency-impact threshold
34%
Reduction in total annual boiler maintenance cost achieved
5 Wks
Deployment timeline from audit to live dual-output monitoring
Why CHP Plants Fail Twice as Often as Single-Output Plants Expect
Cogeneration plants carry the highest maintenance stakes in the fleet, because a single degradation event on the prime mover or the heat recovery side affects both revenue streams at once — and reactive maintenance approaches are structurally blind to that interaction.
01
HRSG Tube Fouling & Approach Temperature Drift
Fouled waterwall and superheater tubes reduce thermal recovery efficiency by 3 to 8%, directly increasing supplemental boiler fuel consumption long before anyone schedules a cleaning.
02
Prime Mover Wear on Reciprocating Engines
Large reciprocating engines run oil change intervals of 1,000–2,000 hours and top-end overhauls at 30,000–40,000 hours; a single cylinder failure between inspections can cost $150,000 to $300,000 to repair.
03
Economizer & Feedwater Chemistry Drift
Feedwater chemistry excursions accelerate corrosion in the economizer and HRSG tube bundles, a slow-moving risk that periodic manual sampling routinely catches only after scaling has already set in.
04
Emissions Compliance Exposure
A missed emissions test tied to undetected combustion drift can trigger regulatory fines running well into six figures per day of violation, on top of any generation losses.
One Model, Two Output Streams
iFactory's platform is built around the fact that CHP plants are not power plants with a heat exchanger bolted on — electrical and thermal performance are modeled together, not as two separate reports.
01
Prime Mover Condition Trending. Vibration, exhaust temperature spread, and combustion parameters are tracked continuously across gas turbines, reciprocating engines, or steam turbines, flagging degradation before it reaches an unplanned outage.
02
HRSG Approach Temperature Trending. Heat recovery degradation is detected weeks before it crosses the efficiency-impact threshold, enabling planned cleaning instead of emergency chemical intervention at $45,000 per event.
03
Combined Efficiency Ratio Monitoring. Power-to-heat ratio and total fuel utilization efficiency are visible continuously, not assembled into a monthly report after the losses have already occurred.
04
AI-Driven Economic Dispatch. Recommended operating points are aligned to real-time thermal load and tariff conditions, capturing fuel savings that a fixed operating schedule structurally cannot.
05
Automated CMMS & Compliance Reporting. Condition-based work orders and EPA CHP qualifying facility performance documentation are generated automatically, without manual data assembly.
A Fouled Tube Bundle Doesn't Send an Alarm. Your Fuel Bill Just Quietly Goes Up.
iFactory trends HRSG approach temperature and prime mover condition continuously, so cleaning and maintenance happen on a schedule you choose, not one an emergency forces on you.
Measured Results Across Live CHP Deployments
4 Wks
Fouling Detection Lead Time
Average warning before HRSG fouling reaches a measurable efficiency impact.
34%
Lower Annual Boiler Maintenance Cost
Total cost reduction after eliminating emergency chemical cleaning events.
90%+
Achievable Fuel Utilization Efficiency
Versus 33–45% at separate electrical and thermal generation.
0
Emergency Chemical Cleaning Events
Eliminated once fouling acceleration is caught ahead of threshold.
5-Week Deployment Plan
Weeks 1–2
Discovery & Model Design. Prime mover, HRSG, and historian data are reviewed, and combined efficiency models are calibrated to your specific fuel mix and thermal load profile.
Weeks 3–4
Pilot & Validation. Live monitoring activated on the prime mover and heat recovery train, validated against actual plant performance and maintenance history.
Week 5
Full Rollout. Coverage expands across every generating and heat recovery asset, with automated compliance reporting activated for applicable frameworks.
Live Deployment Result
Industrial Cogeneration Plant
Thermal Performance Models Eliminate Emergency Chemical Cleaning
An industrial cogeneration plant operating natural gas and biomass-fired boilers experienced progressive efficiency derating from undetected tube fouling that fixed-interval cleaning schedules failed to catch. Manual process data reviews were only detecting fouling after generation output had already declined 8 to 12%, requiring emergency chemical cleaning at $45,000 per event. iFactory deployed thermal performance models trained on 30 months of flue gas temperature, heat transfer coefficient, and fuel consumption data, identifying fouling acceleration signatures 4 weeks before efficiency impact became measurable. Scheduled cleaning intervals were optimized to actual fouling rates, eliminating emergency chemical cleaning entirely and reducing total annual boiler maintenance cost by 34%.
4 Wks
Fouling warning lead time
34%
Lower annual boiler maintenance cost
0
Emergency chemical cleaning events since deployment
Built for CHP Compliance & Asset Frameworks
EPA CHP Qualifying Facility
Fuel utilization efficiency and qualifying facility performance calculations generated automatically from operational records.
ASME Boiler & Pressure Vessel Code
Safety valve testing intervals and tube bundle inspection documentation structured to support ASME-aligned maintenance records.
ISO 55001 Asset Management
Lifecycle cost tracking and risk-based maintenance planning across prime mover and heat recovery assets, aligned with certification audits.
EPA Emissions Reporting
Combustion parameter trending supports emissions compliance documentation, reducing exposure to per-day violation penalties.
What Plant Managers Say About iFactory
We used to manage the engine side and the steam side as two separate problems with two separate teams looking at two separate screens. iFactory put both in front of us together, and the first thing it caught was HRSG fouling that our monthly efficiency report hadn't flagged yet. We haven't had an emergency chemical cleaning since, and our fuel cost per megawatt has come down enough that finance actually asks about it now.
Plant Manager
Industrial Cogeneration Facility
Frequently Asked Questions
Does iFactory work with both reciprocating engine and gas turbine prime movers?
How does iFactory detect HRSG fouling before it shows up in monthly efficiency reports?
Approach temperature, heat transfer coefficient, and flue gas temperature are trended continuously rather than sampled monthly, which is what allows fouling acceleration signatures to surface roughly four weeks before the efficiency impact becomes measurable in a standard report.
Can iFactory help with EPA CHP qualifying facility and emissions documentation?
Yes. Fuel utilization efficiency and qualifying facility performance calculations are generated automatically from operational records, and combustion parameter trending supports ongoing emissions compliance documentation without manual assembly.
Book a demo to see a sample compliance report.
What data sources does iFactory need from our plant historian and CMMS?
iFactory typically connects to existing DCS or historian tags for temperature, pressure, and flow data, alongside CMMS work order history, with the specific tag mapping and integration scope confirmed during the Week 1–2 discovery audit.
How quickly can we expect to see a change in fuel cost or maintenance spend?
Pilot monitoring on the prime mover and heat recovery train goes live in Weeks 3–4, with most sites able to identify their first actionable fouling or degradation signature within that pilot window, ahead of full site-wide rollout in Week 5.
Request the full 5-week deployment scope for CHP plants.
Stop Letting Fouling and Prime Mover Wear Quietly Erase Your CHP Margin
iFactory gives cogeneration plants one continuous view of electrical and thermal performance, automated CMMS work orders, and EPA-aligned compliance reporting, fully deployed in five weeks.
4-week fouling detection lead time
34% lower annual boiler maintenance cost
90%+ achievable fuel utilization efficiency
Automated EPA CHP compliance documentation
Combined electrical & thermal efficiency modeled as one system