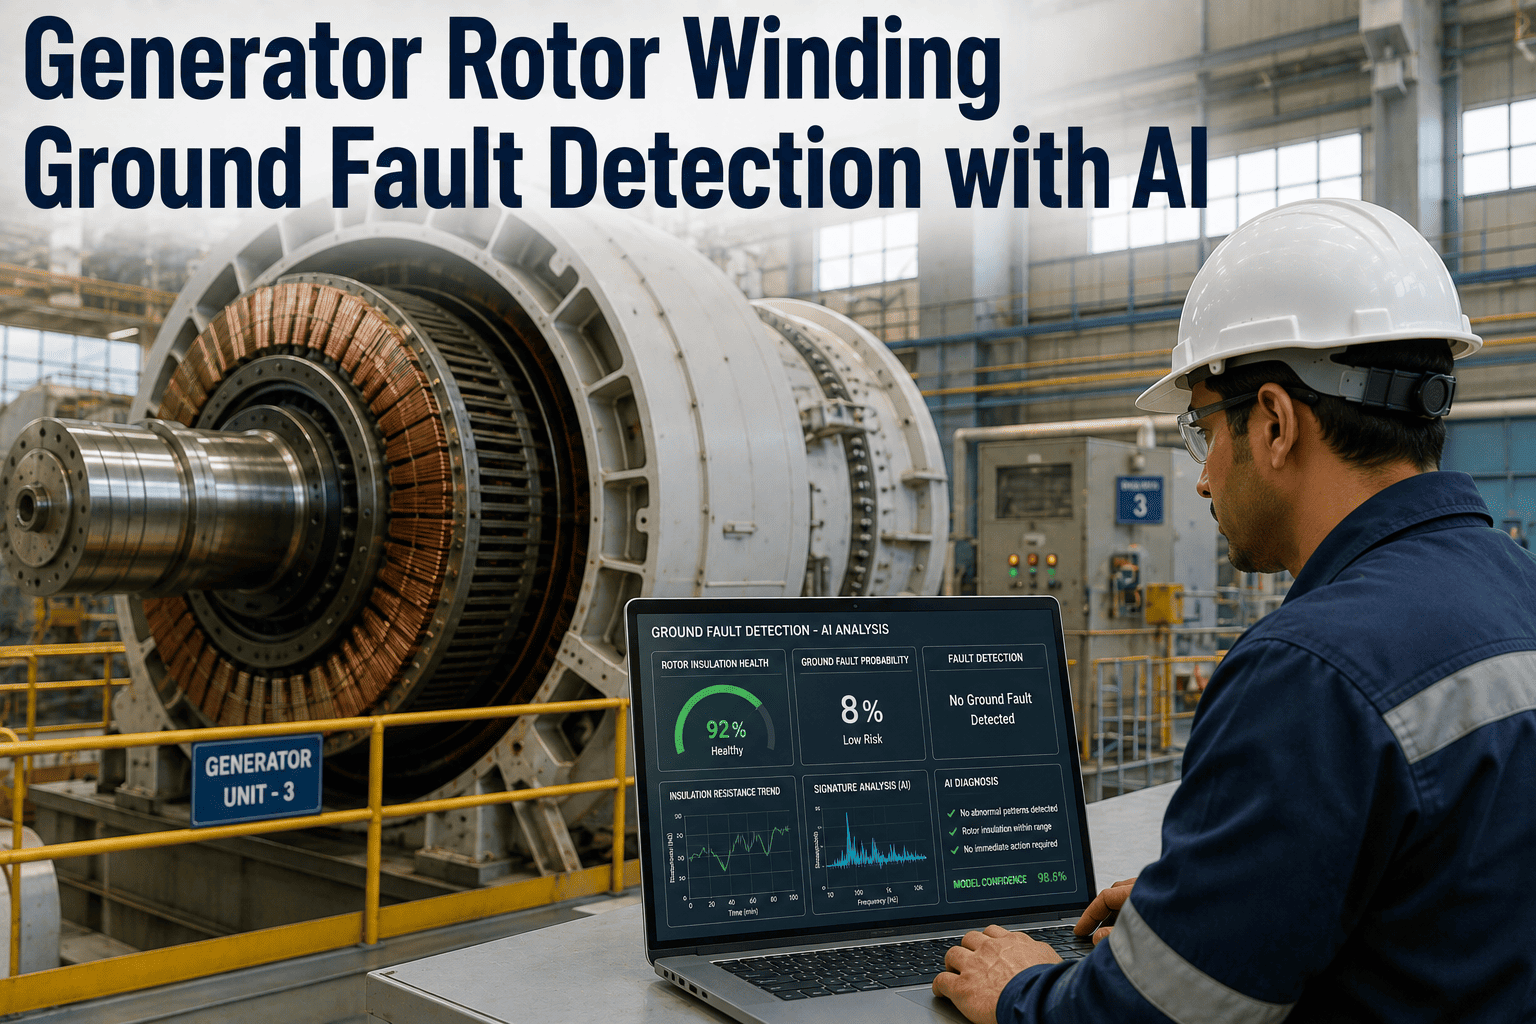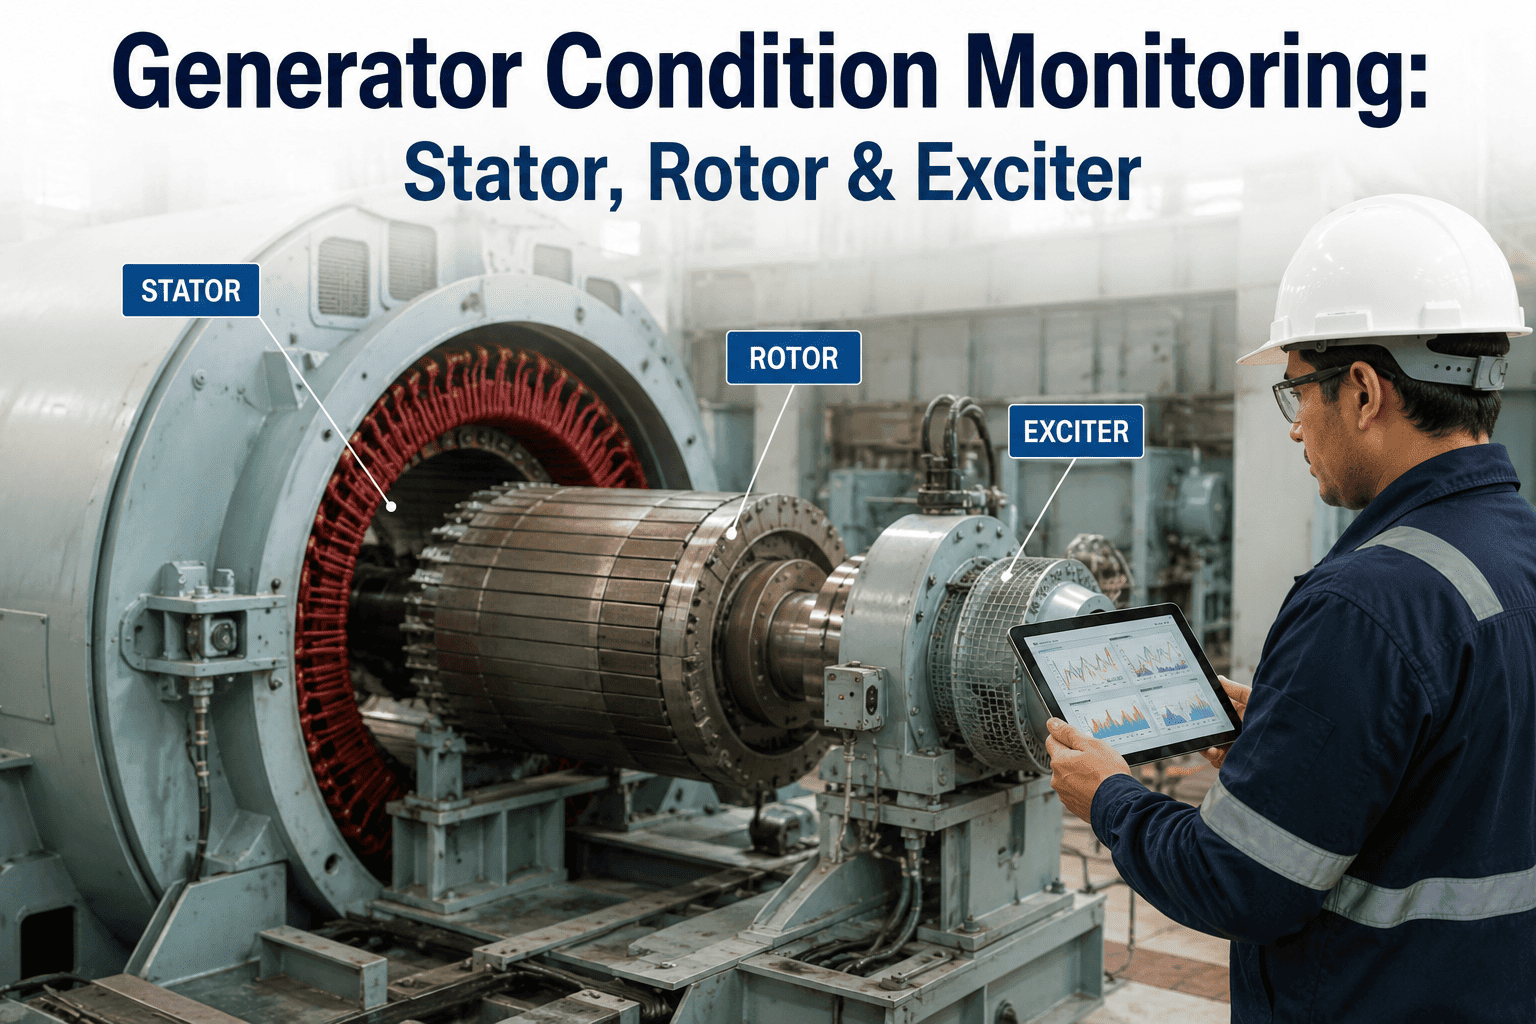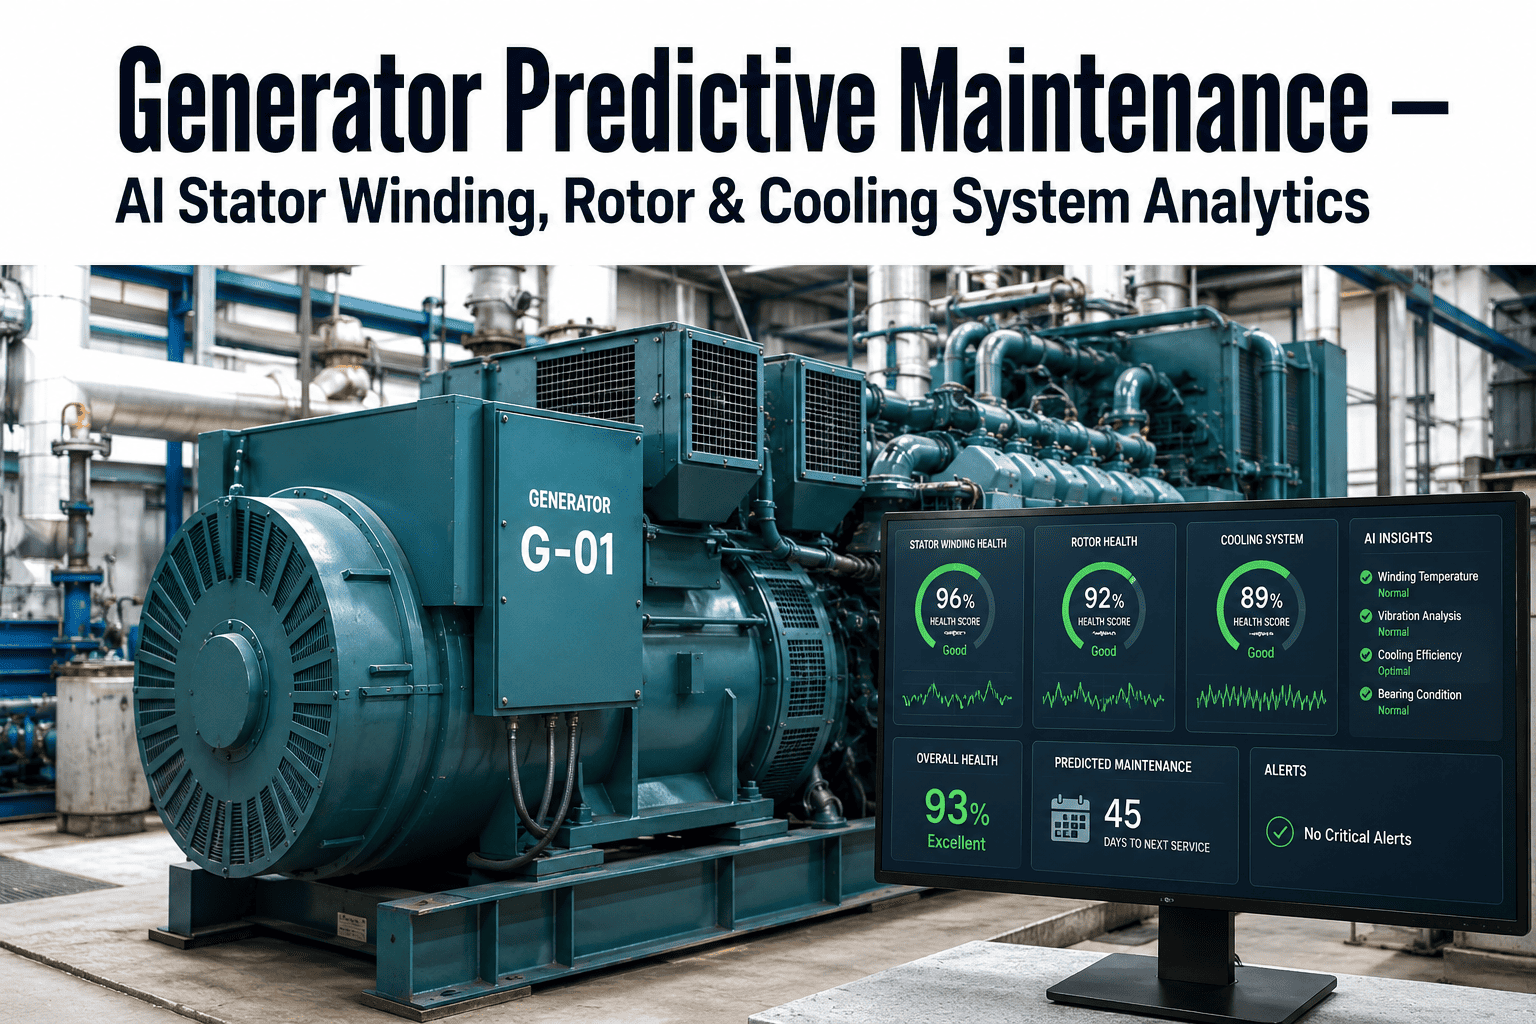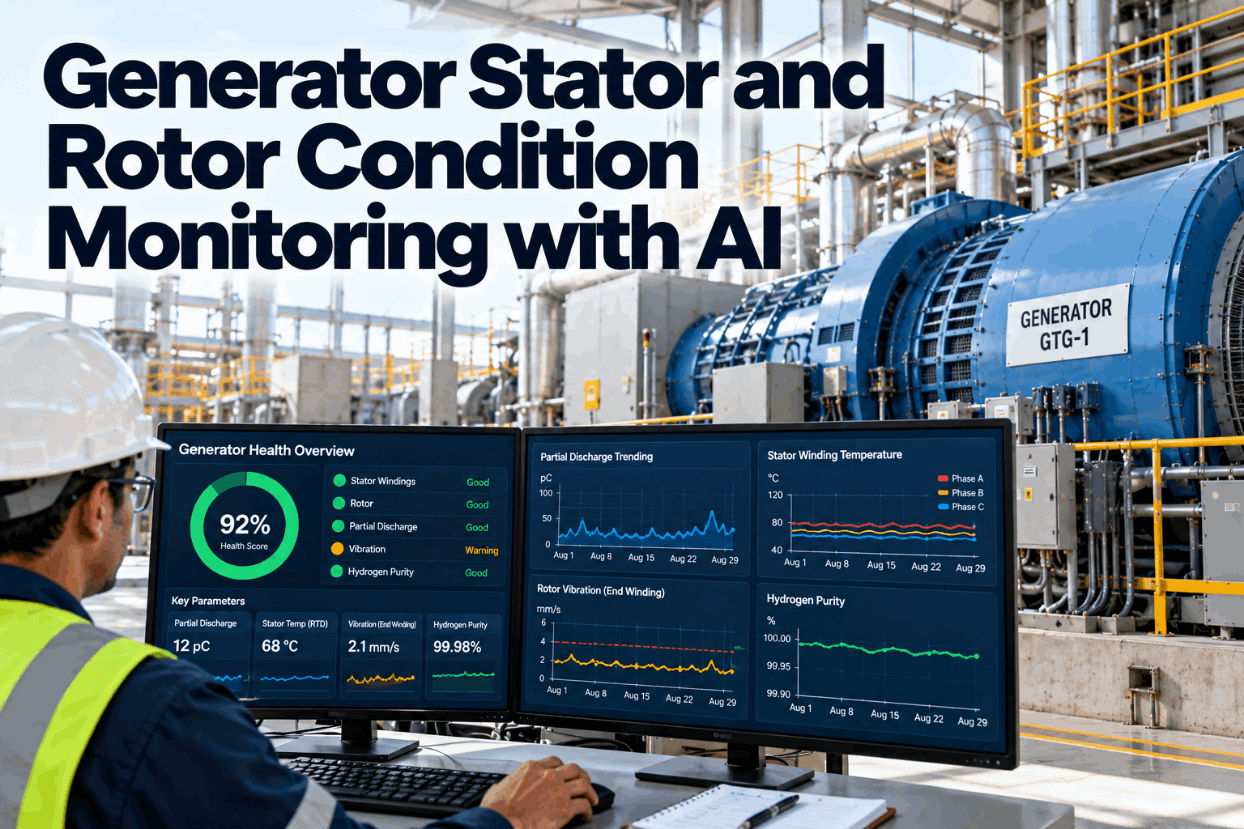
A generator rarely fails without warning. Stator insulation ages, end windings loosen and rotor turns short over months or years, and each change leaves a trace somewhere. The traces sit in different places: partial discharge in one system, stator temperatures in the DCS and hydrogen purity on a local panel. Generator condition monitoring with AI reads these signals together, so one change is checked against the others. This guide shows how it builds one score and an outage plan. Talk it through in a generator review.
Generator Stator and Rotor Condition Monitoring with AI
Partial discharge, stator temperatures, flux probe and hydrogen data combined into one health score, with a plain explanation of what moved and which inspections to plan for the next outage.
- Stator and rotor evidence read together
- Trends explained in plain words
- Inspection list ready for the outage
Down from 79 in six months
Why One Generator Signal Is Not Enough
Each signal moves for more than one reason.
Every generator monitoring signal is affected by how the unit runs. Partial discharge changes with load, voltage, temperature and humidity. Stator RTD readings follow load and coolant temperature. Flux probe results depend on where the rotor flux crosses zero, which shifts with real and reactive load. Read alone, a rise in any one of them can be a real defect or just a change in operating point. Read together, at similar load and temperature, the picture is much clearer. A PD rise with no other change may be worth watching. A PD rise in the same area as a warmer RTD deserves an engineer's attention. Our generator specialists can look at how your data is read today.
Signals on separate screens
- PD report reviewed once a quarter
- RTDs alarm only at a fixed limit
- Flux probe test filed after start-up
- Hydrogen readings on a local panel
One generator health model
- All signals compared at similar load
- Changes checked against each other
- One score with a written reason
- Inspection list for the next outage
The Evidence Streams in a Generator Health Model
Six inputs, each with its own job.
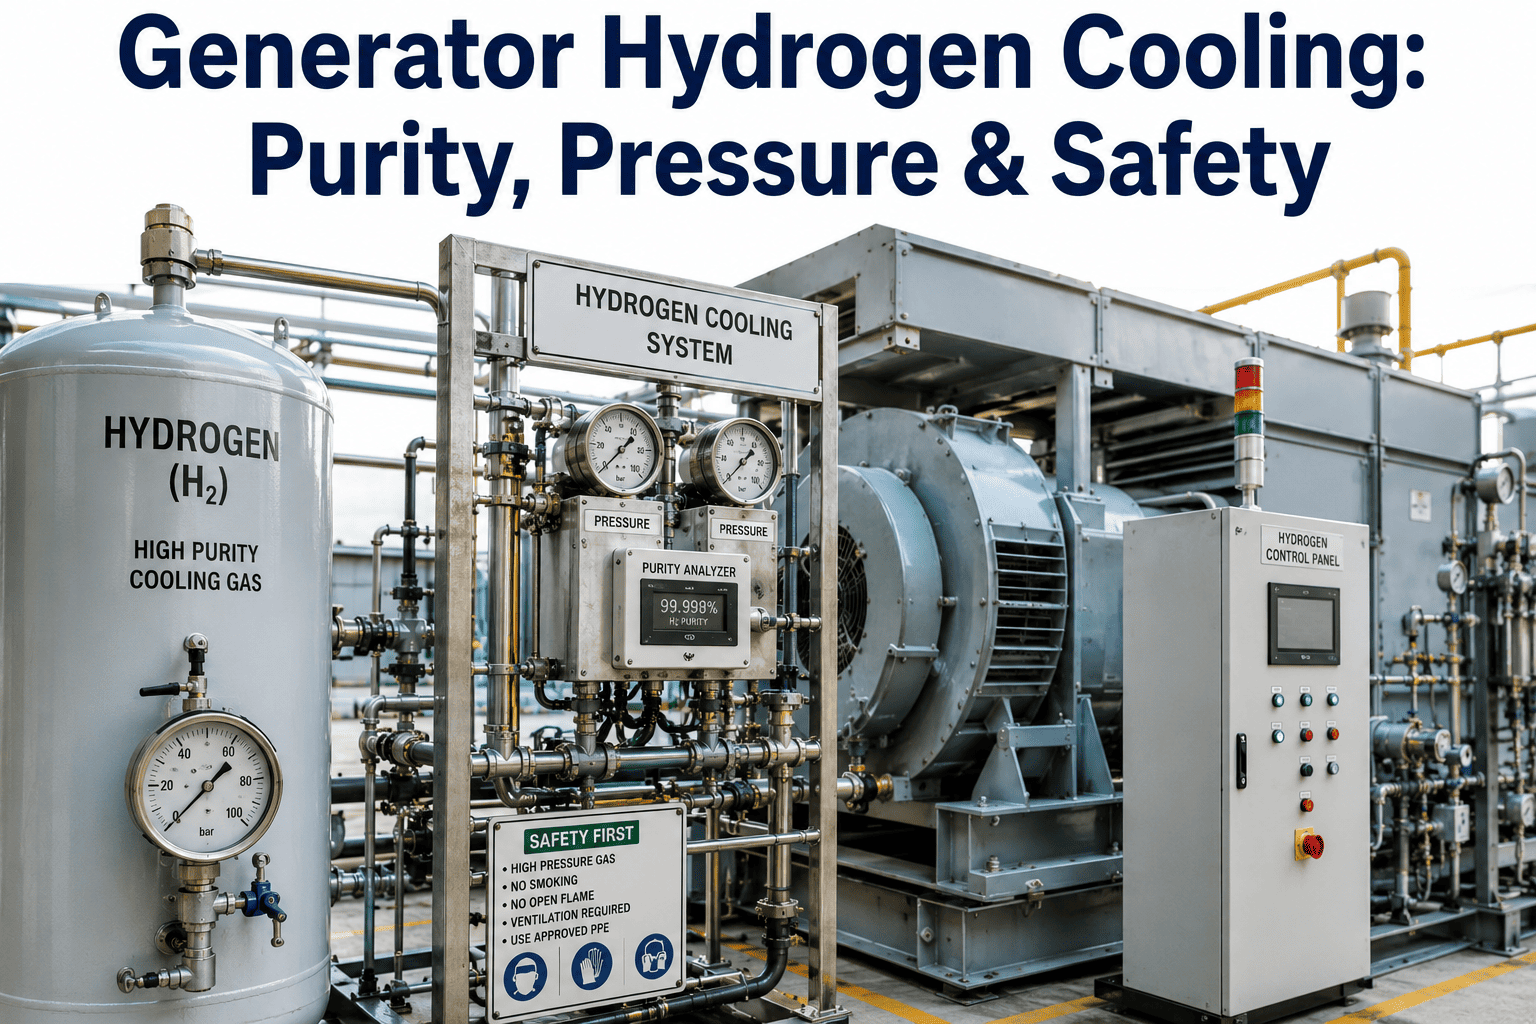
A generator health model draws on the sensors your unit already has. Not every generator has all of them, and the model works with what is fitted. Partial discharge and stator temperatures speak for the stator insulation. End winding vibration speaks for the support structure. The flux probe speaks for the rotor winding. Hydrogen purity and dew point speak for cooling and for moisture, which affects both windings and rotor parts. Check which inputs your units have in a working session.
Partial discharge
Small sparks in aging or damaged insulation.
Winding temperature
RTDs in the slots show local heating.
End winding vibration
Loosening of the end winding supports.
Flux probe
Slot flux peaks reveal shorted turns.
Hydrogen purity
Lower purity raises windage losses.
Hydrogen dew point
Moisture in the gas threatens windings and rings.
What Each Signal Can and Cannot Tell You
Know what else moves a signal before blaming the winding.
The guides behind these methods are clear that readings must be compared with care. IEEE 1434 is the IEEE guide to measuring partial discharge in AC machines, on-line and off-line, and IEC TS 60034-27-2 covers on-line PD on stator windings. IEEE 1129, the guide for online monitoring of large synchronous generators, covers end winding vibration among other signals. The matrix below sums up what each signal shows and what else can change it. Get help reading your own data from our engineering team.
IEEE 1434 (2014 edition) is now listed by IEEE as inactive-reserved but remains a common reference.
How Signals Confirm Each Other
Two signals pointing the same way carry more weight than one.
The value of a combined model is in the cross-checks. Shorted rotor turns, for example, can show as smaller slot peaks on the flux probe, a need for more field current at the same load and vibration that changes with field current. When two or three of these agree, the case is stronger. On the stator, rising PD with warmer RTDs in the same area points to one place to look. Rising dew point with falling purity points to the seal oil system or the dryer. When only one signal moves and the others stay steady, the model says so plainly and suggests watching the trend rather than acting at once. Map the cross-checks for your unit in a short session.
Shorted turns
Flux peaks, field current and vibration.
Insulation
PD trend with local RTD heating.
Supports
End winding vibration and PD pattern.
Gas quality
Purity and dew point together.
See Your Generators in One Health Score
PD, RTD, flux probe and hydrogen data combined, each change explained in plain words and an inspection list built for your next outage.
Trend Explanations in Plain Words
A score is only useful if you can see why it moved.
A health score that falls without a reason raises more questions than it answers. Each change in the model comes with a short explanation: which signals moved, by how much, at what load and temperature, and what that pattern has meant in the past. The engineer can ask follow-up questions, open the readings behind the answer and add notes from the plant floor that the sensors cannot see. The AI suggests. The engineer decides whether it matters and what to do. See it in a short demo.
From Health Score to Outage Inspection Plan
The best time to act on a trend is the next planned outage.
Most generator problems found early can wait for a planned outage, but only if the outage scope includes the right checks. The model turns each open finding into a suggested inspection, so the scope is built from evidence rather than habit. Findings that are still weak are listed as watch items, so they are checked without crowding the outage. Your generator engineer reviews the list and decides what goes into the outage plan. After the outage, what was found is fed back, so the model learns which patterns mattered. Build your next outage scope in a planning call.
Baselines and Insulation Aging
Compare each generator with its own past, at the same conditions.
Insulation aging is slow, so the trend matters more than any single reading. PD results from different sensor types and providers cannot be compared directly, so each unit is best judged against its own baseline, taken at similar load, voltage and temperature. The model bins readings by operating point before it compares them. That keeps a hot summer week or a low-load period from looking like damage. It also means a sensor change or a new PD provider needs a fresh baseline, so the old and new data are not mixed by mistake. Ask our team how baselines are set.
Worked example only: (180 − 120) ÷ 120 = 50%. Both readings at similar load and winding temperature. A rise is a reason to look closer, not a verdict.
Generator Condition Monitoring Checklist
Eight checks before the health model goes live.
Use this checklist for one generator first. Tick the items already in place. Get help with any gaps from our setup team.
Generator Monitoring Mistakes to Avoid
Data that nobody compares is data that warns nobody.
These patterns weaken generator monitoring programs most often. A short monitoring review can find them.
What works
- Readings compared at similar load
- Each unit judged against its own baseline
- Findings confirmed with offline tests
- Outage results fed back into the model
What fails
- PD numbers compared across sensor types
- RTDs watched only for a fixed alarm
- Flux probe data taken at one load only
- Hydrogen readings left off the review
How iFactory Runs Generator Condition Monitoring
The Generator Health Model, on your own network.
iFactory's Generator Health Model combines PD, RTD, flux probe and hydrogen data into one health score, with trend explanations and inspection recommendations for the next outage. It runs on an on-prem AI server inside your plant.
Combined data
PD, RTD, flux probe and hydrogen.
Health score
One score per generator.
Like-for-like
Readings compared at similar load.
Trend explanations
What moved and why it matters.
Outage list
Inspections for the next outage.
Feedback
Outage findings check the model.
Inspection scope, test choices and run decisions remain with your engineers. Figures on this page are worked examples.
Turnkey AI: Delivered, Connected and Live in 6–12 Weeks
You do not build this. It arrives ready.
iFactory ships as a pre-configured NVIDIA AI server with the software pre-loaded, racked and ready. Rack it, plug in power and Ethernet, and the AI is live on your network. Our team handles cabling, network setup, PLC, SCADA, DCS and CMMS integration, PD monitor and historian links, operator training and 24×7 remote monitoring. Data stays on your network. For a scope matched to your plant, request a turnkey quote.
Ship, network and data
Server installed. PD, RTD, flux probe and hydrogen data connected with load and cooling context.
Model training and pilot
Baselines set per unit. Health model and trend explanations piloted on one generator.
Go-live and training
Health model live. Engineers trained. 24×7 monitoring begins.
Frequently Asked Questions
What is generator condition monitoring?
Tracking stator, rotor and cooling signals over time to find insulation, winding and support problems before they cause a failure.
What does partial discharge monitoring show?
Small discharges in stator insulation. A rising trend can point to aging, loose coils or contamination. IEEE 1434 and IEC TS 60034-27-2 guide the measurement.
How does a flux probe find shorted rotor turns?
It measures slot leakage flux as each rotor slot passes. A coil with shorted turns gives a smaller peak than its partner on the other pole.
Why monitor hydrogen purity and dew point?
Lower purity raises windage losses, and moisture in the gas can harm windings and retaining rings.
What causes end winding vibration?
Electromagnetic forces on the winding. It grows when supports loosen or a natural frequency comes close to the forcing frequency.
Does the model set alarm limits?
No. Limits come from your OEM and engineers. The model flags trends and explains them.
Does it replace offline tests?
No. It helps decide which offline tests and inspections to plan for the next outage.
What if we lack some sensors?
The model works with the signals fitted and shows which gaps limit what it can see.
How do we start?
Start with one generator and the sensors it has. A 6-week pilot connects data, sets baselines and runs the health model. To plan it, contact our team.
Know Which Winding Needs a Look Next Outage
In thirty minutes we review your generator data sources and show which signals are read together today and which are not. You keep the review either way.
- 1Recent PD monitoring reports
- 2Stator RTD trends at full load
- 3Last flux probe test results
- 4Hydrogen purity and dew point logs
- 5Your last outage inspection report