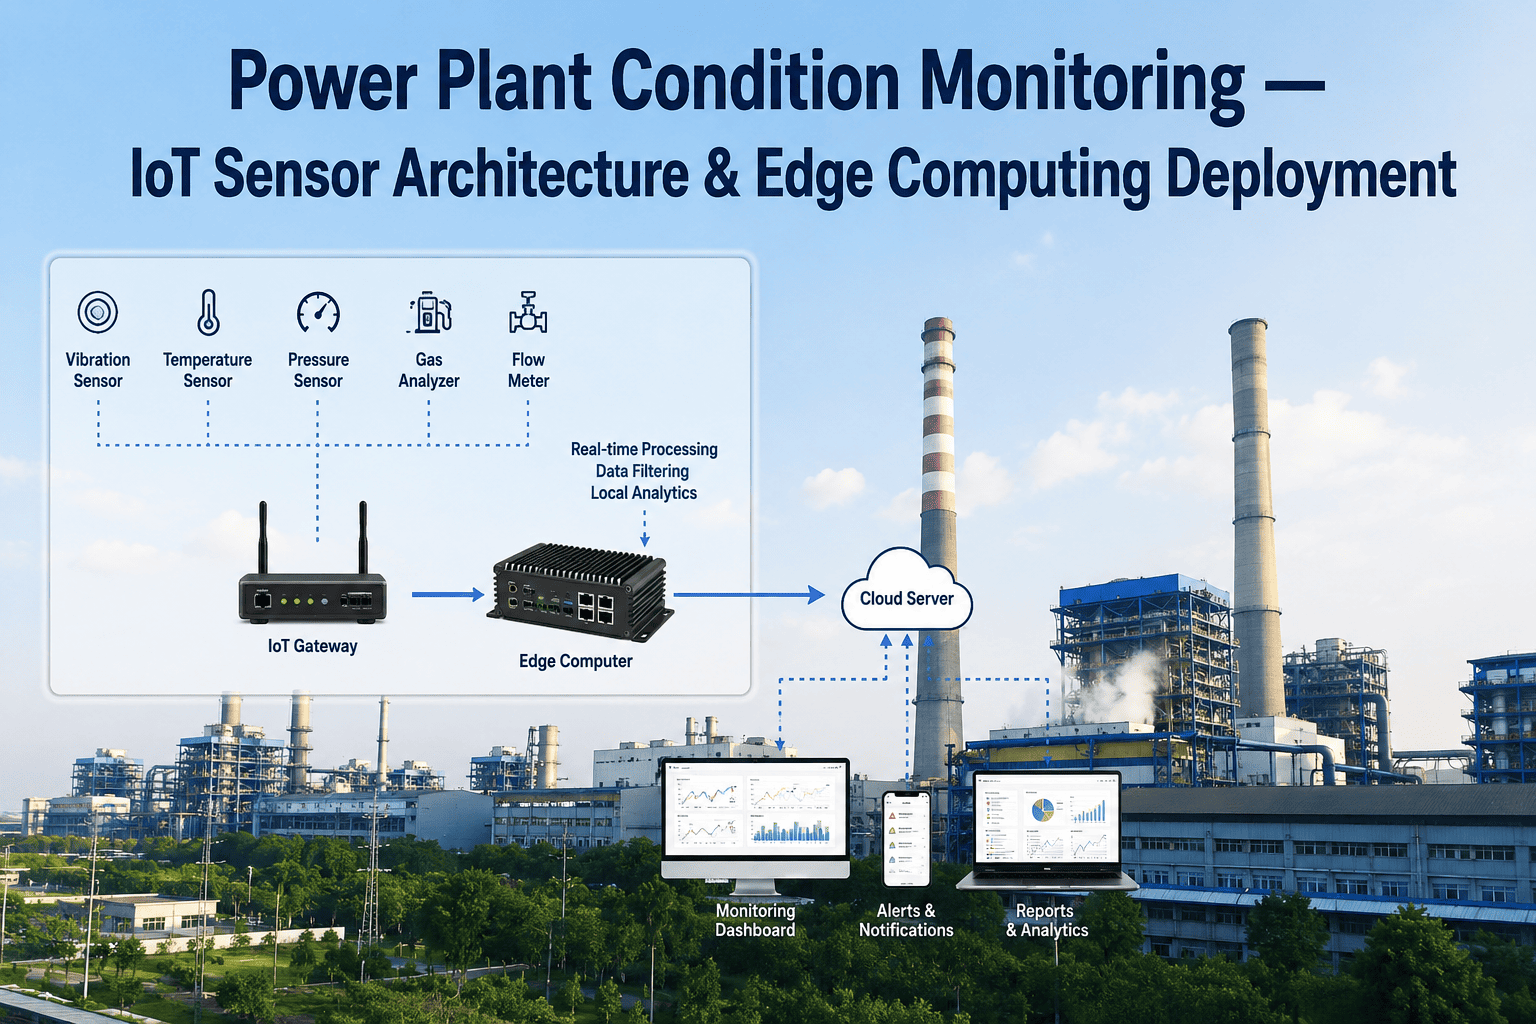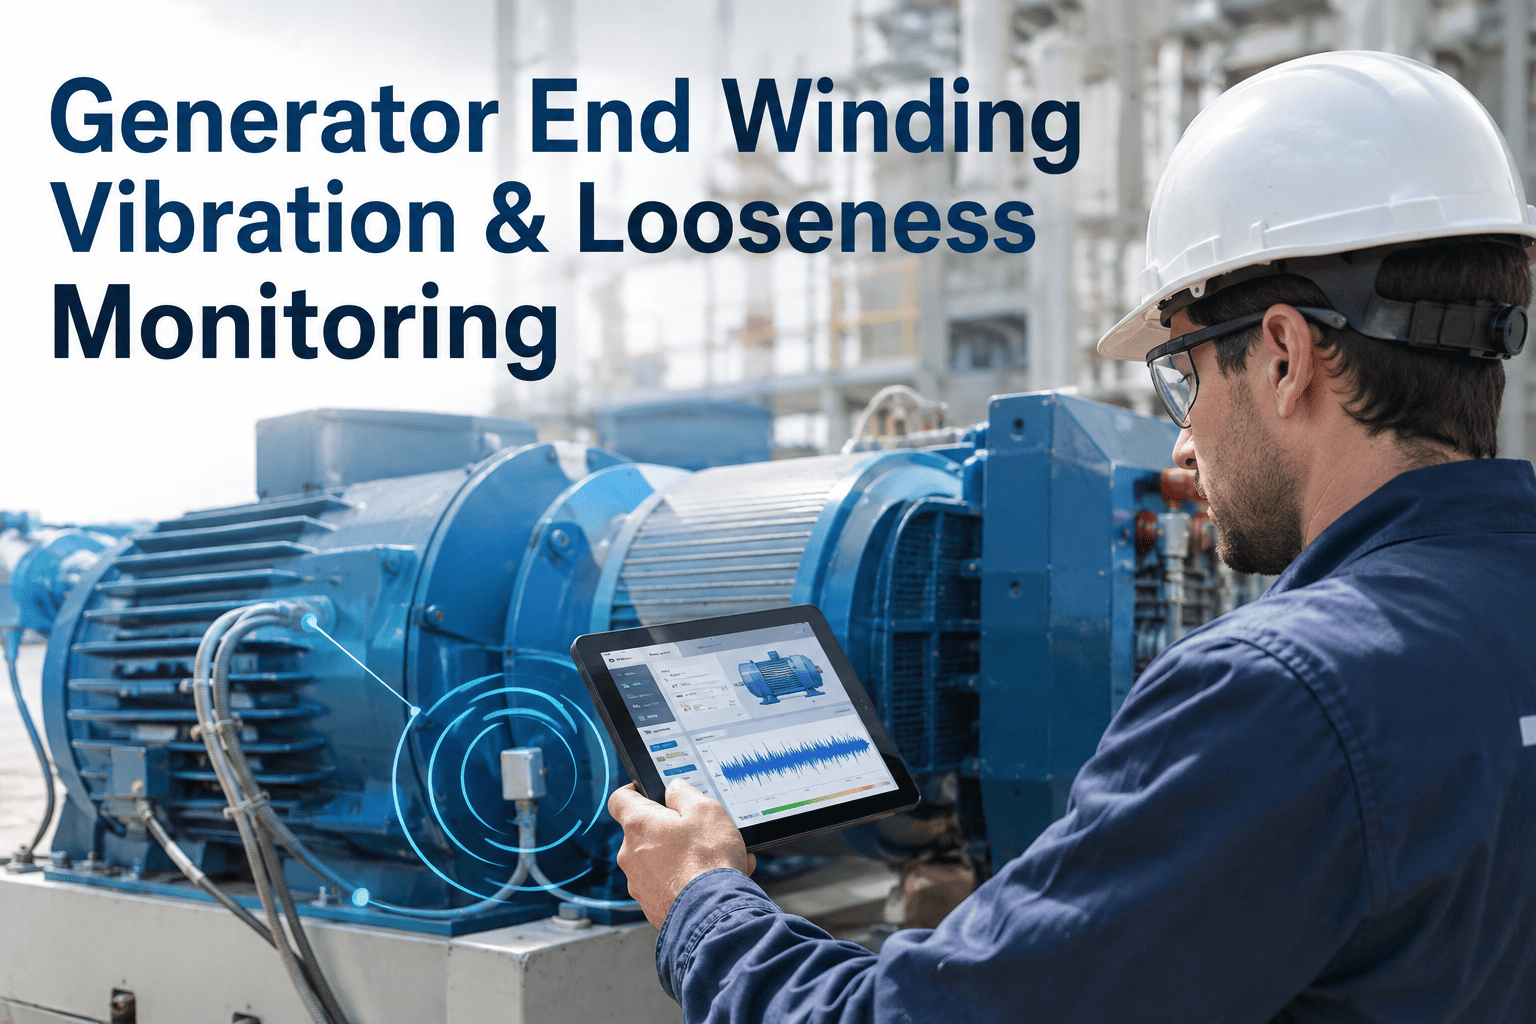
A generator stator end winding fails quietly, for years, before anyone notices. Thermal cycling and electromagnetic forces gradually loosen the support and tie structure holding each coil in place, and once that looseness sets in, coil-to-coil and coil-to-support rubbing begins abrading the high-voltage insulation with every duty cycle. By the time discharge activity or a bar crack shows up on an offline test, the winding has often been degrading undetected through dozens of load cycles. Continuous end winding vibration monitoring changes that timeline, catching the earliest signs of looseness while a repair is still a scheduled outage instead of a forced one. See how AI trending applies to your fleet — book a demo with our team.
Catch End Winding Looseness Before It Becomes a Forced Outage
Fiber optic accelerometers and AI trending track stator end winding vibration continuously, surfacing the earliest signs of looseness and resonance long before insulation cracking or coil fatigue puts your generator at risk.
How a Loose End Winding Becomes a Catastrophic Failure
The end winding — the portion of the stator bars that extends beyond the core and connects into the coil structure — is consolidated into a semi-rigid support basket to resist the mechanical forces generated every time current flows through the machine. Those forces peak at twice line frequency, which means a 60Hz generator experiences its dominant end winding excitation at 120Hz, twice every AC cycle. Over years of thermal expansion and mechanical aging, the ties and supports holding that basket together gradually loosen. Once looseness sets in, individual bars gain freedom to move, and if that movement frequency lands near a structural resonance, vibration amplitude escalates sharply rather than gradually — turning a slow degradation process into a fast one almost overnight. This nonlinear jump is what makes end winding vibration such a dangerous failure mode to manage with periodic inspection alone: a unit can appear stable at every scheduled test and still be approaching a resonance condition that develops between those test dates, invisible until the next scheduled check happens to catch it.
The Failure Chain: From First Looseness to Forced Outage
Insurance industry data spanning more than a decade has identified stator end-winding vibration as one of the most significant drivers of generator winding failures. The path from a minor support issue to a catastrophic event follows a predictable sequence — one that continuous monitoring is specifically designed to interrupt early.
Support Structure Loosens
Thermal cycling and mechanical aging gradually loosen the ties and supports holding the end winding basket together, allowing small relative movement between components that previously moved together as one structure.
Resonance Amplifies Movement
If the loosened structure's natural frequency drifts near the dominant 120Hz excitation, vibration amplitude rises sharply, converting a minor mechanical issue into significant relative motion between adjacent components.
Abrasion & Insulation Wear
Coil-to-coil and coil-to-support rubbing abrades the high-voltage insulation surrounding the copper conductors — the point at which continuous vibration trending typically first flags an actionable alarm.
Cracking, Discharge & Ground Fault
Left undetected, worn insulation leads to bar cracking just outside the stator slot, partial discharge activity, and eventually arcing or a stator winding ground fault — the failure mode responsible for the industry's most severe generator outages.
Trend Your Fleet's End Winding Condition in One Place
iFactory pulls fiber optic accelerometer data into continuous AI trending, correlating vibration against load and history so early looseness is flagged before it reaches the alarm stage.
Why Fiber Optic Sensors, Not Conventional Accelerometers
The environment inside a generator end winding is hostile to conventional instrumentation — high voltage, strong electromagnetic fields, and elevated temperature rule out standard metallic sensors and wiring. This is why end winding vibration monitoring has been built around fiber optic sensing since the technology was pioneered for this exact application in the early 1980s, and why it remains the accepted approach across the industry today.
Immune to Electromagnetic Interference
Fiber optic sensors carry no electrically conducting wire into the high-voltage zone, eliminating the arcing risk and signal noise that would compromise a conventional electrical sensor mounted directly on the end winding.
Simultaneous Radial & Tangential Measurement
Single-axis and dual-axis fiber optic accelerometer configurations measure vibration in both radial and tangential directions at once, capturing the full motion pattern rather than a single-plane approximation.
Full-Spectrum Frequency Coverage
Field studies have shown that narrowband monitoring systems can miss significant vibration components entirely — one plant installation detected substantial 60Hz vibration that had gone undetected for years until full-spectrum fiber optic sensing was deployed.
No Mounting Location Constraint
Because fiber optic sensors carry no electrical signal, they can be mounted directly on the end winding structure itself, positioned at the points most representative of actual basket motion rather than compromised by wiring routing limits.
Offline Testing vs Continuous AI Trending
| Capability | Periodic Offline Testing | Continuous AI Vibration Trending |
|---|---|---|
| Measurement frequency | Annual or per-outage only | Continuous, every operating hour |
| Load correlation | Single snapshot, one load point | Vibration trended across full load range |
| Resonance detection | Easily missed between test windows | Captured as it develops in real time |
| Pre/post-outage comparison | Manual, inconsistent record | Automatic before/after trend overlay |
| Early looseness warning | Often found only after damage | Flagged while still in early stage |
| Historical trend record | Sparse, disconnected reports | Continuous multi-year trend line |
What AI Trending Adds Beyond Raw Vibration Data
A vibration sensor alone produces a number. What operators actually need is the context to interpret that number correctly, and this is where AI-driven trending closes the gap that raw sensor data leaves open.
Load-Correlated Vibration Analysis
Low vibration levels that increase only modestly with load confirm satisfactory consolidation, while high vibration across many sensors signals global looseness in the end winding structure. Correlating vibration against operating load turns a raw amplitude reading into an actual diagnosis.
Trend-Over-Threshold Detection
Spiking vibration that stays below alarm levels but increases steadily over time is often the earliest reliable signal of a worsening condition — one that a single-point alarm threshold would miss entirely but continuous trending catches immediately.
Before & After Outage Comparison
Overlaying vibration trends from before and after a planned outage confirms whether a repair actually resolved the underlying issue, or provides early warning that a suspected problem is beginning to reappear during the next operating cycle.
Multi-Point Basket Consolidation View
With multiple sensors distributed around the end-turn basket — commonly split between exciter-end and turbine-end — AI trending distinguishes a localized issue at one support point from true global looseness across the entire winding structure.
The Financial Case for Continuous Trending
The economics behind end winding monitoring follow directly from how forced outages actually get costed once an incident occurs. Generator problems account for roughly 12% of forced outages in thermal power plants, and a single forced outage routinely costs $500,000 or more once lost generation, emergency repair, and replacement power purchases are factored in — with severe multi-week outages at larger units running into the millions. A full stator rewind following an undetected end winding failure can take three and a half to four weeks once materials are on hand, extending well beyond that if the rotor requires additional disassembly.
Planned rewinds and end winding retensioning are dramatically less expensive than the extended forced outage that follows an undetected failure — the whole economic case for continuous monitoring rests on catching looseness early enough to schedule the fix during a planned window instead of an emergency one.
Reading the Signal: What Different Vibration Patterns Actually Mean
Not every vibration reading points to the same conclusion, and interpreting the pattern correctly is what separates a useful monitoring program from a stream of numbers nobody acts on. These are the signatures maintenance and reliability teams look for once continuous fiber optic data is available.
Low, Load-Stable Vibration
Vibration that stays low and increases only modestly as load rises indicates the end winding basket remains well consolidated. This is the baseline pattern a healthy generator should hold consistently across its operating range.
Sub-Alarm Spikes That Climb Over Time
Individual spikes that stay technically below alarm thresholds but trend upward across weeks or months are frequently the earliest reliable indicator of a worsening condition — the exact pattern a single annual test would never catch.
High Readings Across Many Sensors
When multiple sensors distributed around the basket all register elevated vibration simultaneously, that pattern typically signals global looseness across the entire end winding structure rather than a single localized issue.
Sharp Post-Outage Shift
A meaningful difference between pre-outage and post-outage vibration trends confirms whether a completed repair actually resolved the underlying issue, or provides an early warning sign that the problem is beginning to return.
Which Generator Fleets Benefit Most
End winding vibration risk exists on any large rotating generator, but the urgency and payback of continuous monitoring shift depending on the fleet's age, criticality, and duty cycle. These are the profiles where the case is strongest.
Aging Fleet Approaching 25-30 Years
As steam plant generators approach their design-life milestone, the risk of forced outage scenarios increases meaningfully. Continuous end winding trending gives asset owners the early data needed to plan a rewind proactively rather than reacting to an unplanned failure late in a unit's life.
Cycling & Load-Following Units
Generators that cycle frequently rather than running steady baseload experience more thermal expansion and contraction cycles on the end winding support structure, accelerating the mechanical aging that leads to looseness — exactly the pattern continuous load-correlated trending is built to catch.
Critical Single-Unit & Peaking Assets
Where a forced outage on one unit removes a disproportionate share of available capacity, the cost asymmetry between scheduled maintenance and an emergency teardown is largest — making the return on continuous monitoring fastest to materialize.
Post-Rewind & Post-Repair Units
A generator recently returned from a stator rewind or end winding retensioning benefits from close before-and-after trend comparison, confirming the repair holds under real operating load rather than waiting for the next scheduled outage to find out.
Frequently Asked Questions
Why can't standard accelerometers be used inside the generator end winding?
The end winding operates in an environment of high voltage and strong electromagnetic fields that make conventional electrically conductive sensors and wiring hazardous — any conducting path into that zone risks arcing. Fiber optic vibration sensing was specifically pioneered for this application because it carries no electrical signal into the high-voltage area, allowing safe direct mounting on the end winding structure itself. This is also why fiber optic accelerometers have become the accepted standard across both air-cooled and hydrogen-cooled generator designs. Book a demo to see fiber optic sensor integration explained for your unit type.
How early can vibration trending actually catch a looseness problem?
Continuous trending is built to catch the pattern before it crosses an alarm threshold, not just the moment it does. A spiking vibration level that stays technically within limits but climbs steadily over months is exactly the signature that indicates a worsening condition, and that pattern is invisible to a single annual offline test but immediately visible on a continuous trend line. Catching the issue at this stage typically means a scheduled tightening or repair rather than an unplanned teardown. Contact support to discuss trend threshold configuration for your fleet.
How many sensors are typically needed to monitor a single generator's end windings?
Coverage is typically distributed around the end-turn basket at both the exciter-end and turbine-end, since precise symmetrical spacing is not required and convenient positioning around the basket is normally sufficient to catch meaningful vibration modes. Using multiple sensors also protects against any single sensor sitting at a vibration node — an effectively stationary point in a particular mode — where it would otherwise miss the very motion it's meant to detect. Book a demo to review a sensor layout for your generator's frame size.
Does end winding vibration matter for hydro generators, or only steam turbine-generators?
End winding vibration monitoring applies across generator types, though the dominant excitation frequencies and failure patterns differ somewhat by machine design and cooling method. Air-cooled and hydrogen-cooled turbine-generators, as well as large hydro generators, all rely on end-turn support structures that experience the same fundamental risk: mechanical aging loosening the basket and allowing damaging relative motion between components. Continuous fiber optic monitoring is deployed across all of these machine types for exactly this reason. Contact support to confirm monitoring fit for your specific generator class.
What does the AI actually add on top of the raw vibration signal from the sensors?
Raw vibration amplitude by itself is ambiguous — the same reading can mean satisfactory consolidation or early global looseness depending on how it behaves across load and time. AI trending correlates each vibration reading against operating load, compares it to the unit's own historical baseline, tracks whether it's rising steadily even while still under alarm thresholds, and overlays before-and-after outage comparisons to confirm whether a repair actually worked. This turns a stream of sensor numbers into an interpreted condition assessment your team can act on. Book a demo to see the trending dashboard applied to sample fleet data.
Give Your Generator Fleet a Continuous Condition Record
Stop discovering end winding looseness during an outage inspection. Let iFactory turn your fiber optic vibration data into continuous, load-correlated trending that flags problems while they're still a scheduled fix.