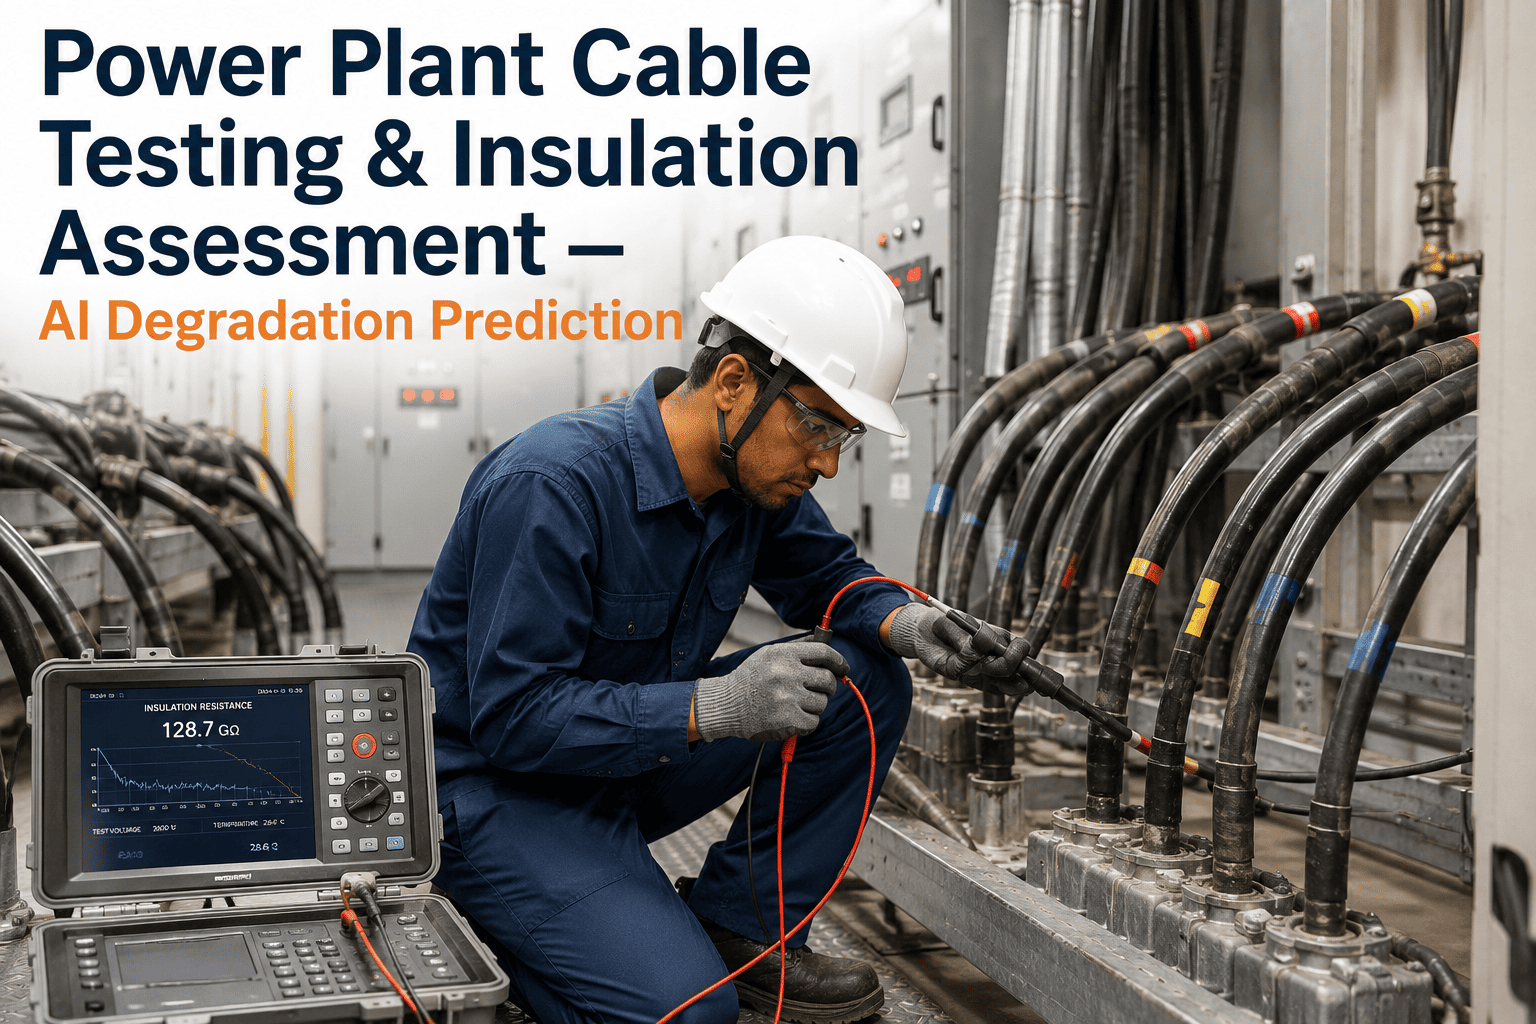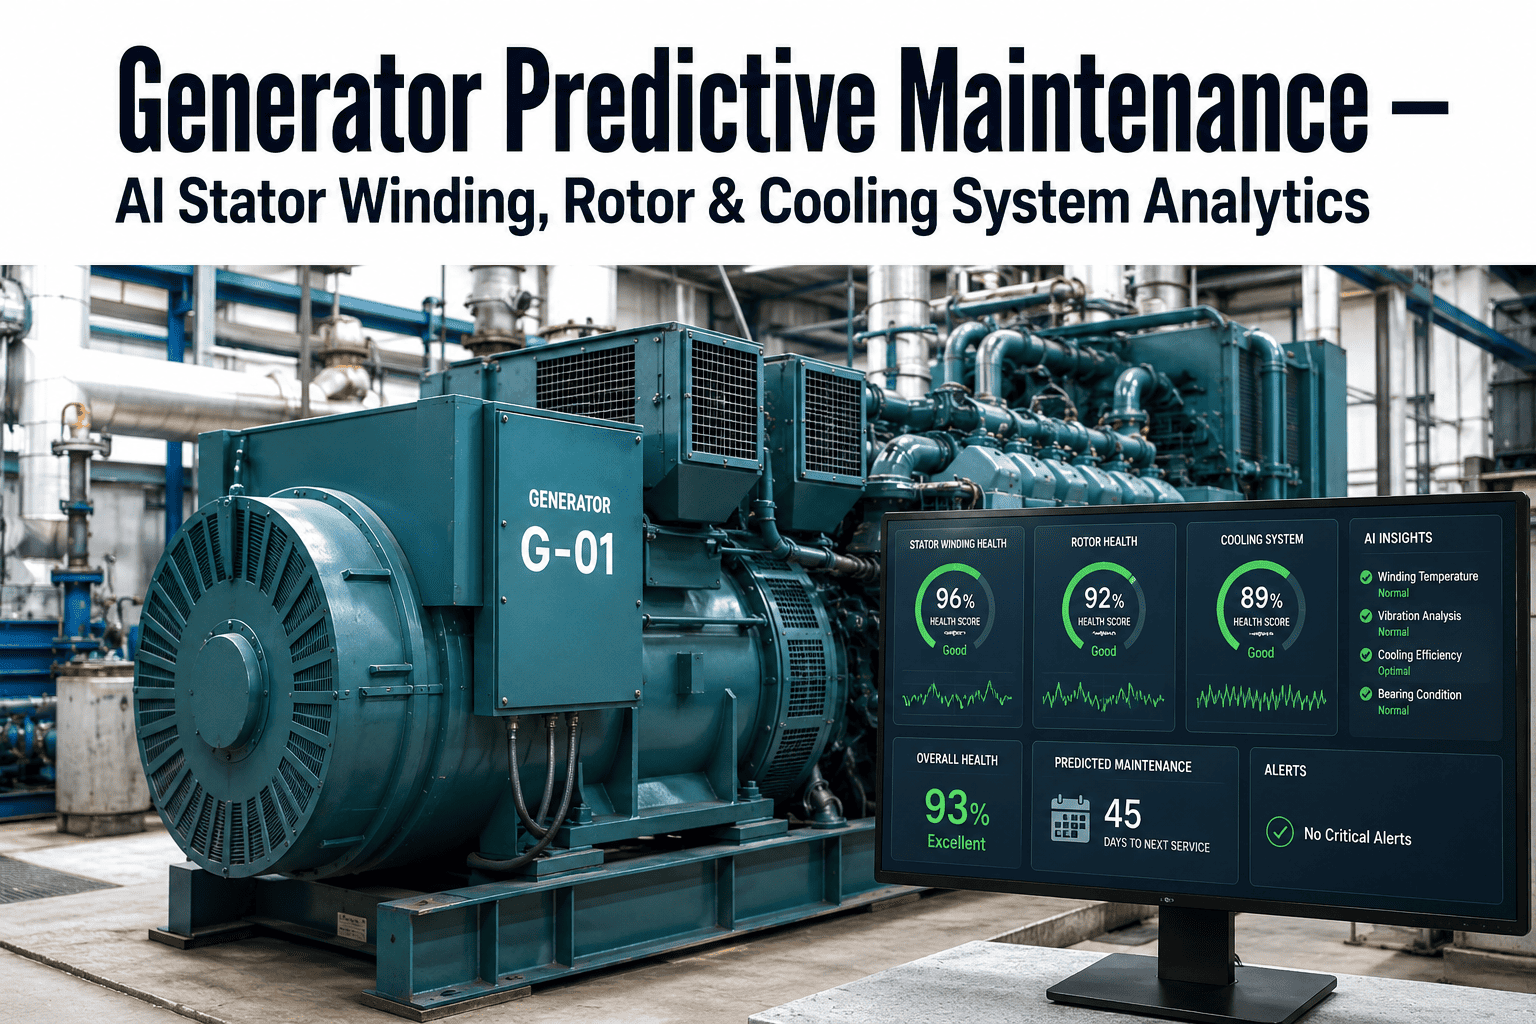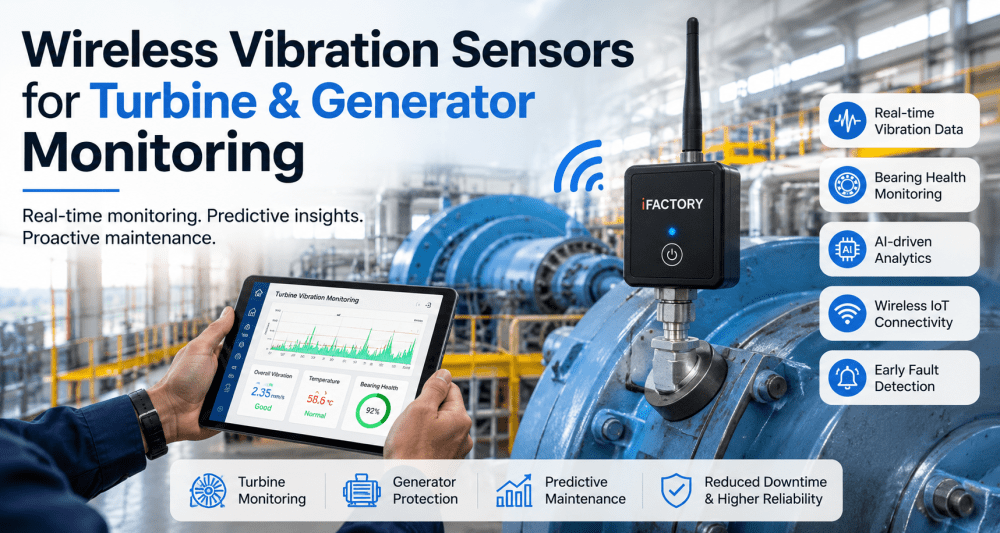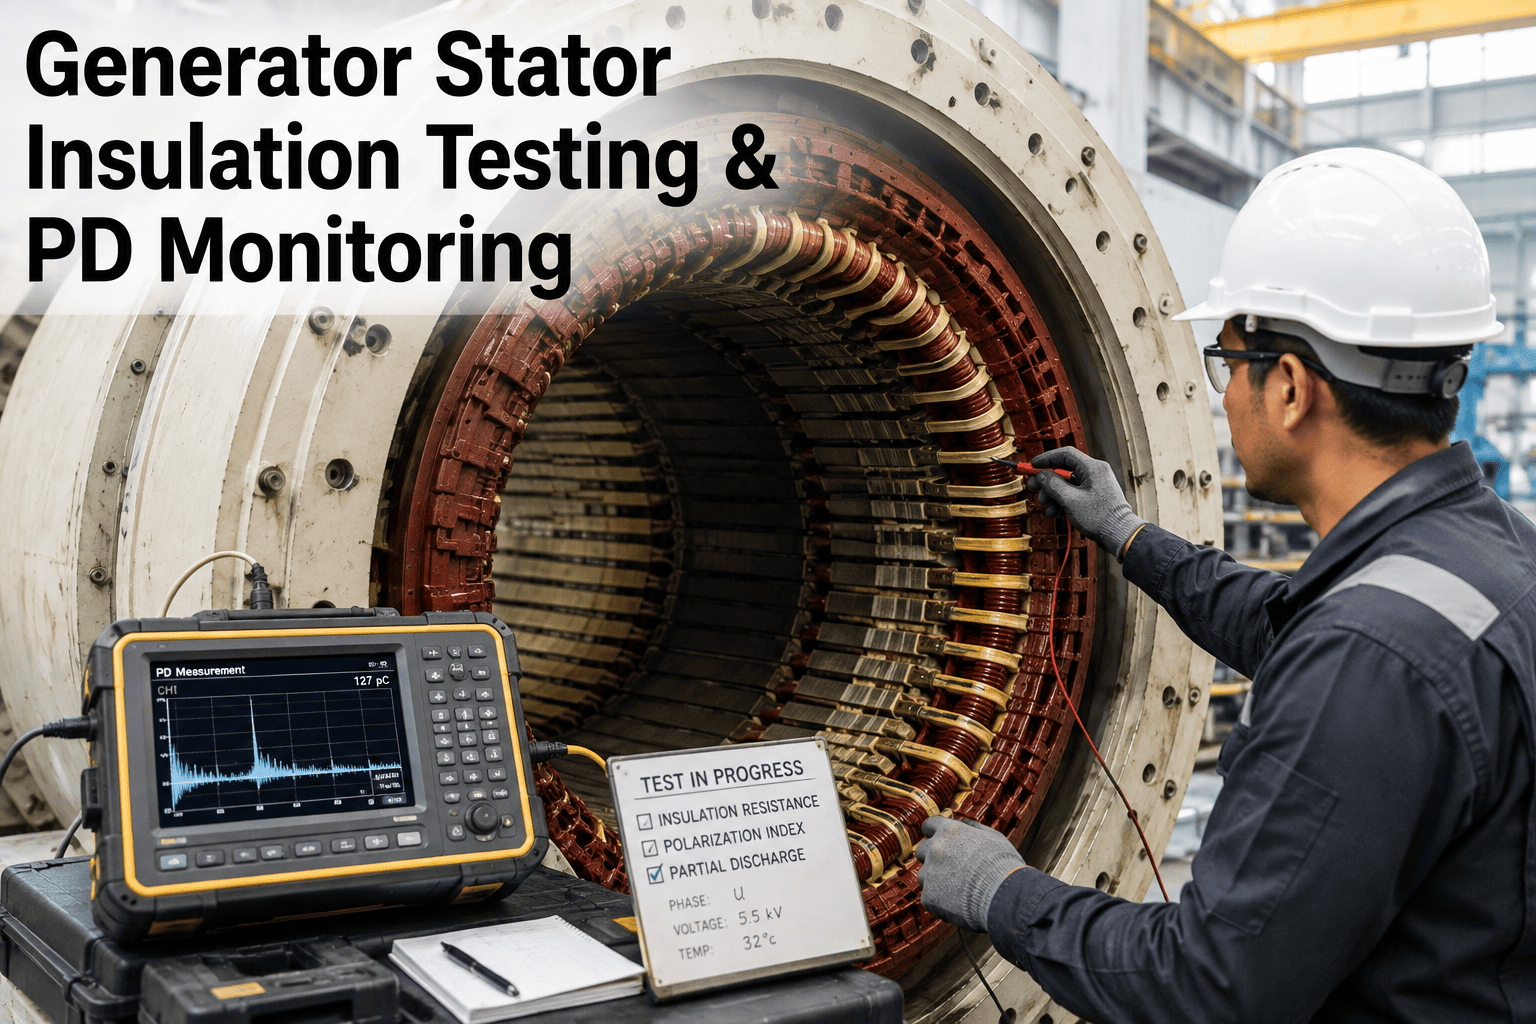
Generator stator windings carry tens of thousands of volts through insulation that is expected to survive decades of thermal cycling, electrical stress, and mechanical vibration without a single breakdown. When that insulation degrades unnoticed, the failure mode is rarely a slow, forgiving decline — it is a ground fault, a phase-to-phase short, or a winding burn that can take a unit offline for weeks and cost far more than any inspection program ever would. Most plants still lean on infrequent offline megger tests taken during scheduled outages, which means the insulation sits essentially unwatched for the eleven months in between. Continuous online partial discharge monitoring, paired with disciplined offline testing, closes that gap and turns a single annual data point into a real trend line maintenance teams can act on. You can book a demo to see how iFactory brings insulation data, PD trends, and work orders into one connected view.
Catch Stator Insulation Degradation Long Before It Becomes a Forced Outage
iFactory pulls insulation resistance, polarization index, and partial discharge readings into one connected trend line, so a slow winding decline shows up as a pattern instead of a surprise trip.
Why an Undetected Insulation Fault Is the Most Expensive Failure on the Unit
A stator rewind or partial rewind is one of the longest and costliest repairs a generator can face, and the outage that follows an unplanned ground fault rarely stays contained to the winding itself. Rotor removal, core inspection, wedge replacement, and a full dielectric re-test all stack on top of the rewind labor, and the unit sits offline the entire time generating no revenue. The frustrating part is that insulation almost never fails without warning; it degrades gradually through thermal aging, partial discharge activity, and mechanical loosening long before it actually breaks down, but that gradual decline only shows up if someone is trending the data closely enough to see it.
Offline insulation resistance and polarization index tests are usually run once a year or once per major outage cycle, which means a fault that develops between tests can progress from early-stage to critical without anyone seeing it coming.
IR, PI, and PD values from different test vendors and different outages often end up in separate PDF reports with no shared timeline, so a technician comparing this year's number to last year's has to dig through file folders to find the baseline.
A polarization index of 2.1 looks fine in isolation, but if it was 3.4 two years ago and 2.7 last year, that is a meaningful downward trend that a one-time snapshot will never reveal on its own.
Online PD systems flag a discharge magnitude increase, but without slot number, phase, and load-correlated history attached, the alert becomes another item in an inbox rather than a prioritized, actionable finding.
Two Different Windows Into the Same Winding, and Why You Need Both
Offline testing and online monitoring answer different questions, and treating one as a replacement for the other leaves a real gap in coverage. Offline tests apply a controlled voltage to a de-energized winding and measure how the insulation responds, which gives a clean, repeatable baseline free of operational noise. Online monitoring watches the winding while it is running under real load, temperature, and voltage stress, catching activity that only appears once the machine is actually in service. The comparison below lays out where each approach earns its place in a stator insulation program.
| Approach | What It Actually Tells You | Where It Falls Short |
|---|---|---|
| Offline IR / PI / DAR | Bulk insulation condition, moisture contamination, and gross winding-to-ground degradation under controlled DC voltage | Only available during a shutdown, and provides one data point per outage cycle rather than a continuous trend |
| Offline Hipot / Surge Comparison | Turn-to-turn insulation integrity and dielectric withstand margin above normal operating voltage | Applies elevated voltage that some plant managers are cautious about running on older or already-weakened windings |
| Online Partial Discharge | Real-time discharge activity by phase and slot location while the machine runs under actual thermal and mechanical load | Sensitive to electrical noise from the switchyard and adjacent equipment, so raw readings need careful filtering to trust |
| Manual Megger Spot-Checks | A rough go/no-go reading a technician can pull with portable equipment between formal test cycles | Inconsistent technique and equipment across readings makes trend comparison unreliable |
How Insulation Actually Breaks Down, Stage by Stage
Stator insulation rarely fails in a single event. It moves through a fairly predictable progression, and each stage leaves a slightly different signature in the test data if someone is watching for it. Understanding where a winding sits on this path is what turns a raw number into an actual maintenance decision.
The Five Tests Every Stator Insulation Program Should Be Running
No single test tells the whole story on its own. A well-run program layers several methods together, each catching a different type of degradation, and trends every one of them over time rather than treating a single pass/fail result as the final word.
| Test | What It Measures | Typical Frequency | Warning Sign |
|---|---|---|---|
| Insulation Resistance (IR) | Overall leakage current path from winding to ground under applied DC voltage | Every outage, plus pre- and post-cleaning checks | Sustained downward trend across successive outages, not just a single low reading |
| Polarization Index (PI) | Ratio of the 10-minute to 1-minute IR reading, reflecting insulation dryness and bulk condition | Every outage, alongside the IR test | Ratio trending down toward 1.5 or lower for the winding class in question |
| Dielectric Absorption Ratio (DAR) | Short-interval absorption behavior, useful as a faster proxy when a full PI test isn't practical | Supplemental to IR / PI, or when time on a de-energized unit is limited | Ratio dropping alongside a falling PI, confirming a genuine bulk insulation issue |
| Hipot / Step-Voltage Withstand | Whether the ground wall insulation can withstand voltage above normal operating level without breaking down | Major outages, new windings, and post-repair verification | Leakage current jump or breakdown at a step below the expected withstand voltage |
| Online Partial Discharge | Discharge pulse magnitude and count by phase and slot location while the machine runs under load | Continuous, with periodic trend review | Steady rise in discharge magnitude concentrated on one phase or slot group over successive weeks |
What Good, Marginal, and Poor Actually Mean on a Stator Report
A raw IR or PI number means very little without the right context, and different insulation classes and machine ages carry different acceptable ranges. The bands below reflect the general interpretation guidance used across most stator insulation programs, though the specific acceptance criteria for your unit should always follow the manufacturer's documentation and IEEE 43 guidance.
Four Common Sources of Partial Discharge in a Stator Winding
Partial discharge is a symptom, not a single failure mechanism, and knowing which type of discharge you're seeing changes what the repair crew should actually be looking for once the unit is opened up.
Occurs when the semiconductive coating that grades voltage stress in the slot degrades or loses contact with the core, allowing discharge activity between the bar surface and the grounded stator core.
Shows up at the coil ends where phase-to-phase spacing is tighter and surface contamination or moisture ingress can create a path for discharge across the insulation surface.
Micro-voids form between insulation layers from thermal cycling or manufacturing defects, creating small internal air gaps where discharge activity originates and slowly widens the gap.
Dust, oil, or moisture buildup on the winding surface creates a conductive film that allows small discharges to track across the insulation surface over time.
Common Mistakes That Let a Winding Fault Slip Through
Comparing this year's IR reading only to the acceptance table, instead of to last year's number on the same winding, misses the slow declining trend that actually matters most.
IR readings are highly sensitive to winding temperature, and comparing an uncorrected reading taken at 30°C to one taken at 45°C makes a stable winding look like it's degrading.
Assuming every PD spike is switchyard noise without checking the pulse pattern and phase correlation risks waving off a real developing fault as a nuisance alarm.
When offline test vendors change between outages and PD monitoring runs on a separate system entirely, nobody ends up with one continuous view of the winding's actual condition.
Catching a Slow PI Decline Before It Became a Rewind
A 220 MW steam turbine generator had passed every offline insulation test for six straight outages, each report filed separately and never compared side by side. Nobody noticed that PI had quietly slipped from 3.1 to 2.6 to 2.0 over three consecutive years, since each individual value still cleared the acceptance threshold on its own.
Once IR and PI history were trended together on one timeline, the three-year decline became obvious immediately, and it lined up with a rising PD magnitude on one phase picked up by the online monitoring system. A targeted borescope inspection during the next planned outage found early-stage delamination in the affected slot group, and a localized repair was scoped and completed in days instead of the unit needing an unplanned full rewind months later.
Building a Stator Insulation Program That Actually Catches Problems Early
Establish a documented IR, PI, and DAR baseline for every generator winding immediately after commissioning or a repair, and store it where every future test gets compared against it.
Standardize offline test voltage, duration, and temperature correction across vendors so results stay comparable from one outage to the next.
Connect online PD readings to the same asset record as offline test history, so a technician sees the full trend rather than two disconnected data sources.
Set trend-based alert thresholds, not just single-reading pass/fail limits, so a slow multi-year decline gets flagged before it crosses into critical territory.