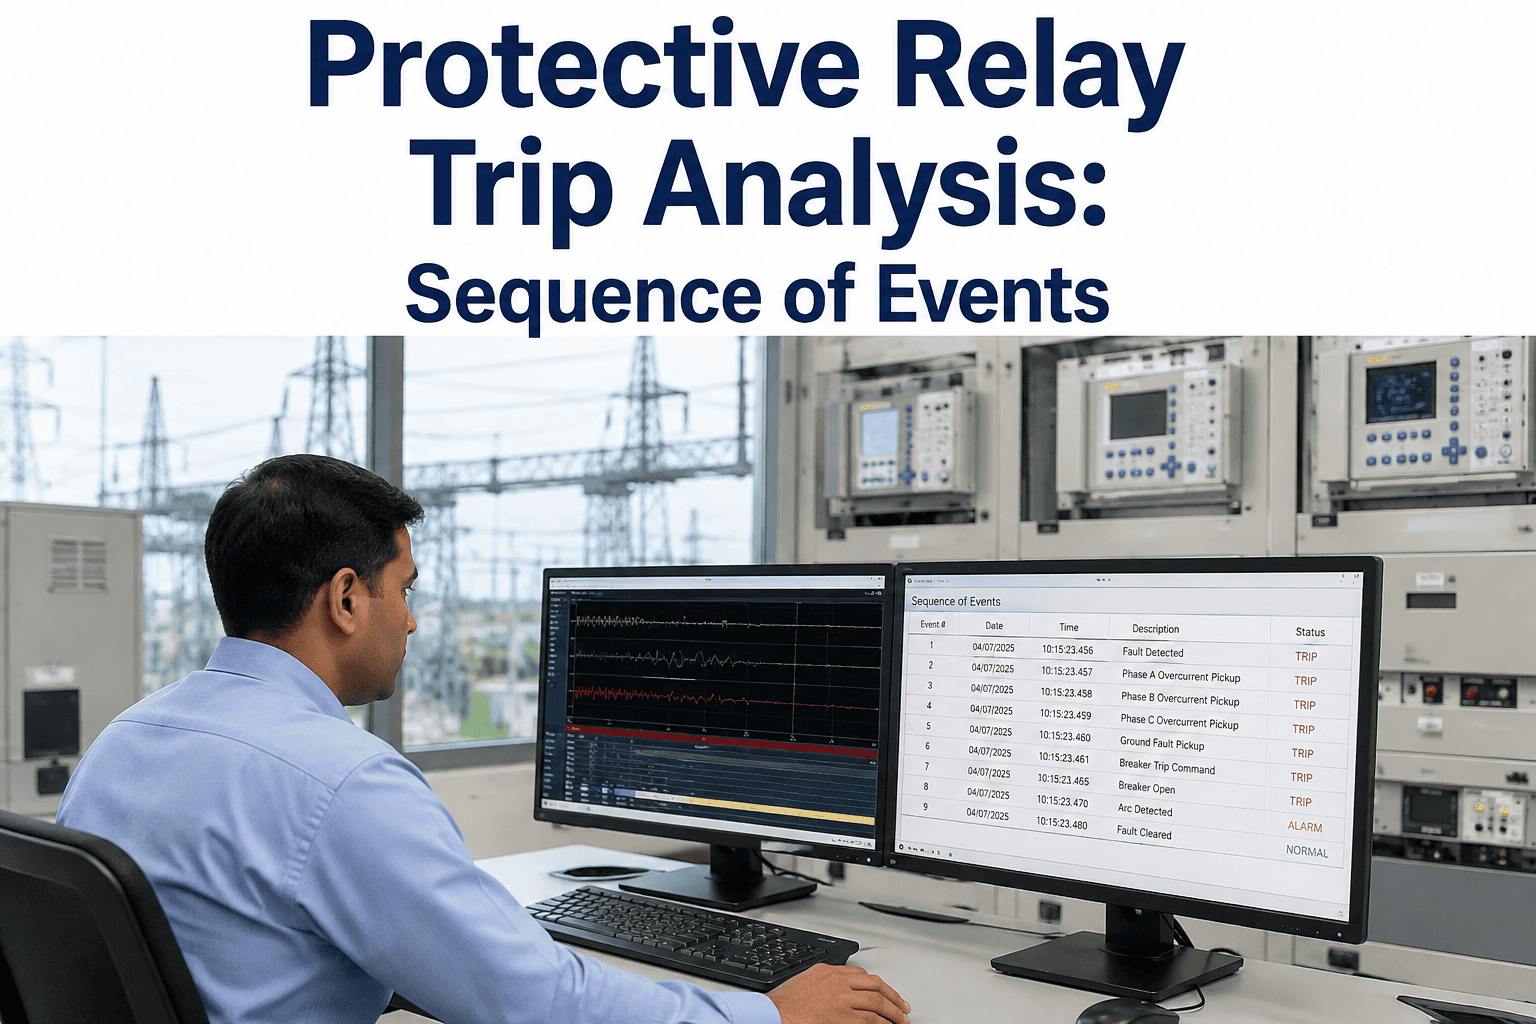
A peaking unit may sit idle for days and then get a dispatch call with little warning. If it fails to start, the plant loses the run, may face penalties and has to explain why. Failed starts are rarely random. They tend to repeat at the same step of the start sequence, from igniters to fuel valves. Peaker plant start reliability analysis records every attempt step by step, groups failures by cause and turns repeat issues into maintenance work. See it on your own start data in a start review.
Peaker Plant Start Reliability: Fixing Failed Starts with AI
Start sequence data saved for every attempt. Failed steps classified by cause. Repeat issues turned into PM tasks, and start success rate tracked by unit, so the team fixes what keeps failing.
- Every start attempt, step by step
- Failures grouped by cause
- Repeat issues become PM tasks
Why Failed Starts Matter on a Peaker
A peaker is paid to be there when called.
A baseload unit starts a few times a year. A peaking unit may start many times a week, often from cold, and is expected to reach load in a set time. Long idle spells between runs give small faults time to build where nobody sees them. Each start is a test of the starting system, ignition, fuel supply and controls. When a start fails, the operator usually resets and tries again, and the event is noted in a shift log. Weeks later, nobody can say whether the last four failures had one cause or four. The same weak part fails again on the next cold morning. Our peaker specialists can review how your failed starts are recorded today.
Failed starts in shift logs
- "Failed to start, reset, OK" with no cause
- Retries not counted as attempts
- Same part failing again weeks later
- No view of start success by unit
Start analytics
- Every attempt saved with step data
- Failed step and cause recorded
- Repeat causes linked across starts
- Success rate tracked by unit and month
How Starting Reliability Is Measured
Successful starts divided by attempted starts.
In North America, NERC's Generating Availability Data System (GADS) defines starting reliability as actual unit starts divided by attempted unit starts, times 100 percent. GADS bases its equations on IEEE Standard 762. The gap between attempted and actual starts is the count of startup failure events. The measure is only as good as the counting. If a retry after a failed start is not logged as a new attempt, the failure disappears from the number. The worked example below is illustrative. Check how your plant counts attempts in a short session.
Decide in writing what counts as an attempted start, for example every start command issued from the control room. Apply the rule on every unit and every shift. Consistent counting matters more than the exact wording of the rule.
Illustrative figures. Follow the current GADS Data Reporting Instructions for formal reporting.
Where in the Start Sequence Starts Fail
Knowing the failed step narrows the cause fast.
A gas turbine start runs through a fixed sequence set by the OEM and the control system. The details differ by unit, but most follow a similar path: start permissives, cranking and purge, ignition, fuel admission and acceleration, then synchronizing to the grid. Each step has its own common causes of failure. Recording the step where a start stopped is the single most useful piece of data for finding the cause. Talk through your sequence with our controls team.
General examples. Your OEM manuals and control logic set the real steps and limits.
Start Sequence Data for Every Attempt
Save the start while it happens, not from memory afterwards.
Most of the data needed to explain a failed start already exists in the control system and historian. The problem is that nobody pulls it together per attempt. Start analytics saves a record for every start command: the time of each step, the key signals during that step and where the sequence stopped. Operators add a short note by voice if they saw something the signals did not. Over a season, these records become the evidence for each cause. Records are kept per unit, so a pattern on one machine is not hidden by good results on another. Map your signals in a working session.
Step times
When each step began and ended against its limit.
Igniter and flame
Igniter current and flame detector signals.
Fuel valves
Valve command, position and fuel pressure.
Cranking
Speed, starting motor current and purge time.
Conditions
Ambient, hours since last run, fuel type.
Operator note
What was seen or heard, given by voice.
See Why Your Peakers Fail to Start
Start Analytics saves every attempt, classifies each failed step by cause and tracks start success by unit, so your team knows which fix will help most.
Grouping Failed Starts by Cause
A rate by unit says where. A cause count says what to fix.
Once each failed start has a step and a cause, patterns appear that a single success rate hides. The AI compares the signals from each failed attempt with past failures and suggests a likely cause. A technician confirms or changes it after checking the equipment. The illustrative quarter below matches the totals in the box above: six failed starts across three units, with igniters behind half of them. The unit with the lowest rate has two separate causes, so one fix will not be enough. Across the fleet, igniter work would address more failures than any other single change. Review your own failure history with our reliability team.
Illustrative figures, rounded to one decimal place.
Turning Repeat Issues into PM Tasks
A cause that repeats needs a task, not another reset.
When the same cause shows up more than once, the agent proposes a preventive task: what to check, how often and on which units. A maintenance planner reviews the proposal and decides whether it goes into the PM program. Tasks are timed around dispatch, so checks happen in standby windows rather than when the unit is needed. After the task is in place, the agent watches whether that cause stops recurring. If it keeps returning, the task itself is reviewed rather than simply repeated. Plan your first tasks in a short session.
Tracking Start Success by Unit
One number per unit, with the causes behind it.
Starting reliability is tracked by unit and by month, next to the causes that pulled it down. Plant managers see which units need attention before the peak season. Dispatch and trading teams get an honest view of which units are most likely to answer the first call. Trends over several seasons show whether PM changes are working, and a unit whose rate falls after a repair is flagged so the work can be checked. Ask our team how the reports are set up for your plant.
Record
Every start attempt saved.
Classify
Failed step and cause suggested.
Confirm
Technician checks the cause.
Prevent
Repeat causes become PM tasks.
Track
Success rate by unit and month.
Peaker Start Reliability Checklist
Eight checks before the next peak season.
Use this checklist for one peaking site first. Tick items already in place. Get help with any gaps from our setup team.
Start Reliability Mistakes to Avoid
A good start rate built on poor counting helps nobody.
These are common patterns that keep failed starts coming back. A short start data review can find them.
What works
- Every attempt counted, retries included
- Failed step recorded for each failure
- Causes confirmed by a technician
- Repeat causes turned into PM tasks
What fails
- Resetting and retrying without a record
- "Failed to start" as the only cause
- Fixing the symptom on each event
- One fleet-wide rate that hides weak units
How iFactory Runs Peaker Start Reliability Analytics
Start Analytics and an AI agent, on your own network.
iFactory's Start Analytics saves start sequence data per attempt, classifies failed steps by cause, turns repeat issues into PM tasks and tracks start success rate by unit. It runs on an on-prem AI server inside your plant.
Every attempt
Step times and signals saved.
Cause classification
Failed step and likely cause.
Repeat links
Same cause across starts and units.
PM tasks
Proposed for planner review.
Success rate
By unit and by month.
Voice notes
Operator observations per start.
Cause confirmation, PM changes and dispatch decisions remain with your team. Figures on this page are worked examples.
Turnkey AI: Delivered, Connected and Live in 6–12 Weeks
You do not build this. It arrives ready.
iFactory ships as a pre-configured NVIDIA AI server with the software pre-loaded, racked and ready. Rack it, plug in power and Ethernet, and the AI is live on your network. Our team handles cabling, network setup, PLC, SCADA, DCS and CMMS integration, historian and start sequence signal mapping, operator training and 24×7 remote monitoring. Data stays on your network. For a scope matched to your plant, request a turnkey quote.
Ship, network and data
Server installed. Control system, historian and CMMS connected. Start steps mapped for each unit type.
Model training and pilot
Past starts loaded, cause list agreed and classification tested on one site.
Go-live and training
Start analytics live. Operators and planners trained. 24×7 monitoring begins.
Frequently Asked Questions
What is starting reliability?
In NERC GADS, it is actual unit starts divided by attempted unit starts, times 100 percent.
What counts as a failed start?
Any attempted start that does not become an actual start. In GADS, attempted minus actual starts gives the count of startup failures.
What are common causes of failed starts?
Igniters, flame detection, fuel valves, the starting system, permissives and controls. Your own history shows which matter most.
Does the AI decide the cause?
No. It suggests a likely cause from the signals and past failures. A technician confirms or changes it.
What data does it need?
Start commands, step times and key signals from the control system or historian, plus work orders from your CMMS.
Can it use past starts?
Yes, where the historian holds the data. Loading past starts gives the analysis a head start.
How are PM tasks added?
The agent proposes a task for a repeat cause. A planner reviews it and decides whether it enters the PM program.
Does this replace GADS reporting?
No. It helps you count attempts and causes clearly. Formal reporting still follows the GADS instructions.
How do we start?
Start with one peaking site and its recent start history. A 6-week pilot connects signals, maps steps and classifies failures. To plan it, contact our team.
Fix the Failed Starts That Keep Coming Back
In thirty minutes we review your recent start history, show where failed starts cluster and point to the causes worth fixing first. You keep the findings either way.
- 1A list of recent start attempts
- 2Shift log notes on failed starts
- 3Your start sequence description
- 4Work orders raised after failures
- 5One unit that fails more than the rest