In many power plant control rooms the alarm list scrolls faster than anyone can read it. Operators acknowledge in batches, learn which alarms always clear by themselves, and trust their own scan of the screens over the horn. That is a rational response to a system that asks for attention hundreds of times an hour and needs it a handful of times. ISA 18.2 gives a tested way out: define what an alarm is, measure the system against known benchmarks, and rationalize every alarm against one question — what must the operator do? This guide applies it to a thermal unit, step by step. To see how your own alarm log compares, book an alarm assessment.
Alarm Management to ISA 18.2: Fewer Alarms, Each One Worth Acting On
iFactory reads the DCS alarm and event log, measures it against the ISA 18.2 benchmarks every shift, ranks the alarms causing the noise, and puts cause, consequence and response beside each alarm that remains. Changes to alarm settings stay with your engineers, under management of change.
- Alarm KPIs against ISA 18.2, every shift
- Bad actors ranked, with the likely fix
- Response guidance beside every alarm
Why Operators Ignore Alarms — and Why They Are Right To
ISA 18.2 defines an alarm narrowly: an audible or visible signal of an abnormal condition that requires a timely response from the operator. By that test most entries on a typical alarm list are not alarms. They are status changes, events that follow from something already known, and signals bouncing around a setpoint. When they share one list and one horn with the few that matter, the operator has no means of telling them apart in the time available. The classic warning is the 1994 Milford Haven refinery explosion, where operators faced 275 alarms in the final 11 minutes. If your control room has learned to live with the noise, our controls engineers can review a week of your alarm log.
Chattering alarms
A signal hovering at its setpoint, in and out of alarm many times a minute. A few of these can produce most of a day's count.
Stale alarms
Alarms that have stood for days: equipment out of service, a faulty transmitter, a limit nobody believes. They hide whatever arrives next to them.
Consequential alarms
One event, twenty alarms. A fan trips and every flow, pressure and current downstream reports what the operator already knows.
Events dressed as alarms
"Pump started", "valve closed", "sequence complete". Useful in a log. On the alarm list they ask for attention and need none.
Everything is high priority
When a third of alarms carry the top priority, priority stops carrying information. The operator falls back on experience.
No stated response
The message says what happened, not what to do. A new operator at three in the morning has to work it out alone.
The ISA 18.2 Benchmarks, Against an Illustrative Unit
The standard's performance measures are simple to calculate from a DCS alarm log, and they turn a general complaint into a set of numbers. The illustrative unit here is a 500 MW coal unit with one operator desk and 3,600 alarms a day — 1,200 in an eight-hour shift. None of its figures is unusual for a system that has never been rationalized. To calculate these from a month of your own log, book a benchmark session.
More than 10 alarms in 10 minutes
Standing more than 24 hours
Low, medium, high
Benchmark One Unit's Alarm System in Six Weeks
Choose one unit. We connect its alarm and event log, calculate the ISA 18.2 measures for the last three months, rank the bad actors with a likely fix for each, and show the shift what changes week by week.
The ISA 18.2 Lifecycle in Plain Terms
ANSI/ISA-18.2-2016, Management of Alarm Systems for the Process Industries, is organised as a lifecycle of ten stages. It is not a one-time clean-up: a system that is rationalized and then left alone drifts back within a few years as modifications add alarms. Its international counterpart is IEC 62682, and the older EEMUA 191 guide covers the same ground. Our alarm specialists can map your current practice to each stage.
Where a 70% Reduction Comes From
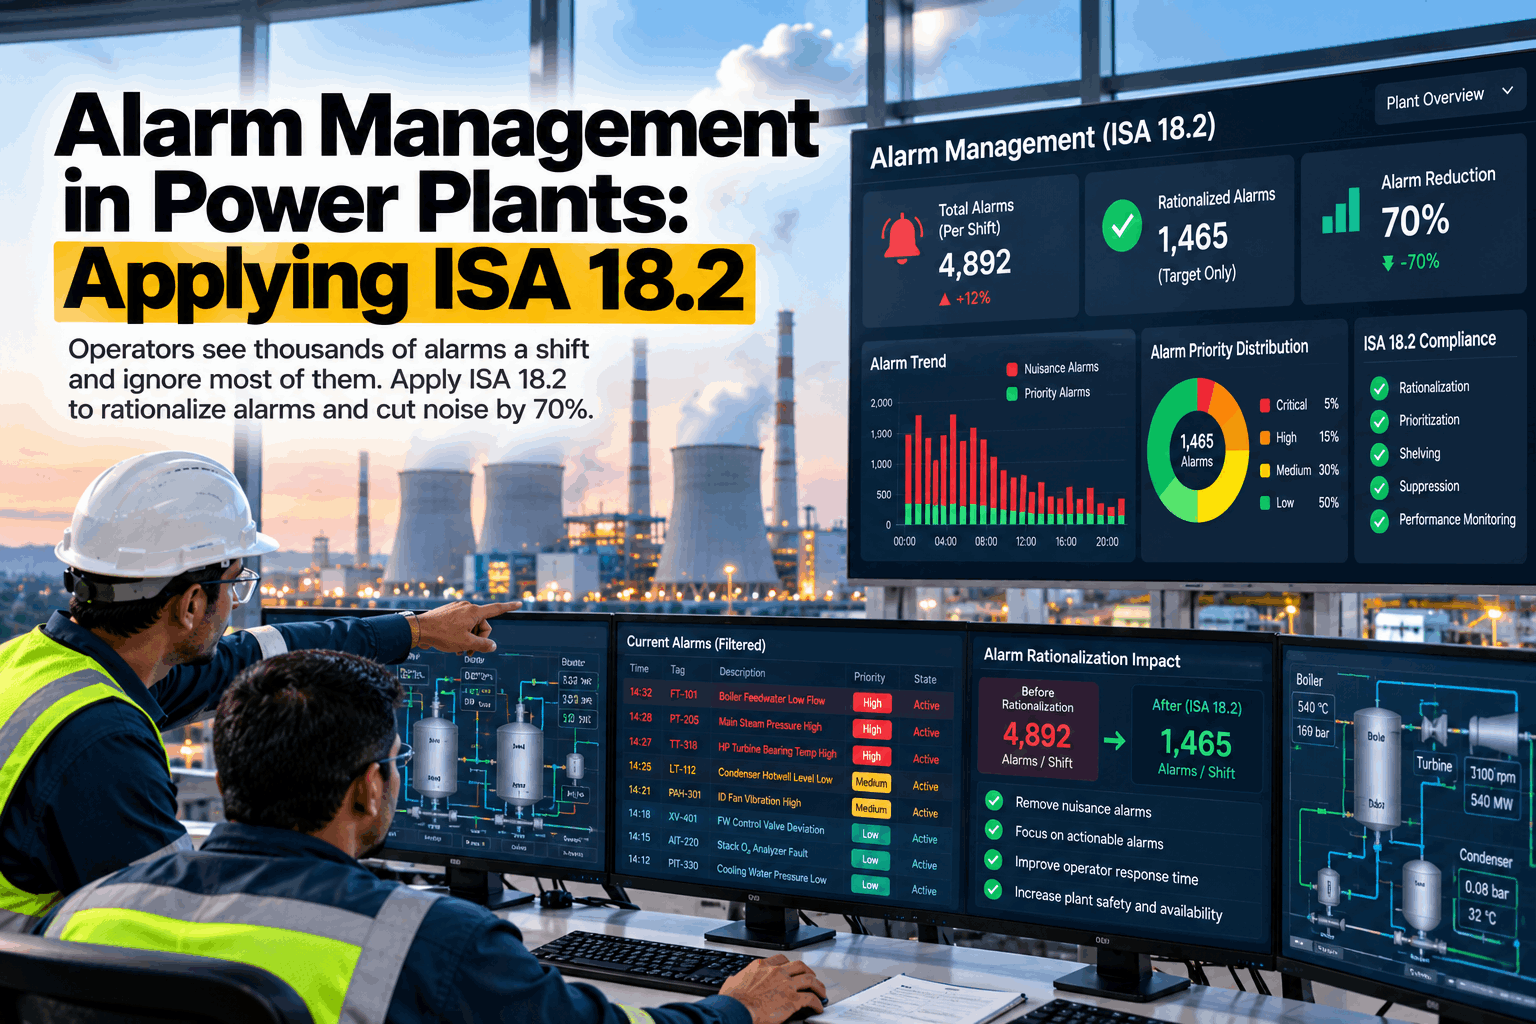
Large reductions are normal in a first programme, because the load is so concentrated. At the Baldwin Energy Complex, a three-unit, 1,800 MW coal station, published results show total alarms on two units falling by 61% and 58% after nuisance alarms were removed and the system was rationalized. The illustrative unit reaches 70% in two steps, and the arithmetic is worth seeing because it also shows what 70% does not achieve. To estimate the same split for your unit, book a reduction review.
Fix the bad actors: 3,600 to 1,656 a day
Ten alarms produce 60% of the load — 2,160 a day. Most are chattering signals, faulty instruments and alarms on equipment that is out of service. Deadbands, on- and off-delays, instrument repairs and corrected setpoints remove about nine-tenths of them. This step needs little debate and can start in the first week.
Rationalize the rest: 1,656 to 1,080 a day
The remaining 1,440 alarms a day are reviewed system by system. Those needing no operator action become events in the log. Duplicates are merged. Priorities are reset by consequence and time to respond. Removing about 40% is typical of what a first pass achieves. Total reduction: 70%.
Design for plant state: toward 300 a day
At 1,080 a day the unit is still more than three times ISA's maximum. The rest comes from alarms that are valid in one state and meaningless in another: after a trip, during start-up, with a mill or pump out of service. State-based alarming and designed suppression deal with these, and they take longer because they change logic, not settings.
Rationalization: the Questions Asked of Every Alarm
Rationalization is a structured meeting, not a software feature. Operations, C&I and process engineers go through each alarm and write down the answers. An alarm that has no operator action does not survive. One that does is given a priority from a matrix set out in the alarm philosophy — the one shown is typical, not prescribed.
Alarm Floods After a Trip: Alarming by Plant State
The worst moment for an alarm system is the one where the operator most needs it. When a unit trips, flows collapse, pressures fall and fans run back, and each of those changes raises its own alarm. Hundreds arrive in minutes — the Baldwin unit recorded 685 in its worst hour — and the one that explains the trip is somewhere among them. State-based alarming means the system knows what state the plant is in and presents only what matters in that state. It is designed and tested in advance; it is not operators silencing alarms as they go. Our application engineers can review how your last trip looked on the alarm list.
A mill, pump or fan out of service
What the AI Adds for the Operator
Rationalization decides which alarms exist. The AI helps with the ones that remain, and with keeping the system honest afterwards. iFactory's models run on a GPU server inside the plant and read the alarm and event log alongside process data, so nothing leaves the station and nothing is written to the DCS.
- Bad actors, every shift. The most frequent, chattering and stale alarms are ranked automatically, each with the likely remedy.
- Flood analysis. After a trip, the sequence is rebuilt: what came first, what followed from it, and what was unrelated.
- Guidance beside the alarm. Cause, consequence and response from the rationalization record appear with each alarm.
- Questions in plain language. Operators ask what is behind a group of alarms and get the data, not another list.
The Alarm Dashboard a Shift Can Use
Monitoring is one of the ten lifecycle stages, and it works only if the numbers are in front of the people who can act on them. These are the views worth putting on the wall and into the handover.
Alarm rate, live
Alarms in the last ten minutes and the last hour against the ISA benchmarks, so a flood is visible as it builds.
Top ten this shift
The alarms that produced the most annunciations, with their share of the total and the action raised for each.
Standing and shelved
Every alarm standing more than 24 hours and every shelved alarm, with its age, reason and owner.
Trend by week
Alarms a day, time in flood and priority split, week by week, so the programme's progress is plain to see.
Delivered as a Turnkey AI System — Hardware and Software Together
iFactory ships as a complete bundle: a pre-configured NVIDIA AI server, racked and ready, with the alarm analytics and AI models pre-loaded. Rack it, plug in power and Ethernet, and the AI is live on your network — plant data stays inside the station. Our team handles cabling, network setup, read-only connections to your DCS, PLC and SCADA alarm and event logs and historian, operator training and 24×7 remote monitoring. For a scoped proposal, book a deployment call.
Ship, network and data
Server delivered and racked. Alarm and event log connected, with three months of history loaded. First benchmark and bad-actor list issued.
Model training and pilot
Models trained on the unit's alarm and process history. Shift dashboard live on one unit. Bad-actor fixes proposed and tracked through your change process.
Go-live and training
Remaining units connected. Response guidance loaded from rationalization records. Operators and C&I engineers trained; weekly review handed over.
Frequently Asked Questions
What is ISA 18.2?
ANSI/ISA-18.2-2016, Management of Alarm Systems for the Process Industries, is the standard that sets out how an alarm system should be designed, operated and maintained over its life. It defines what an alarm is, describes a ten-stage lifecycle and gives performance measures for judging a system.
How many alarms should a power plant operator receive?
ISA 18.2 gives about 150 a day per operator position as likely to be manageable and 300 as the maximum, which is roughly one to two every ten minutes on average. Many units run at ten or twenty times that before a programme begins.
Is a 70% reduction realistic?
For a system that has never been rationalized, reductions of that order are common, because a handful of alarms usually produce most of the load. Published results from one US coal station show 61% and 58% on two units. The figure for your unit depends on how concentrated its alarm load is, which the first benchmark shows.
Does reducing alarms reduce safety?
Done properly it improves it. No alarm is removed without a recorded review of what it protects against and what the operator should do. The risk lies in the present state, where real alarms are buried among hundreds that need no action.
What is alarm rationalization?
A structured review of each alarm by operations, C&I and process engineers. For every alarm the team records the cause, the consequence of not responding, the operator's action, the time available and the priority. Alarms with no operator action become events or are removed.
Does iFactory change settings in our DCS?
No. It reads the alarm and event log and process data, analyses them and proposes changes. Every change to a setpoint, deadband, delay or suppression logic is made by your engineers in the control system, through your management of change process.
How long does deployment take, and what do we need to provide?
A typical unit is live in 6–12 weeks. You provide rack space, power, an Ethernet connection, read access to the alarm and event log, your alarm philosophy if one exists, and an operations and a C&I contact for the pilot. iFactory supplies the pre-configured NVIDIA AI server, software, integration and training. To scope your station, contact our project team.
Give the Horn Its Meaning Back
One turnkey system — NVIDIA AI server, alarm analytics, integration and training — delivered and live inside 12 weeks. Start with the unit whose operators have stopped looking at the alarm list.
- 1Alarms a day, per operator desk
- 2Share from the ten most frequent alarms
- 3Ten-minute periods with more than ten alarms
- 4Alarms standing for more than 24 hours
- 5Share of alarms at the highest priority