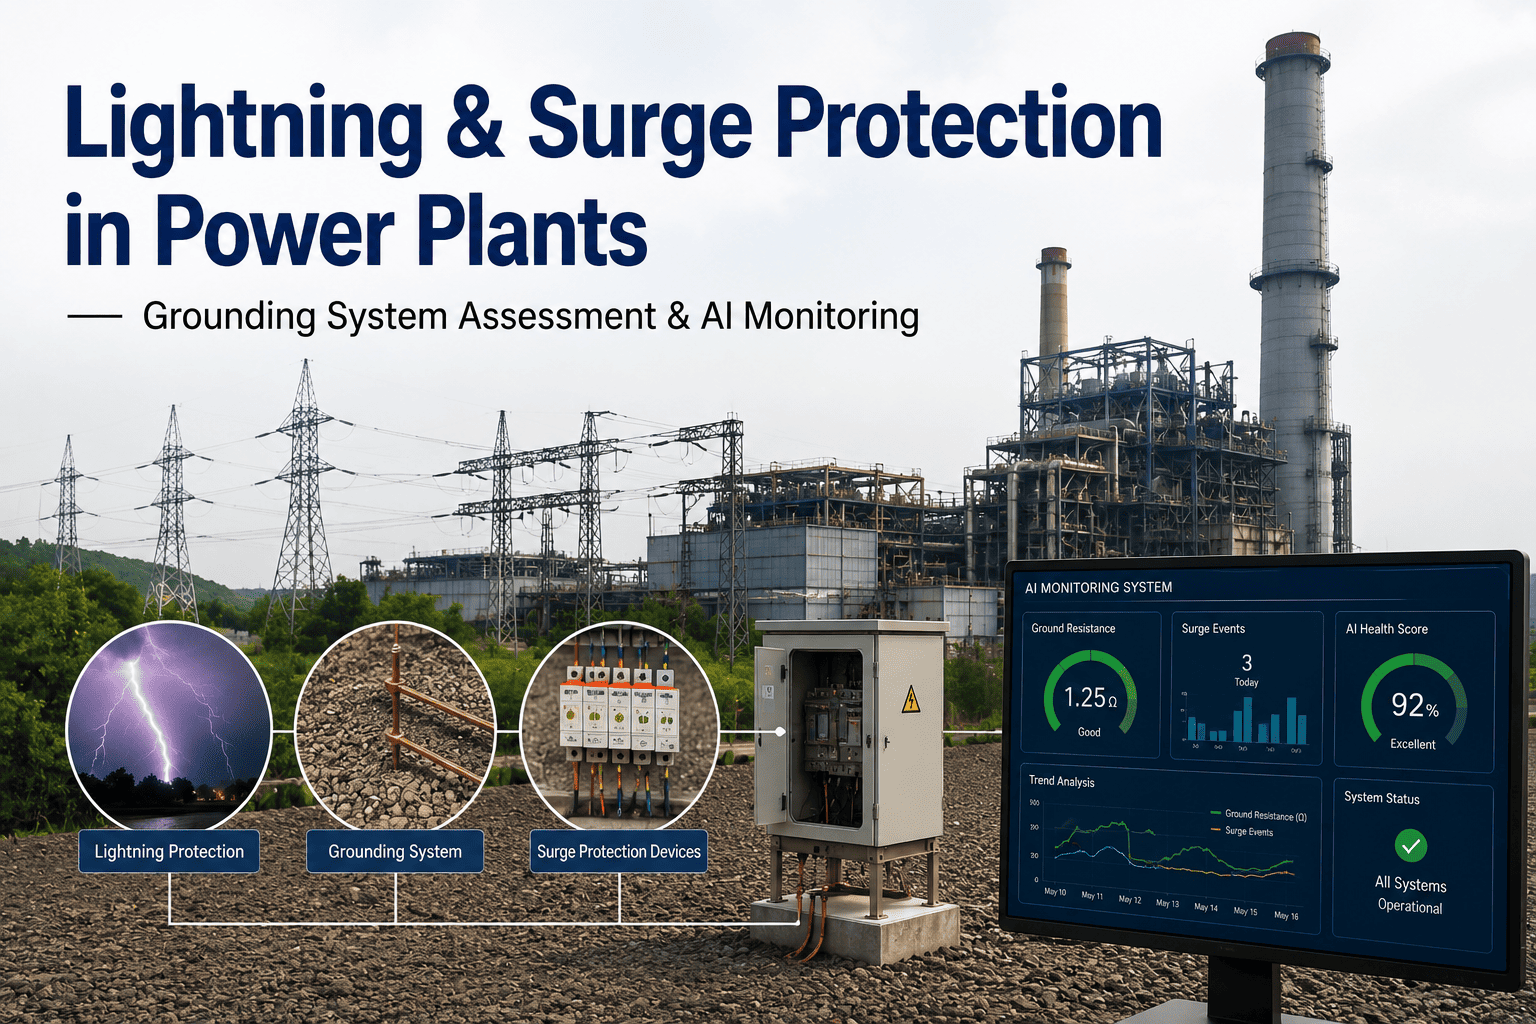
Power plant grounding systems sit beneath every foot of the switchyard, every transformer pad, and every generator foundation, carrying fault currents that would otherwise endanger personnel and destroy equipment. Most of these ground grids were designed and tested once during commissioning, then left untouched for years while soil chemistry shifts, connections corrode, and ground grid conductors degrade silently. The only way to know whether your grounding system still performs as designed is to test it systematically, and the only way to test it properly is to understand both the electrical measurement methods and the soil conditions that determine how well those buried conductors actually function. iFactory helps plant teams schedule, execute, and track grounding system assessments so nothing falls through the cracks between outage cycles.
Your ground grid was tested at commissioning. That was years ago.
Soil conditions change, connections corrode, and standards evolve. iFactory brings structure to your grounding system testing program so you can prove your ground grid still protects people and equipment.
A buried ground grid is not a set-it-and-forget-it asset
Grounding systems are physically buried in soil that is chemically active. Moisture cycles, seasonal temperature swings, and underground chemical reactions all work on the conductors, connections, and ground rods that make up your grid. The degradation is invisible from the surface, which is exactly why so many plants discover problems only after a fault event reveals that the ground grid impedance had risen far above its design value. Understanding the specific mechanisms that degrade grounding performance is the first step toward a testing program that catches problems before they become incidents.
Corrosion of copper conductors
Copper ground grid conductors corrode where they contact dissimilar metals at connections, where soil chemistry is particularly aggressive, or where the copper coating on steel rods has been compromised. Corroded sections have higher resistance, which means fault current will not flow as intended and local touch potentials can rise to dangerous levels during a fault event.
Connection fatigue at exothermic welds
Exothermic welds and mechanical connections between grid conductors and ground rods can develop high-resistance joints over time. Thermal cycling from load changes and fault currents, combined with soil movement and settlement, gradually degrades these connections. A single high-resistance joint can isolate a section of the ground grid from the rest, creating a pocket of elevated ground potential.
Soil resistivity changes over time
Soil resistivity is not a fixed property. Seasonal moisture variation, changes in groundwater level, chemical contamination from nearby industrial activity, and even the decomposition of organic material in backfill all shift the resistivity of the soil surrounding your ground grid. A grid designed for a soil resistivity of 100 ohm-meters may now be sitting in soil at 300 ohm-meters, fundamentally changing its performance.
Physical damage from construction and excavation
Subsequent construction near the original ground grid area can sever conductors, damage ground rods, or disturb the treated soil backfill that was part of the original design. Without as-built documentation that is kept current, these cuts and disturbances go unnoticed until testing reveals an unexpected increase in ground grid resistance.
Ground enhancement material depletion
Many ground grids rely on ground enhancement materials like bentonite clay, conductive concrete, or chemical salts to lower the effective resistance around electrodes. These materials dissolve, leach away, or become less conductive over years of service. When the enhancement material is gone, the electrode resistance reverts to whatever the native soil provides, which is often significantly higher.
Aging beyond design assumptions
Ground grid designs are based on assumed service life, typically 30 to 40 years for copper systems. Many plants are operating beyond the original design life of their grounding infrastructure, and the degradation mechanisms accelerate rather than remain linear as the system ages. Testing intervals that were adequate at year 10 may be far too infrequent at year 35.
Most power plants cannot locate their complete as-built ground grid drawings, let alone confirm whether the grid still meets its original design impedance. Book a 30-minute session and we will show you how iFactory structures grounding assessment data so your team always knows where things stand.
Not all grounding tests measure the same thing
Grounding system testing covers several distinct measurements, each answering a different question about the health of your ground grid. Confusing these tests, or performing one when you need another, leads to false confidence or unnecessary alarm. The table below clarifies what each method measures, when it applies, and what the results actually tell you about the condition of your grounding system.
| Test Method | What It Measures | When To Use It | Key Limitation |
|---|---|---|---|
| Fall of Potential | Overall ground grid resistance to remote earth | Commissioning verification and periodic assessment of entire grid | Requires large probe spacing that may not be possible in congested plant areas |
| Slope Method | Ground grid resistance using mathematical curve analysis | When full fall-of-potential probe spacing is not available | Results depend on correct curve interpretation and can be ambiguous in complex soil |
| Star-Delta Method | Ground grid resistance without a long probe run | Urban or congested sites where long straight probe runs are impossible | Less intuitive to interpret and requires careful electrode placement geometry |
| Wenner Four-Point Soil Resistivity | Apparent soil resistivity at multiple depths | Before ground grid design or when reassessing soil conditions at an existing grid | Measures apparent resistivity that requires interpretation to derive a soil model |
| Touch and Step Potential | Voltage gradients at ground surface during fault conditions | Safety verification at fence lines, equipment pads, and personnel access points | Requires injected test current that may not replicate actual fault current distribution |
| Stakeless Method | Resistance of individual ground connections using clamp-on technique | Quick screening of individual bonds and connections within a grid | Does not measure resistance to remote earth, only loop resistance between test points |
The fall of potential method remains the reference standard for measuring overall ground grid resistance to remote earth, but it demands physical space for current and potential probe placement that many operating plants simply do not have available. Understanding which method fits your site constraints and what each result actually represents is critical to building a testing program that produces meaningful data rather than numbers on a form. iFactory helps teams select the right test method for each specific measurement situation and records the results in a structured format that supports trend analysis across testing cycles.
Soil resistivity determines everything about your ground grid performance
Soil resistivity is the single most important factor in grounding system design and performance, yet it is the parameter that plants understand the least and monitor the least frequently. The resistivity of the soil surrounding your ground grid determines how easily fault current can dissipate into the earth, which directly controls the ground grid impedance, the touch and step potentials at the surface, and the effectiveness of every ground rod and conductor you have buried. A ground grid designed for one soil resistivity profile can become dangerously inadequate if that profile changes, and without periodic soil resistivity surveys, you have no way to know whether the soil your grid depends on has shifted.
Bar widths represent typical relative resistivity ranges. Actual values vary significantly by site geography, seasonal conditions, and underground water presence. The Wenner four-point method at multiple probe spacings produces the data needed to build this profile for your specific site.
The Wenner four-point soil resistivity method drives a known current through two outer probes and measures the resulting voltage between two inner probes. By increasing the probe spacing and repeating the measurement, you sample progressively deeper soil layers. The resulting set of apparent resistivity values at different spacings is then interpreted, typically using software that fits a layered soil model, to produce the resistivity-versus-depth profile that grounding design calculations require. Without this profile, any ground grid design or assessment is based on assumptions rather than actual site conditions.
Seasonal variation in soil resistivity is substantial and predictable. During dry seasons, the top soil layers can see resistivity increase by a factor of three to five compared to wet season values. Ground grids that appear adequate during spring testing may be marginal during late summer drought conditions, which is precisely when fault events often coincide with higher electrical loading and thermal stress on equipment. A robust testing program accounts for seasonal variation by either testing during worst-case conditions or applying seasonal correction factors derived from historical data at the site.
Common mistakes that make grounding test results unreliable
Even when plants commit to testing their grounding systems, the results are frequently compromised by procedural errors that are easy to make but hard to detect from the numbers alone. A test that produces a number is not the same as a test that produces a valid measurement, and the difference often comes down to field technique, probe placement, and an understanding of what the instrument is actually measuring in the specific context of your site.
Insufficient probe spacing for fall of potential
The potential probe must be placed far enough from the ground grid to reach the flat portion of the resistance curve, which typically requires a distance of two to five times the maximum dimension of the ground grid. In congested plant areas, test crews often shorten the probe run to fit available space, producing a measurement that reads lower than the true grid resistance and creating false confidence in a grid that may actually be degraded.
Parallel buried metallic structures interfering with measurements
Water pipes, conduit runs, fence ground wires, and adjacent ground grids all provide parallel current paths that can significantly affect fall-of-potential measurements. If the test crew does not identify and account for these interconnections, the measured resistance will be lower than the actual grid resistance because some test current is returning through these unintended parallel paths rather than through the earth.
Using the stakeless clamp method for overall grid assessment
The clamp-on stakeless method is convenient and fast, but it measures loop resistance between two points in a connected ground system, not the resistance of the grid to remote earth. Plants that rely on stakeless measurements as their primary ground grid assessment method are measuring the wrong parameter and may miss significant degradation that only shows up in a proper fall-of-potential test.
Testing during wet conditions and assuming results represent worst case
Ground grid resistance is lowest when soil moisture is highest, so testing after rain or during wet seasons produces the most favorable results. If these favorable results are used as the basis for declaring the ground grid adequate, the grid may be dangerously marginal during dry conditions when soil resistivity is at its peak and fault current dissipation is most constrained.
Not documenting test geometry and conditions for future comparison
Grounding test results are only meaningful when compared against previous results from the same test method, same probe locations, and similar seasonal conditions. Plants that record only the final resistance number without documenting probe placement, soil temperature, moisture conditions, and weather history make it impossible to perform meaningful trend analysis across testing cycles.
Ignoring the connection between soil resistivity changes and grid performance
A ground grid that tested at 0.5 ohms ten years ago might test at 1.2 ohms today not because the grid itself has degraded but because the surrounding soil resistivity has changed. Without a current soil resistivity survey to separate grid degradation from soil condition changes, the test data cannot support informed decisions about whether to remediate the grid, add ground rods, or apply ground enhancement treatment.
Stop relying on commissioning-era grounding data
iFactory structures your grounding test program so every measurement is comparable, every trend is visible, and every gap is flagged before your next outage.
What standards actually require for grounding system testing
Multiple industry standards address grounding system design, testing, and maintenance, and the requirements are more specific than many plants realize. The challenge is not just performing the tests but documenting them in a way that demonstrates compliance during an audit, insurance review, or incident investigation. Each standard has different testing intervals, different measurement methods, and different acceptance criteria that your testing program needs to satisfy simultaneously.
Guide for Measuring Earth Resistivity, Ground Impedance, and Earth Surface Potentials
Defines the fall-of-potential method, slope method, and star-delta method for ground grid resistance measurement. Specifies probe placement requirements, test current frequency recommendations to avoid power frequency interference, and interpretation guidelines for different soil structures. This is the primary reference for how to perform the test correctly.
Guide for Safety in AC Substation Grounding
Establishes the design criteria for ground grids including maximum tolerable touch and step voltages, ground grid conductor sizing, and the relationship between soil resistivity, fault current magnitude, and grid geometry. While primarily a design standard, it defines the performance criteria that periodic testing must verify are still being met.
Recommended Practice for Grounding of Industrial and Commercial Power Systems
Addresses grounding of equipment, systems, and structures within industrial facilities including power plants. Covers grounding of generators, transformers, switchgear, and building steel, and provides recommendations for ground system testing intervals and methods appropriate to industrial environments.
National Electrical Code, Article 250
Requires that grounding electrode systems be effectively grounded and that the resistance to ground be low enough to limit the voltage to ground. While NEC does not specify a numeric resistance threshold for most systems, it establishes the legal requirement that the grounding system must function as designed, which must be verified through testing.
Grounding Requirements for Fixed Equipment
Requires that the path to ground from circuits, equipment, and enclosures be permanent, continuous, and have ample capacity to conduct safely any fault current likely to be imposed on it. OSHA enforcement can require demonstration through testing that these requirements are being met at your facility.
Transmission System Planned Performance
For transmission-connected generating facilities, NERC reliability standards require that protective relaying systems perform correctly, which depends on proper grounding system function. Grounding system degradation that affects relay performance can become a NERC compliance issue.
From scattered spreadsheets to a structured grounding test program
Most plants manage grounding test data in spreadsheets, paper files, or the notes of whichever engineer happened to be present during the last outage when testing was performed. This approach makes it nearly impossible to compare results across testing cycles, identify degradation trends, or demonstrate compliance during an audit. iFactory replaces that fragmented approach with a structured system that captures every test result in a consistent format, links it to the specific grid section and test method used, and makes trends visible to the entire team.
Inventory your grounding assets
Document every ground grid, ground rod, connection point, and test location across your plant. iFactory creates a structured asset register that ties each test result to a specific physical location and grid section, so you always know exactly what was tested and what was not.
Define test procedures by method
Configure test procedures for fall-of-potential, Wenner soil resistivity, touch and step potential, and stakeless screening methods, each with its own data fields, acceptance criteria, and required documentation. This ensures every test crew collects the same data regardless of who performs the test.
Schedule tests by outage window and standard requirement
Map testing requirements from IEEE 81, IEEE 80, NFPA 70, and your internal standards to specific test locations and frequencies. iFactory generates scheduled work orders that align with your outage planning cycle so testing gets done when access is available.
Capture results with full test context
Record not just the measured value but the test method, probe locations, soil conditions, weather, temperature, instrument used, and any deviations from standard procedure. This context is what makes trend analysis possible and audit responses defensible.
Trend and alert on degradation
iFactory plots ground resistance trends over time for each test location, applying statistical alerts when measured values show significant upward drift. Early detection of degradation allows you to plan remediation during a scheduled outage rather than responding to an incident.
Prove compliance on demand
Generate audit-ready reports that show testing history, trend analysis, compliance status against each applicable standard, and any corrective actions taken. What used to take days of digging through files becomes a structured report available in minutes.
Capabilities built for grounding system management
Ground grid asset register
Every ground grid, test point, and connection documented with location, installation date, original design parameters, and as-built references so nothing is lost when personnel change.
Outage-aligned test scheduling
Grounding tests are scheduled to match your planned outage windows, with automatic reminders and work order generation so testing does not get bumped when outage schedules get tight.
Structured test result capture
Every test result recorded with method, probe geometry, soil conditions, and instrument details in a consistent format that supports comparison across years and testing crews.
Resistance trend monitoring
Time-series plots of ground resistance at each test location with statistical drift detection, so degradation is identified early and quantified for remediation planning.
Soil resistivity profile management
Wenner survey results stored as layered soil models that can be updated and compared over time, showing how the soil conditions your grid depends on are changing.
Multi-standard compliance mapping
Each test location mapped to the IEEE, NFPA, OSHA, and NERC standards that apply, with compliance status tracked automatically as test results are recorded.
What plants achieve after implementing structured grounding programs
What a grounding assessment pilot includes
Grounding asset inventory and mapping
We work with your plant drawings, one-line diagrams, and field walkdowns to build a complete asset register of ground grids, test points, and connection locations in iFactory.
Historical test data migration
Existing spreadsheets, test reports, and paper records are digitized and loaded into iFactory with the test context needed to establish baseline trends.
Test procedure configuration
Procedures for each test method are configured with your specific acceptance criteria, required documentation fields, and standard references.
8 to 12 week pilot cycle
The pilot covers at least one full testing cycle, including scheduling, field data capture, trend analysis setup, and compliance report generation using your actual plant data.
On-premise deployment option
iFactory runs on plant-network hardware, keeping grounding system data, test results, and compliance records inside your network perimeter.
Managed service support
iFactory operations team monitors data quality, trend alerts, and system performance so your engineers focus on engineering rather than software management.
Grounding system testing, answered plainly
Your ground grid is aging. Your test data should show you exactly how fast.
iFactory structures your grounding system testing program from scheduling through compliance reporting. Book a demo and we will walk through what structured grounding data looks like for a plant like yours.