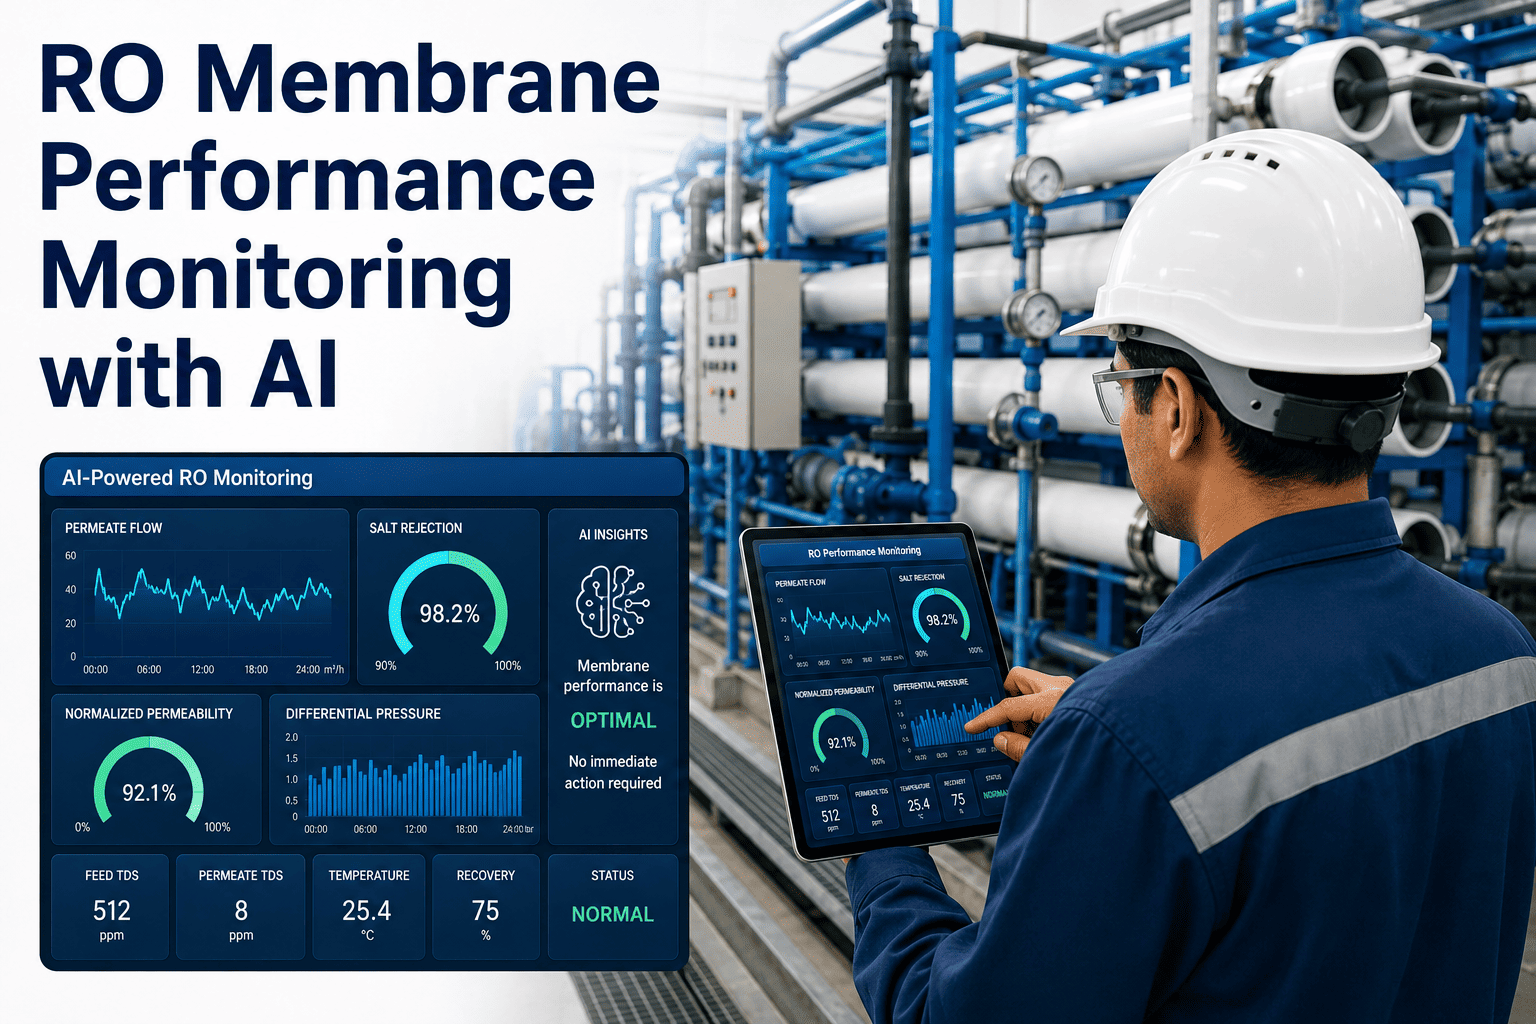
A reverse osmosis system rarely fails all at once — it fails one normalized data point at a time, weeks before anyone notices. Feed pressure creeps up, the operator assumes it is just a colder morning, and the membrane keeps fouling underneath a set of raw readings that never looked alarming on their own. The only way to actually see fouling coming is to normalize every reading against temperature, pressure, and recovery first, then trend the result — and almost no plant does this by hand consistently enough to catch it early. iFactory calculates normalized flux, salt rejection, and differential pressure continuously from your existing instrumentation, and you can book a demo to see what your own RO trend line has been quietly telling you.
Your RO Membrane Is Already Telling You When It Needs Cleaning — Most Plants Just Are Not Listening to the Right Numbers
Raw flow, raw pressure, and raw rejection readings shift with feed temperature and recovery rate every single day, which hides the slow fouling trend underneath normal operating noise. A plant running two or three RO trains rarely has the staff hours to normalize every reading by hand across every train, every shift, which is exactly why so many CIP cycles get scheduled too late or too early. iFactory normalizes and trends your RO data continuously so a real fouling signal gets caught in days, not at the next quarterly service visit.
Raw Readings Lie to You — Normalized Flux, Salt Rejection, and Pressure Are What Actually Tell the Truth
A membrane can look fine on a raw pressure gauge and still be fouling badly underneath, because temperature and recovery changes move the raw numbers just as much as fouling does. Normalization strips those variables out so what remains is the membrane's real condition, comparable day to day and month to month against the baseline set when it was new or last cleaned. Most membrane manufacturers publish the correction factors in their technical manuals, but applying them consistently across every reading, every shift, and every train is a task better suited to continuous software than a weekly spreadsheet exercise.
Normalized Permeate Flow (NPF)
NPF = Actual Flow × Temperature Correction × Pressure Correction
NPF is the single earliest and most reliable signal of fouling. A steady downward drift in NPF against a flat driving pressure means the membrane surface is losing permeability, almost always before rejection or raw flow show any visible change. Because NPF reacts before the other two metrics, it is the number most worth automating first if your team is building out a monitoring program in stages.
Normalized Salt Rejection (NSR)
NSR = (1 − Permeate TDS ÷ Feed TDS) × 100
NSR shows how well the membrane is holding back dissolved salts. A healthy element typically runs 97–99% rejection; once it slips toward 90%, the membrane is generally considered compromised rather than simply fouled, and cleaning alone may not fully recover it. A gradual, steady NSR decline over several years is normal membrane aging, but a sharp drop over days or weeks is a different problem entirely and usually points to physical damage rather than routine fouling.
Normalized Differential Pressure (NDP)
NDP = Feed Pressure − Concentrate Pressure (normalized for flow)
NDP tracks resistance to flow through the feed channels. It is usually the fastest-moving of the three metrics, which makes stage-by-stage NDP the parameter worth watching daily if your team can only track one number closely, since a spike here often shows up days before either flow or rejection move enough to be noticed on a raw gauge.
Which Stage Is Drifting Tells You What Is Actually Fouling the Membrane
Differential pressure does not just tell you that fouling is happening — the pattern across your stages tells you what kind of fouling it is, which determines whether the right response is an acid clean, an alkaline clean, or a biocide flush. Choosing the wrong chemistry does not just waste a cleaning cycle; in some cases it can disperse organics deeper into the membrane or fail to touch a scale layer entirely, leaving the plant worse off than before the clean was run.
| Observed Pattern | Likely Foulant | Typical Cleaning Response |
|---|---|---|
| First-stage ΔP rising faster than second-stage | Colloidal or biological fouling on lead elements | Alkaline detergent clean, followed by biocide rinse if biofilm is confirmed |
| Second-stage ΔP rising faster than first-stage | Mineral scale on tail elements, often calcium carbonate or sulfate | Low-pH acid clean targeting inorganic scale |
| NSR dropping while NPF holds steady | O-ring leak, membrane degradation, or oxidation damage | Physical inspection and probe testing of individual pressure vessels, not a chemical clean |
| NPF dropping while NSR rises together | Active biofouling, often with odor or visible slime present | Alkaline cleaner plus a dedicated biocidal treatment step |
| NDP and pump pressure both rising as temperature falls | Normal seasonal viscosity change, not fouling | No cleaning needed — confirm against normalized data before acting |
Most plants only discover this fingerprint after the fact, once a stack testing contractor or a service technician has already pulled the membrane apart to inspect it. The pattern is visible in the trend data well before that point — the challenge has always been having someone watch all three metrics closely enough, consistently enough, to catch it while the fouling is still light rather than after a full teardown becomes the only way to confirm what happened.
Stop Guessing Which Foulant You Are Dealing With
iFactory reads stage-by-stage ΔP, NPF, and NSR together and tells your team whether the next clean should be acid, alkaline, or a biocide flush — before the wrong chemistry gets circulated.
The Industry's 10/5/15 Rule — and Why Waiting Past It Costs You the Membrane, Not Just the Water
Membrane manufacturers and water treatment chemists converge on roughly the same threshold set for triggering a clean-in-place cycle. Cross any one of these three lines and the fouling is no longer a minor variance — it is an active problem with a shrinking window to fix cleanly. Set the alert threshold too tight, below roughly 8%, and normal day-to-day variability starts triggering false alarms; set it too loose, above roughly 15%, and the response window for an easy clean starts closing before anyone notices.
Normalized Flow Drops 10–15%
The clearest single trigger for scheduling a clean-in-place cycle. Waiting past this point extends the cleaning duration needed and reduces how much of the lost performance actually comes back.
Salt Passage Rises 5–10%
A smaller move than flow, but it directly affects downstream product water quality and is often the first sign a customer-facing quality complaint is about to happen.
Differential Pressure Rises 10–15%
Usually the fastest-moving metric of the three and the one most likely to trigger a high-pressure trip or feed channel damage if it is allowed to keep climbing unaddressed.
The mistake most plants make is not ignoring these thresholds entirely — it is checking for them manually, on a weekly or monthly cadence, which means the actual crossing point can be missed by days or weeks depending on when someone last pulled the spreadsheet.
From Raw Instrumentation to a Clean-In-Place Recommendation Your Team Can Act On
iFactory turns the manual normalization spreadsheet most plants still run into a continuous background calculation, so the moment your data crosses a threshold, the right person already knows. The same workflow scales across a single skid or an entire fleet of RO trains across multiple sites, which matters for any operation managing membrane performance as a company-wide program rather than a single-plant spreadsheet.
Connect Feed, Permeate, and Concentrate Instrumentation
iFactory reads pressure, flow, conductivity, and temperature directly from your existing PLC or SCADA system, with no new sensors required to start trending.
Normalize Every Reading Automatically
Every data point is corrected for temperature, pressure, and recovery in real time, using the same normalization methodology membrane manufacturers publish in their technical manuals.
Trend NPF, NSR, and Stage ΔP Together
Because the pattern across the three metrics identifies the foulant type, iFactory trends them as one connected picture instead of three disconnected charts nobody has time to cross-reference manually.
Flag the CIP Window Before It Closes
When a threshold is projected to be crossed, your team gets a recommendation that includes the likely foulant type and suggested cleaning chemistry, not just a bare alarm.
Five Questions to Answer Before You Commit Chemicals and Downtime to a Clean
A clean-in-place cycle costs downtime, chemical spend, and wear on the membrane itself, since even a correctly executed clean puts some stress on the polyamide layer. These questions separate a clean that is actually needed from one that is guesswork, and they are the same questions a water treatment chemist would ask before signing off on a cleaning order and releasing chemical to the CIP skid.
What Plants Report After Moving From Manual Spreadsheets to Continuous Normalized Trending
The value of catching fouling early is not abstract — it shows up directly in chemical spend, membrane replacement cost, and how often the plant has to run a full CIP cycle instead of a lighter maintenance clean. Teams that move to continuous normalized trending also report fewer emergency shutdowns triggered by an unexpected high-pressure trip, since the pressure trend that causes the trip is usually visible days in advance once it is being watched properly.
Questions Water Treatment Teams Ask About RO Membrane Performance Monitoring
Turn Your Membrane Data Into a Cleaning Schedule You Can Trust
iFactory normalizes and trends flux, salt rejection, and differential pressure continuously, so your team knows exactly when a clean-in-place cycle will actually pay off.