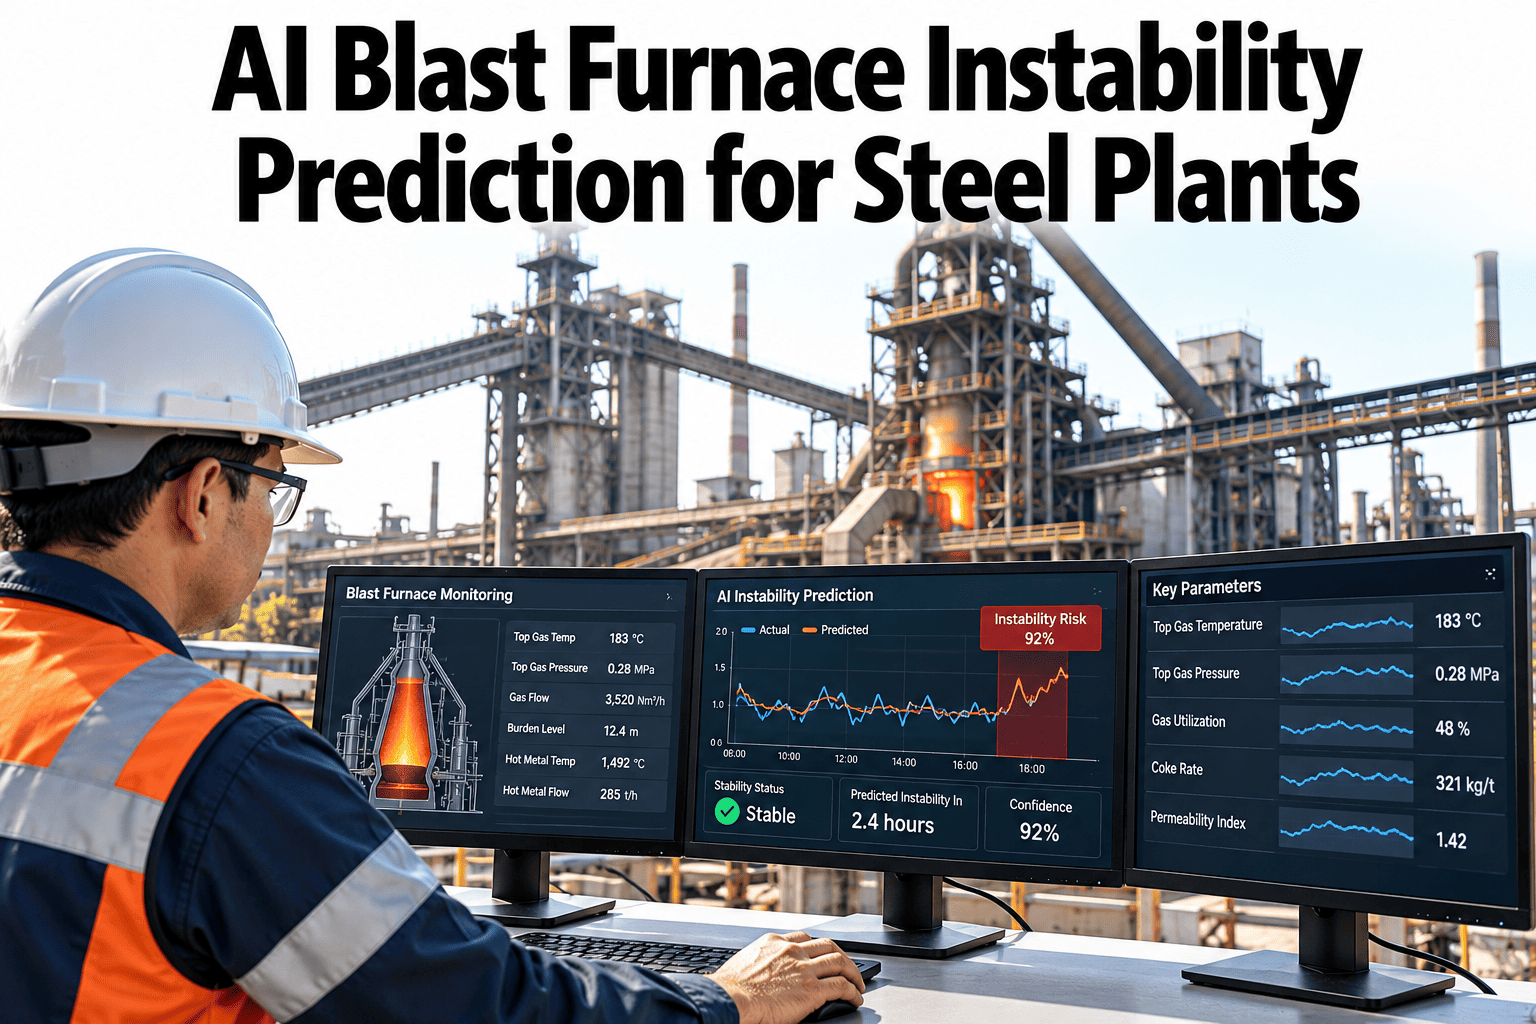
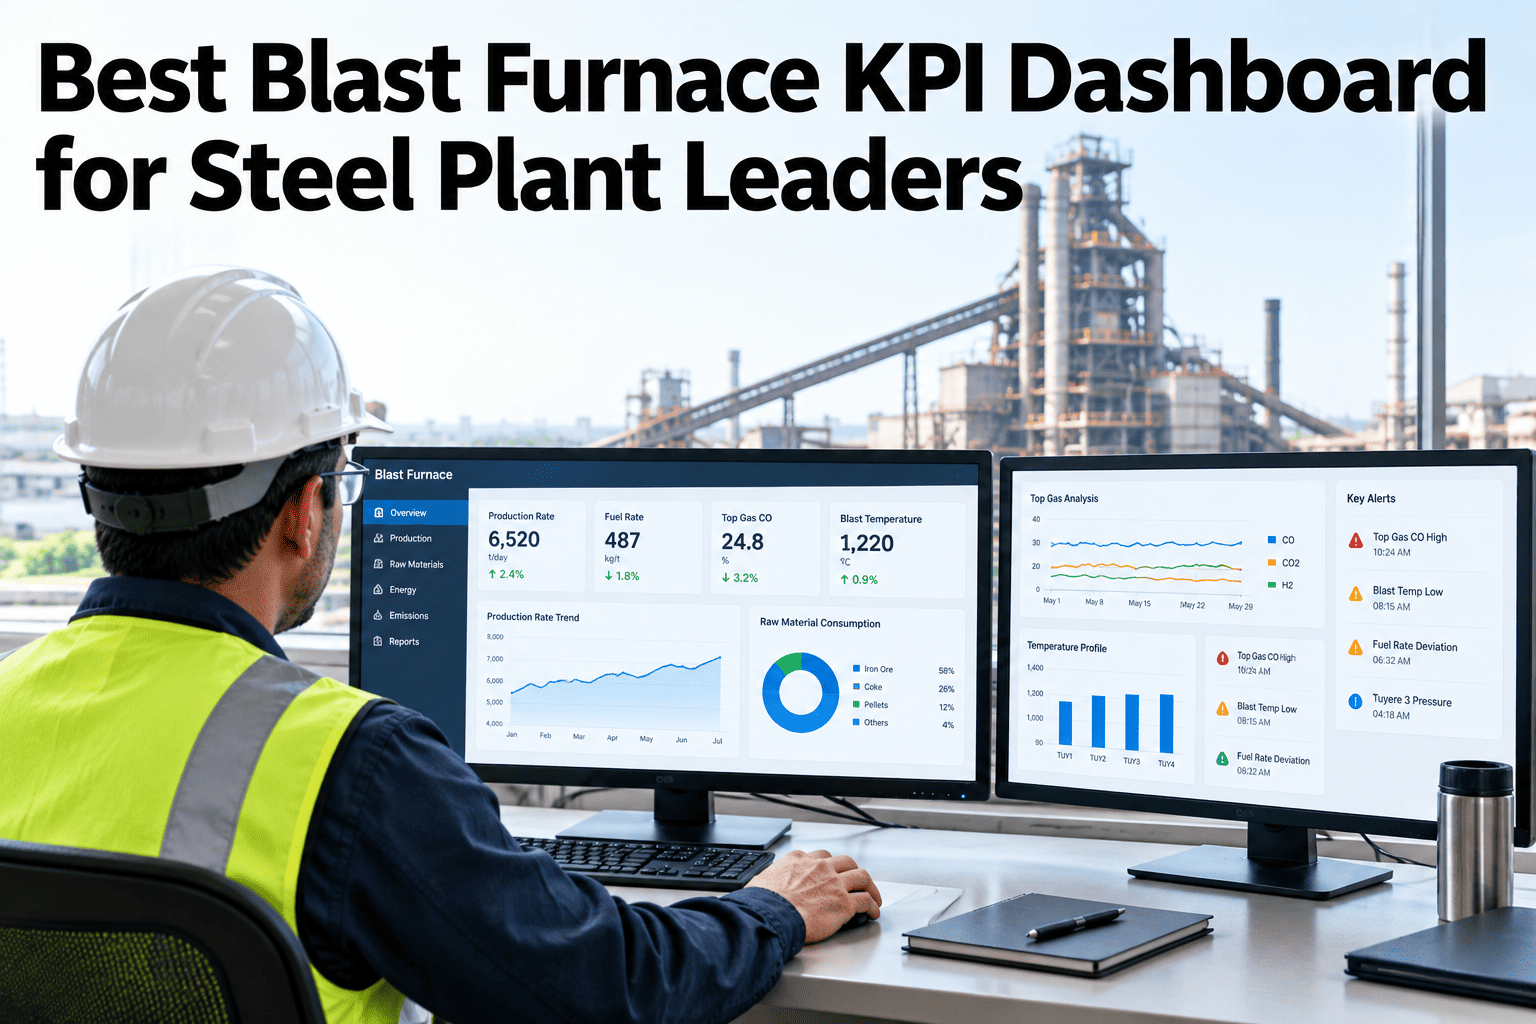
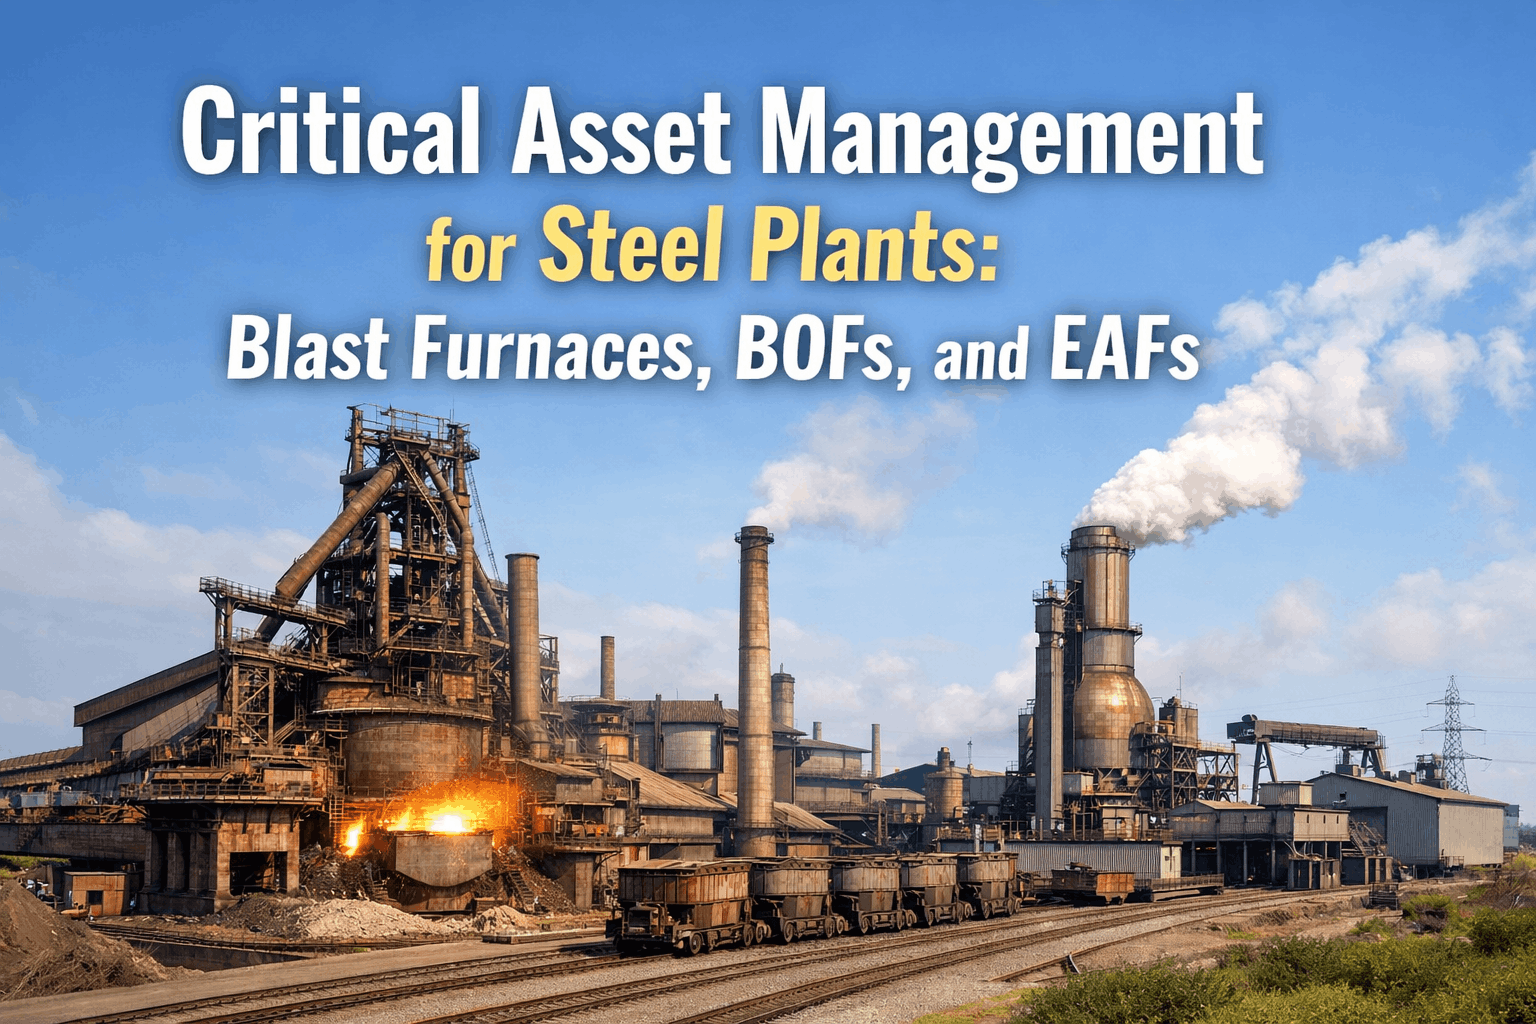
A blast furnace that hangs, slips, channels or builds scaffolds loses output, wastes fuel and can damage equipment, and operators usually notice only when the event is already under way. Yet these events rarely arrive without warning. Pressure, temperature and gas signals drift in small ways for hours or days beforehand, hidden among normal variation. AI instability prediction watches many signals together and warns when they start to move in patterns that have preceded trouble in the past. Quoted warning times of one to two days depend on the furnace and the event. To see what this could look like for your furnace, you can review an instability early warning approach with our team.
Blast furnace monitoring and failure prediction
See Hanging, Slipping, Channeling and Scaffolding Trouble Before It Reaches the Cast House
iFactory AI learns the normal rhythm of your furnace and flags combinations of signals that have preceded instability, so operators can act early and calmly.
Four instability events to watch for
HangingSlippingChannelingScaffolding
Why instability mattersOne Event Can Cost Hours of Production and Weeks of Margin
Instability is one of the most expensive problems in ironmaking. It disturbs gas flow, thermal state and hot metal quality at the same time, and recovery often takes shifts rather than minutes.
Output
Lost production while the furnace recovers
Fuel
Extra coke to restore thermal state
Quality
Off-grade hot metal and variable silicon
Equipment
Stress on the lining, staves and top equipment
Because the furnace is large and slow, early action usually works better than late action. That is the case for prediction.
The four eventsWhat Each Instability Event Looks Like
Operators use the same names, but the signals and causes differ. Knowing the pattern helps choose the right response.
1
Hanging
The burden stops descending in part or all of the furnace, often because gas flow is blocked or the burden has poor permeability. Pressure drop rises.
2
Slipping
The burden suddenly drops after a period of hanging, causing a pressure spike and thermal disturbance.
3
Channeling
Gas finds a preferred path through the burden and bypasses much of it, lowering efficiency and causing uneven descent.
4
Scaffolding
Accretions form on the furnace wall, narrowing the shaft and disturbing gas flow. When they fall, the furnace can cool suddenly.
Definitions and signs vary between furnaces. Use these descriptions as a general guide and align with your own operating practice.
Early signalsSix Signal Groups That Move Before Trouble Appears
No single sensor gives the answer. Early warning comes from small changes in several signals at once.
Pressure drop and permeability
Changes in how freely gas passes through the burden.
Blast and top pressure behaviour
Fluctuations that suggest uneven flow.
Top gas temperature profile
Shifts in how gas is distributed across the throat.
Wall and stave temperatures
Hints of scaffolds, wall working and heat load changes.
Burden descent
Slow or uneven movement of the stock.
Thermal state
Hot metal temperature and silicon trends.
The model learns how these signals normally relate to each other. It flags when the relationships change.
See What Your Furnace Signals Looked Like Before Past Events
Share a year of furnace data with the dates of known events and see how iFactory AI would test early warning on your own history.
Why one threshold is not enoughSingle Alarms Miss Gradual Change
Fixed alarm limits catch large changes. Many instability events begin as slow, coordinated shifts that stay inside every individual limit.
Threshold alarms
Watch one value at a time
Fire when a limit is crossed
Ignore slow drift inside limits
Often trip only when trouble has begun
Multivariate models
Watch many signals together
Learn normal relationships
Flag unusual combinations early
Show which signals changed and by how much
Both have a place. Thresholds protect against extremes, while models look for the early pattern.
How the model worksFour Steps From Signals to a Warning
1
Learn normal
The model studies months of operation across raw material changes and campaign stages.
2
Score the present
New data is compared with what is normal for current conditions.
3
Estimate risk
The model rates how closely the pattern resembles earlier events.
4
Explain and alert
Operators see which signals drive the warning and how long they have been moving.
A good model explains itself. Operators will act on a warning that shows its evidence and will ignore one that does not.
Warning timeWhat Lead Time Can Realistically Be Expected
Claims of warnings one to two days ahead exist, but lead time depends on the event type and the furnace. Some precursors appear for days, others only for hours.
Longest
Slow drifts such as scaffold growth
Long
Gradual permeability decline
Medium
Developing channeling
Short
Rapid hanging and slips
The staircase is illustrative. Back-test on your own events to see what lead time and false alarm rate you can expect.
Alert levelsMatch the Response to the Risk
Not every warning needs the same reaction. Clear levels keep operators focused.
Watch
Early drift. Add to the shift briefing and monitor.
Prepare
Clear pattern. Review charging, blast and thermal state and consider adjustments.
Act
Strong pattern with rapid change. Follow the furnace procedure for the expected event.
Each level should link to a short, written response, agreed with operators and process engineers.
Confidence and impactRank Warnings by Certainty and Consequence
Warning profile
High confidence
Lower confidence
Severe consequence
Act first
Clear signs of a serious event
Investigate
Serious if real, but uncertain
Moderate consequence
Plan
Likely but with moderate impact
Watch
Low confidence, moderate impact
Possible operator responsesSix Levers Operators May Consider
The model does not run the furnace. It gives operators more time to choose from the usual options.
| Lever | Typical purpose | Caution |
|---|
| Blast volume or pressure | Reduce load on the burden and restore permeability | May cost output |
| Charging pattern | Reshape gas flow | Effects take hours to appear |
| Burden quality actions | Reduce fines and improve permeability | Depends on raw material supply |
| Thermal control | Steady hot metal temperature | Avoid overcorrection |
| Cooling and wall management | Manage scaffold risk | Needs reliable wall data |
| Tuyere and injection balance | Even out raceway conditions | Needs good tuyere data |
Any action follows furnace procedures and operator judgment. The model informs choices and does not make them.
Data sourcesBring Process, Cooling and Quality Data Together
Good prediction needs time-aligned data from several systems.
Process automation signalsCooling and wall sensorsLaboratory and cast data
Instability prediction model
Control room warningsShift and daily briefingsEvent and learning records
Start with the signals you already trust and add more as the model proves its value. To plan your data flow, ask our team about furnace data requirements.
Where events come fromAn Illustrative Split of Typical Triggers
Triggers differ by furnace and campaign stage. This split is illustrative.
35 percent: Raw material changes
Fines, strength and size variation in coke and burden.
25 percent: Charging and distribution
Changes in how material lands in the furnace.
25 percent: Thermal and process swings
Hot or cold periods and unsettled operation.
15 percent: Equipment issues
Cooling, tuyere or instrument problems.
Knowing the usual triggers helps decide which signals and procedures to prioritise.
Who is involvedPrediction Works When People Trust It
Operators
We judge whether the warning makes sense and act.
Process engineers
We set the limits, review events and tune the model.
Raw materials team
We trace trouble back to quality changes.
Plant leaders
We track how many events are avoided or softened.
Review every warning and every event together. Over time the team learns which signals matter most for this furnace.
What improvement looks likeBefore and After Early Warning
Track the number of events, their severity and recovery time. This view is illustrative.
Alarm-only monitoring
Events noticed after they began
Early warning model
Events noticed after they began
Measures that matterSix Numbers for an Instability Programme
| Measure | What it shows | Why it matters |
|---|
| Events per month | How often instability occurs | Overall furnace stability |
| Warning lead time | Time between warning and event | Value of early action |
| Detection rate | Share of events preceded by a warning | Usefulness of the model |
| False alarm rate | Warnings without an event | Operator trust |
| Recovery time | Hours to return to normal | Cost of events |
| Production lost | Output affected by events | Business impact |
RolloutFive Steps From Back-Test to Daily Use
1
Collect events
List past hanging, slipping, channeling and scaffold events with dates and details.
2
Prepare the data
Align time stamps and fix gaps in key signals.
3
Back-test
Check how the model would have warned before each event.
4
Run in shadow mode
Show warnings beside operators without acting on them.
5
Adopt step by step
Use warnings in briefings and decisions and review monthly.
Event log with dates and causes
Key signals verified and time-aligned
Back-test results reviewed with operators
Detection and false alarm rates agreed
Alert levels linked to written responses
Shadow mode completed before live use
Warnings reviewed after every event
Owner named from furnace operations and process
A shift routineHow Warnings Fit Into the Working Day
Warnings are most useful when they join the daily rhythm, not sit on a separate screen.
Start of shift
Review overnight warnings and the current risk level
During the shift
Watch the model view beside normal control screens
When a warning appears
Discuss the signals and agree a response
End of shift
Record what happened and hand over clearly
Short, consistent routines make the difference between a model that is used and one that is ignored.
Learning from eventsFour Layers of a Post-Event Review
Every event, with or without a warning, is a chance to improve the model and the practice.
Timeline
What happened and when, using signals and logs.
Causes
Likely triggers such as raw material, charging or thermal changes.
Warning review
Whether the model warned, how early and how clearly.
Actions
Changes to procedures, limits, data or the model itself.
Keep reviews blameless and brief. The aim is learning, not fault-finding.
Looking after the modelFour Rhythms of Governance
Models drift as raw materials, practice and equipment change. A simple routine keeps them honest.
Weekly
Review warnings, events and false alarms with operators.
Monthly
Check data quality and model accuracy.
Quarterly
Retrain or adjust the model where needed.
After major changes
Re-test after raw material, equipment or campaign changes.
MaturityMove From Alarms to Prediction
Most furnaces move through stages as monitoring improves.
Level 1: AlarmsFixed limits on single signals
Level 2: TrendsOperators watch combined trends and shift views
Level 3: Early warningModels flag unusual combinations
Level 4: Guided responseWarnings link to tested response steps
Each stage builds trust in the data and in the people who use it.
Expert reviewWhat a Blast Furnace Operations Manager Would Check First
Early warning is useful only if operators trust it. Honest back-tests, visible reasoning and a low false alarm rate matter more than headline lead times.
Verdict
Strong when warnings are explained, tested on real events and tied to clear responses.
Watch for
Warning times quoted without false alarm rates.
Do next
Back-test on a year of events and share the results openly with the control room.
Frequently asked questionsWhat Steel Plants Ask About Blast Furnace Instability Prediction
How far ahead can instability be predicted?
Some precursors appear for a day or two, while others show only hours before an event. Claims of twenty-four to forty-eight hours depend on the furnace and event type. A back-test on your own history shows what is realistic and at what false alarm rate.
Test lead times on your data.
Which events are easiest to predict?
Slow processes such as scaffold growth and gradual permeability decline usually give longer warnings than sudden slips. Performance varies by furnace, so evaluate each event type separately.
Ask about event types.
What data do we need to start?
Reliable pressure, temperature, cooling and charging data with good time alignment, plus a log of past events. More signals improve results, but quality matters more than quantity.
Check your data readiness.
Will it increase false alarms?
It can if poorly tuned. Back-testing, shadow mode and clear alert levels help balance sensitivity and trust. Track the false alarm rate and review it monthly.
Ask about tuning.
Does the model replace operators?
No. It gives earlier, better-explained information, while operators decide what to do within furnace procedures. Their feedback also improves the model over time.
Discuss operator workflows.
Earlier warning, calmer furnace
Give Your Control Room More Time to Act
Book a session with iFactory AI to back-test early warning on your furnace history and plan a shadow-mode trial your operators can judge for themselves.