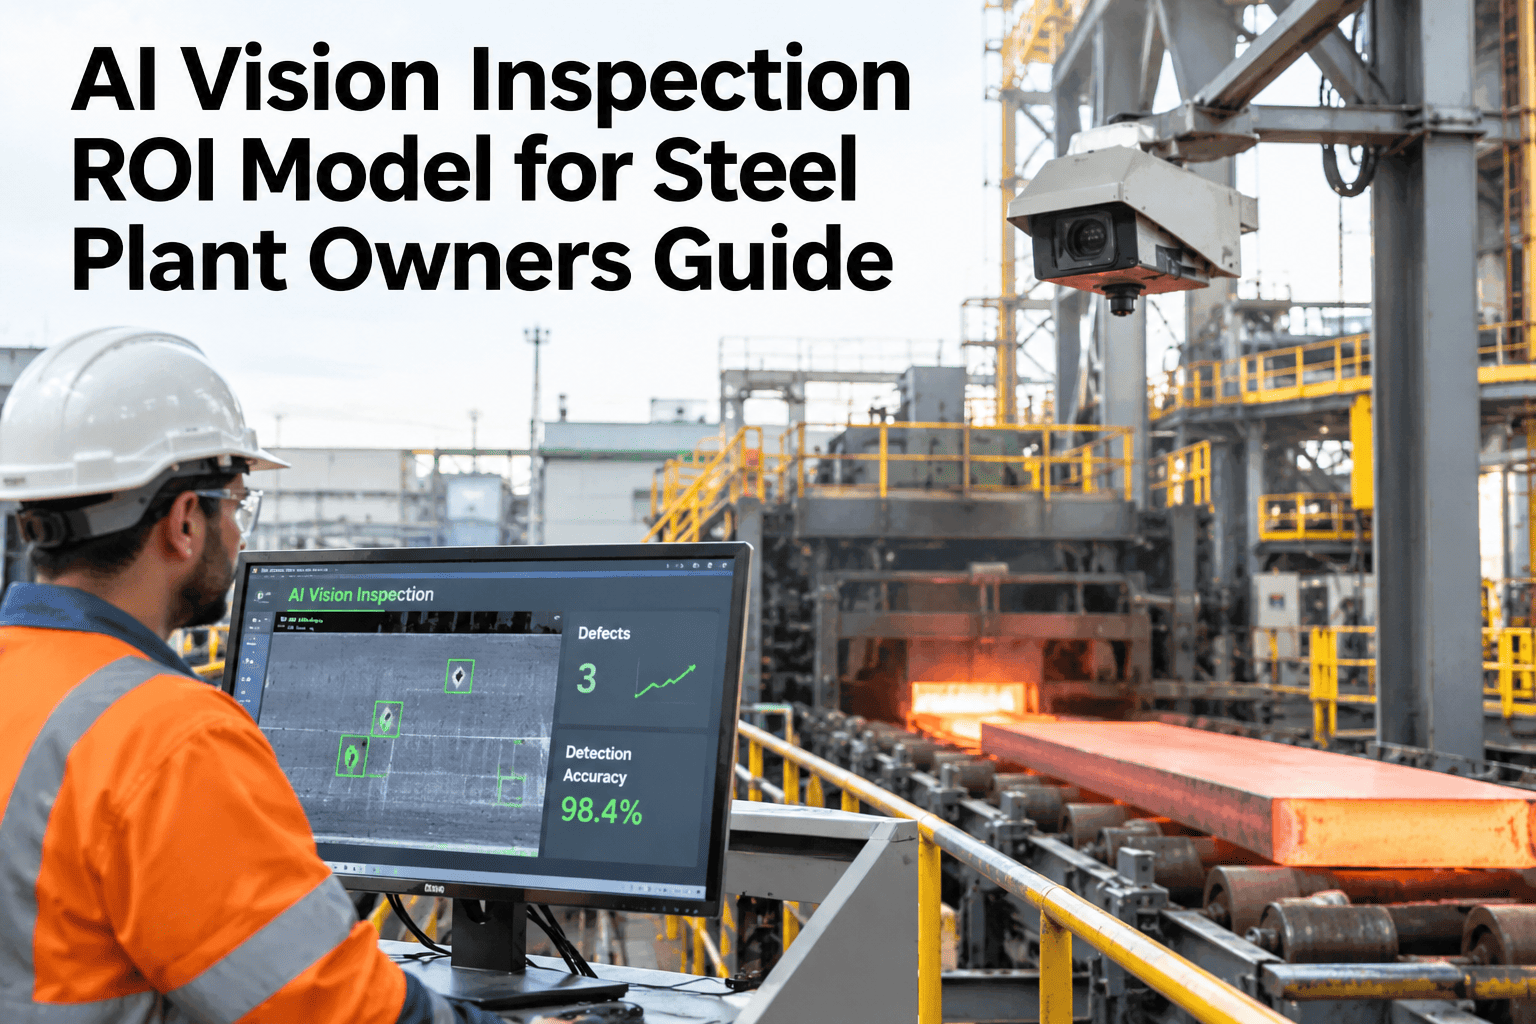
A steel plant owner does not need a camera pitch, they need a number a CFO will sign off on. AI vision inspection ROI comes from three stacked sources: less scrap, fewer downgraded coils sold at a discount, and lower manual inspection labor. Put those three together over a realistic rollout and most mills land inside a two to three year payback window, not the vague "it pays for itself" line vendors default to. Plant owners who want this modeled against their own tonnage can see a payback model built for their plant with the iFactory team.
Three Numbers Stack Into One Payback Case
iFactory, an on-premise AI platform for surface defect detection, turns scrap, downgrade and labor data into a defensible three-year ROI case for plant owners.
Why Owners Push Back on Vision Inspection Pitches
Most owners have already sat through a vision inspection pitch built on a vendor's benchmark numbers from a plant they have never visited. That pitch rarely survives contact with a finance committee.
What an ROI Model Actually Needs to Show
A credible ROI model is not one number, it is three. Scrap reduction, downgrade avoidance and labor savings each move independently, and a CFO will want to see each one defended on its own.
Scrap Reduction
Coils caught and corrected before they fully fail quality, instead of scrapped after the fact.
Downgrade Avoidance
Product sold at prime price instead of discounted after a missed or late-caught defect.
Labor Reallocation
Inspectors move from continuous scanning to root-cause and process work.
Driver One: Scrap Reduction
Manual inspection at full rolling speed typically catches only a fraction of surface defects, since humans cannot sustain full-width attention at line speed. Reported manual detection rates sit around 55 to 72 percent, against a sample of under 5 percent of the surface.
See the Scrap Number for Your Own Tonnage
Share your current scrap and downgrade rate, and iFactory will model the first driver of your ROI case.
Driver Two: Downgrade Avoidance
A coil sold as a lower grade because of a missed surface defect is a quiet loss, since it never shows up as scrap. It shows up only as a discount on the invoice.
| Outcome | Revenue Impact |
|---|---|
| Caught before shipment | Sold at prime price |
| Caught at customer | Return, credit note, freight cost |
| Missed entirely | Sold as prime, becomes a warranty claim |
Driver Three: Labor Savings
Inspection labor does not disappear, it moves. Teams shift from continuous visual scanning toward root-cause work on the defects the system actually flags.
Stacking the Case Over Three Years
Year one carries deployment and calibration cost against partial-year savings. Years two and three carry the full run-rate of all three drivers combined.
A Composite Scenario: The Case That Cleared the Board
A mid-size hot strip mill had tried to pitch AI vision twice before and been turned down both times. The pitch had led with accuracy numbers and a vendor case study from a different continent.
The third attempt used the plant's own twelve months of scrap and downgrade records instead of a vendor benchmark. Three numbers were pulled straight from existing reports: tons scrapped, tons downgraded, and inspection labor hours.
This kind of scenario is illustrative, and the exact savings depend on a plant's own baseline. The committee approved the project in one meeting, because every number on the slide traced back to a document they already trusted.
Common Mistakes That Sink an ROI Pitch
The same handful of mistakes show up repeatedly in rejected capital requests. Each one has a simple fix.
| Mistake | Fix |
|---|---|
| Leading with vendor case studies | Lead with your own scrap and downgrade data |
| One blended savings number | Show each driver separately, defensible on its own |
| No year-one deployment cost shown | Show the full three-year curve, not just year three |
Manual vs AI Vision, Side by Side
The comparison that convinces a CFO is rarely accuracy alone. It is accuracy combined with coverage and speed, laid out plainly.
| Dimension | Manual | AI Vision |
|---|---|---|
| Surface coverage | 2–5% sample-based | 100% full-width |
| Detection rate at speed | 55–72% | 95%+ reported |
| Defect-to-action time | Hours | Seconds |
Sizing the Model to Your Own Plant
A 50,000 ton plant and a 2 million ton integrated mill will land at very different dollar figures, even with similar percentage improvements. The model should always start from your actual annual tonnage.
| Input | Why It Matters |
|---|---|
| Annual tonnage | Sets the scale of every dollar figure in the model |
| Current scrap and downgrade rate | Defines the baseline the case improves against |
| Inspection headcount and shift pattern | Sizes the labor reallocation driver |
What a Rollout Timeline Typically Looks Like
Capital committees also want to know how long deployment takes before any savings begin. A phased rollout, starting with the highest-volume line, is the usual path.
Where iFactory AI Fits
iFactory connects surface defect detection to the CMMS work order and to the ROI tracking a plant owner actually reviews quarterly.
Full-Width Coverage
Every coil, every pass, not a sample.
Closed-Loop Work Orders
A defect flag becomes a maintenance action automatically.
ROI Dashboard
Scrap, downgrade and labor savings tracked against the original case.
Keeping the Model Honest After Go-Live
A model built before deployment is a forecast, not a result. The number that actually matters is the one tracked against real production data once the system is live.
Frequently Asked Questions
How fast does ROI actually show up?
Reported payback windows range from about 6 to 18 months, depending on tonnage, starting scrap rate and how quickly a line is calibrated to the plant's own defect history. Model your own timeline on a short call.
Which driver matters most for a small plant?
Scrap reduction usually dominates early, since it is the easiest to measure against existing quality records, while downgrade avoidance often grows as a share of savings over time. Ask support which driver fits your volume.
Do we need to replace our inspectors?
No, labor typically shifts toward root-cause and process work rather than disappearing entirely, since someone still needs to review every flagged defect and decide the response. Discuss staffing changes with the iFactory team.
What data do you need to build our case?
Current scrap rate, downgrade volume and inspection labor cost are the three core inputs, and a year of existing quality records is usually enough to build a first model. Send your current numbers for a first model.
Does this work with our existing cameras?
iFactory integrates with line-scan cameras already installed where specifications allow, so a plant is not always starting the project with a full hardware replacement. Ask support about your current hardware.
Give Your CFO a Number, Not a Pitch
Book a session with iFactory and get a three-driver ROI model built against your own tonnage and scrap data.