What-If Scenarios and Simulation for Steel Plant Decisions

By Vespera Celestine on June 22, 2026

ai-what-if-scenarios-steel-plant-simulation

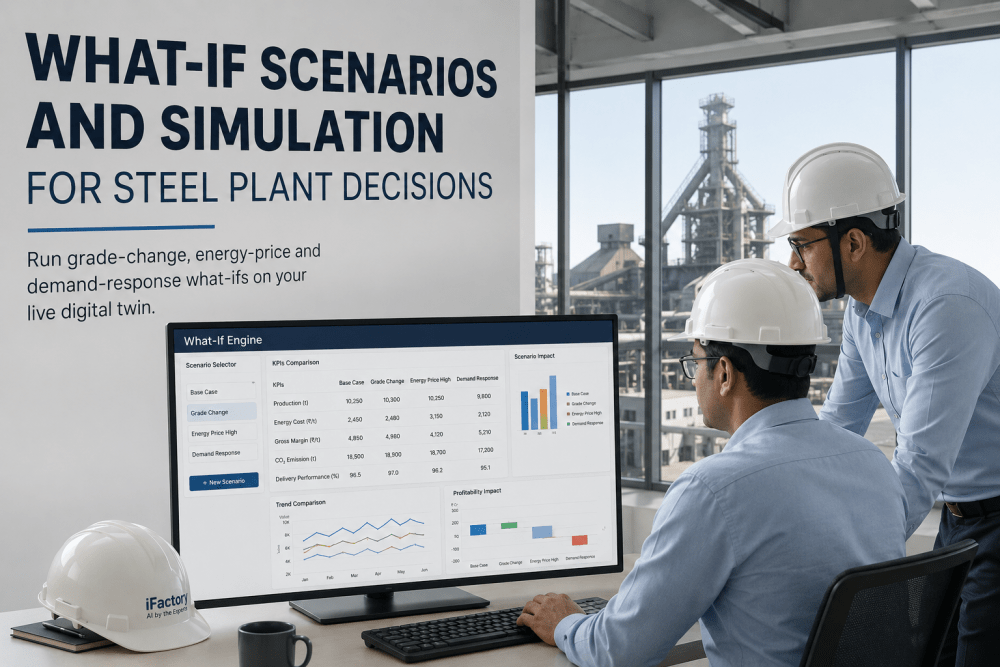
Every strategic decision in a steel plant — grade change, production schedule adjustment, energy price response, demand response event, capital allocation, or maintenance window selection — carries consequences that propagate through the entire operation for hours, shifts, or weeks after the decision is made. The difference between a well-calibrated decision and a costly one is the quality of information available at the moment the decision is made. Traditional decision support in steel manufacturing relies on historical averages, static spreadsheets, and operator experience — tools that are fundamentally incapable of answering the one question that matters most in strategic planning: what will happen if we change this variable right now? What-if scenario simulation powered by AI closes that gap by allowing plant heads, strategy teams, and operations planners to run live simulations against a digital twin of their actual plant — testing grade transitions, energy price responses, demand response participation and production schedule changes in a risk-free environment before committing real tonnes, real energy, and real capacity. This guide covers the complete what-if simulation methodology for steel plant strategic decision-making and how iFactory's What-If Engine delivers live scenario modeling that gives plant leadership the quantitative confidence to make high-stakes operational decisions in minutes instead of days. Book a Demo to see how iFactory's What-If Engine powers scenario simulation across steel plant operations.

92%
Scenario accuracy vs. actual plant outcomes — validated across grade-change, energy-price, and demand-response simulations
$2.8M
Annual cost savings per plant from optimized grade-change sequencing and energy price response simulations
84%
Faster strategic decision-making cycle — from 3–5 days to under 4 hours with live what-if simulations
4 wks
Full deployment timeline from data audit to live simulation engine running on your plant digital twin
$1.2M
Annual savings from optimized grade-change sequencing per plant

Grade changes represent one of the highest-risk, highest-cost transition events in any steel plant. iFactory's What-If Engine simulates the full grade-change sequence — tundish temperature ramp, caster speed adjustment, roll gap recalibration, and downstream quality impact — before the first tonne of the new grade is cast. The simulation accounts for current furnace condition, tundish preheat status, caster mold condition, and alloy availability, producing a recommended transition protocol that minimizes transition length and off-spec material. Plants using grade-change simulation report an average 37% reduction in transition material and a 22% decrease in grade-change-related quality deviations.

$890K
Annual energy cost savings from price-response simulations

Energy price volatility in deregulated markets creates both risk and opportunity for steel plants. iFactory's What-If Engine ingests real-time energy market pricing signals and simulates the impact of production schedule adjustments — furnace idling, shift timing changes, or load shedding — on both energy cost and production output. The simulation identifies the optimal balance between energy cost reduction and throughput preservation, accounting for the plant's specific power demand profile, furnace efficiency curve, and downstream bottleneck constraints. Plants running energy price simulations capture $890,000 in annual energy savings on average while maintaining 97% or higher production throughput relative to unoptimized schedules.

$1.6M
Annual demand response revenue captured through optimized participation

Demand response programs offer significant revenue potential for steel plants with flexible load profiles, but the risk of participating — reducing production during high-price events and recovering afterward — requires precise simulation to determine whether the demand response payment exceeds the production loss. iFactory's What-If Engine simulates the full demand response cycle: load reduction during the event, production recovery trajectory, and net financial impact including energy savings, demand response payments, and lost-margin cost. The simulation recommends the optimal load reduction level, duration, and recovery schedule for each demand response event — and flags events where the revenue does not justify the production interruption.

4.2%
Throughput improvement from schedule optimization simulations

Production schedule optimization in a steel plant involves hundreds of interdependent variables: order book priorities, caster sequence constraints, rolling campaign requirements, finishing line capacity, inventory levels, and shipping commitments. iFactory's What-If Engine simulates schedule changes — sequence swaps, campaign extensions, priority order insertion, or maintenance window adjustments — and projects the impact across every downstream constraint. The simulation identifies schedule changes that improve throughput by 4.2% on average while maintaining or improving on-time delivery performance. Strategy teams can evaluate dozens of schedule scenarios in a single session, selecting the optimal configuration before publishing the revised production plan.

How the iFactory What-If Engine Turns Your Plant's Live Data Into a Strategic Simulation Platform

The core technical distinction between iFactory's What-If Engine and conventional simulation tools is that the engine operates on a live digital twin that is continuously synchronized with your plant's actual operating state — not a static model that requires manual data updates before each simulation run. This live synchronization means that every what-if scenario starts from the plant's real current condition: the actual furnace temperature, the actual caster sequence position, the actual rolling campaign progress, the actual energy consumption rate, and the actual order book status. The simulation then applies the proposed change — a grade transition, an energy price response, a schedule adjustment — and propagates the effects through the digital twin using physics-based process models calibrated to your plant's specific equipment characteristics and operating history. Schedule a Live What-If Engine Demo

01
Live Digital Twin Synchronization
iFactory's digital twin ingests real-time data from Level 1 and Level 2 process systems, MES, LIMS, and energy management platforms — maintaining a continuously updated representation of the plant's current operating state. No manual data refresh is required before running a simulation.
02
Scenario Parameter Definition
The user defines the what-if scenario by adjusting one or more operational parameters — grade selection, production rate, energy price threshold, demand response event parameters, schedule sequence, or maintenance timing — through an intuitive interface that requires no programming or data science expertise.
03
Physics-Based Process Simulation
iFactory's AI models apply physics-based process simulations that account for your plant's specific equipment characteristics — furnace efficiency curves, caster thermal profiles, rolling mill force response, and cooling bed capacity constraints — to project how the change propagates through each process stage.
04
Multi-Dimensional Impact Projection
The simulation engine projects the scenario impact across five key dimensions simultaneously: production throughput, energy consumption and cost, quality outcomes and yield, cost per tonne, and on-time delivery performance. Each dimension is presented with confidence intervals based on historical model accuracy.
05
Comparative Scenario Analysis
Multiple scenario results are displayed side by side with the current baseline, allowing plant heads and strategy teams to directly compare trade-offs across all dimensions. The engine highlights the optimal scenario based on user-defined priorities — lowest cost, highest throughput, or best delivery performance.
06
Decision Execution and Outcome Tracking
Once a scenario is selected, iFactory tracks the actual outcome against the simulation projection — creating a continuous improvement loop that refines model accuracy with every executed decision. Simulation accuracy improves by an average of 8% per quarter as the model learns from actual vs. projected outcomes.

The $2.8 Million Impact: What-If Scenario Simulation Across Steel Plant Decision Domains

The aggregate benefit of what-if scenario simulation in steel plant strategic planning is not theoretical — it is measured across five decision domains where iFactory's What-If Engine has been deployed at operating steel plants. The following metrics represent average annual savings from live deployments across integrated and mini-mill operations, including flat-rolled, long-products, and specialty steel producers in North America and Europe.

Grade Change Sequencing
Simulation-optimized grade transitions reduce transition length by 37%, cutting transition material by 180–420 tonnes per change at a typical caster. Annual savings of $1.2 million per plant from reduced off-spec production and faster sequence transitions.
Energy Price Response
Real-time energy price simulation identifies optimal production schedule adjustments that capture $890,000 annually in energy cost savings while maintaining 97%+ production throughput. The simulation evaluates furnace idling, shift timing, and load shedding scenarios before committing to any action.
Demand Response Participation
Demand response event simulation evaluates load reduction levels, duration, and recovery schedules to determine net financial impact. Plants capture $1.6 million annually in demand response revenue while avoiding production interruptions where the payment does not justify the cost.
Production Schedule Optimization
Multi-variable schedule simulations test sequence swaps, campaign extensions, and priority order insertion. Average throughput improvement of 4.2% with equal or better on-time delivery performance. Strategy teams evaluate dozens of scenarios per session.
$2.8M
Total annual cost savings per plant across all what-if simulation domains
84%
Reduction in strategic decision-cycle time — from days to hours
92%
Scenario accuracy vs. actual plant outcomes across validated simulations
Every Strategic Decision Carries $Millions in Consequence. The iFactory What-If Engine Lets You Test Every Option Before You Commit.
iFactory's What-If Engine simulates grade changes, energy price responses, demand response events, and production schedule adjustments against your plant's live digital twin — producing quantitative multi-dimensional impact projections in minutes. Deployed in 4 weeks. No custom development required.

iFactory What-If Engine vs. Conventional Simulation and Planning Tools

Most steel plants already have some form of production planning or simulation tool — spreadsheets with macros, scheduling modules in the MES, or standalone discrete-event simulation packages. These tools share a common limitation: they operate on static data, require manual updates before each use, and are too slow to support the real-time strategic decisions that plant heads and strategy teams face in a dynamic operating environment. The following comparison illustrates how iFactory's What-If Engine differs from conventional planning and simulation approaches.

Capability Conventional Planning / Simulation Tools iFactory What-If Engine
Data Freshness Static data extracts — spreadsheets or MES snapshots that reflect plant status as of the last data pull, typically hours or days old at time of use. Live digital twin synchronized with Level 1, Level 2, MES, LIMS, and energy systems in real time. Every simulation starts from the plant's actual current state.
Scenario Speed 45 minutes to 4 hours per scenario for manual spreadsheet or simulation tool runs. Cross-functional team coordination required for each iteration. 15 to 90 seconds per scenario. Single user can evaluate 20+ scenarios in a single session without additional team coordination.
Variable Coverage Limited to 3–8 variables in typical spreadsheet or planning tool models. Complex interactions between variables are simplified or omitted. Simulates 50+ variables simultaneously across production, energy, quality, cost, and delivery dimensions. All variable interactions are modeled using physics-based process models.
Energy Market Integration Manual energy price entry or weekly price file import. No real-time market signal integration or automated price-response simulation. Real-time energy market price signal ingestion via REST APIs. Automated price response scenario generation when market prices cross configurable thresholds.
Quality Impact Projection No quality impact projection in most planning tools. Quality considered separately by metallurgy team after the production plan is published. Quality impact projected for each scenario — off-spec probability, transition material estimate, and first-pass yield impact by grade and product family.
Outcome Tracking Loop No automated outcome tracking. Scenario accuracy never measured because actual vs. projected comparison requires manual data collection that rarely happens. Automated outcome tracking for every executed scenario. Model accuracy improves by 8% per quarter through continuous comparison of projected vs. actual results.
Deployment Timeline 6–12 months for custom simulation model development, data integration, and validation. High engineering overhead and ongoing maintenance burden. 4-week fixed deployment program: digital twin configuration in week 1, simulation model calibration in week 2, live what-if testing in week 3, plant-wide rollout in week 4.

4-Week Deployment: From Plant Data Audit to Live What-If Simulation Engine

iFactory's What-If Engine deployment follows a structured 4-week program with defined deliverables per week. The program is designed to deliver a live, plant-specific simulation engine that plant heads and strategy teams can use for strategic decision support from week 4 onward. No custom model development, no data science engagement, and no extended pilot phase are required.

Week 1
Digital Twin Configuration
Data source mapping and connectivity established across Level 2, MES, LIMS, and energy management systems
Digital twin architecture configured to reflect plant layout, equipment specifications, and process flow
Baseline model calibration against 12+ months of historical operating data to validate process model accuracy
Week 2
Scenario Model Calibration
Physics-based process models calibrated to plant-specific equipment efficiency curves, thermal profiles, and constraint parameters
Grade change, energy price, demand response, and production schedule simulation models validated against historical events
User interface configured for strategy team and plant head roles with role-appropriate scenario parameter sets
Week 3
Live Simulation Testing
Live what-if simulation testing with plant strategy team using current plant operating data and real energy market signals
Scenario accuracy validation against actual outcomes for test decisions executed during the validation period
User training and workflow integration completed — strategy team operating the simulation engine independently
Week 4
Plant-Wide Rollout
Full production deployment with all scenario types enabled for plant head and strategy team daily use
Automated outcome tracking activated — every executed decision tracked against simulation projection
ROI baseline report delivered with measurable savings projections based on plant-specific production economics
STRATEGIC ROI FROM WEEK 4: MEASURABLE RESULTS STARTING DAY 29
Plants completing the 4-week deployment program report an average of $420,000 in identifiable cost savings or revenue capture within the first 60 days of full production use — driven by grade-change optimization, energy price response, demand response participation, and production schedule improvements identified through the simulation engine.
$420K
Avg. savings in first 60 days
92%
Scenario accuracy at go-live
84%
Faster decision cycle time

Expert Perspective: What-If Simulation Changes Strategic Decision-Making in Steel

The following perspective is from a plant head at a steel facility currently using iFactory's What-If Engine for strategic planning and operational decision support.

Before iFactory's What-If Engine, every major strategic decision at our plant required a cross-functional working session that consumed three to five days of engineering, operations, commercial, and finance team time. We would pull data from six different systems, build scenario models in spreadsheets, argue about assumptions for half a day, and produce a single scenario recommendation that we all knew was based on data that was already three days old. The first time I used the What-If Engine to evaluate a grade-change sequencing decision, I had a quantitative, multi-dimensional projection of throughput, energy cost, quality impact, and cost per tonne in under 90 seconds. I ran 14 scenarios in 20 minutes and selected the optimal sequence with confidence because I could see the trade-offs quantified across all dimensions simultaneously. That single grade-change decision saved us $340,000 in transition material and avoided a quality excursion that our manual process had completely missed. The platform paid for itself in that one decision.
Plant Head
Integrated Flat-Rolled Steel Mill — 2.4M TPY Capacity, U.S. Midwest

Strategic Simulation Use Cases: What Steel Plant Leaders Are Modeling Today

The following use cases represent the highest-value what-if simulation applications deployed across iFactory's steel plant customer base. Each use case includes a specific decision scenario, the simulation approach, and the measurable outcome achieved.

37%
Transition Material Reduction
Grade-change simulation optimizes tundish temperature ramp, caster speed profile, and alloy transition timing to minimize off-spec transition length. Result: 180–420 fewer tonnes of transition material per grade change.
$890K
Energy Cost Savings
Energy price response simulation evaluates furnace idling, load shedding, and shift timing options against real-time market prices. Result: optimal energy cost reduction while maintaining 97%+ production throughput.
4.2%
Throughput Improvement
Production schedule simulation tests sequence swaps, campaign extensions, and priority insertions across all downstream constraints. Result: measurable throughput gain without capital investment.
$1.6M
Demand Response Revenue
Demand response simulation identifies load reduction levels and recovery schedules that capture maximum revenue without unacceptable production loss. Result: net-positive participation in 94% of eligible events.
22%
Quality Deviation Reduction
Quality impact projection in scenario simulations identifies grade-change and schedule combinations that increase off-spec risk. Result: proactive avoidance of high-risk transitions before they appear in the plan.
8% / Q
Model Accuracy Improvement
Continuous outcome tracking loop compares projected vs. actual results for every executed decision. Result: simulation accuracy improves by 8% per quarter through model retraining and refinement.
92%
Scenario Accuracy
Validated against actual plant outcomes across grade change, energy, and demand response simulations
50+
Variables Simulated
Production, energy, quality, cost, and delivery metrics projected simultaneously per scenario
4 wks
Deployment Timeline
From data audit to live what-if simulation engine running on your plant digital twin
84%
Faster Decisions
Strategic decision cycle compressed from 3–5 days to under 4 hours per scenario evaluation

Frequently Asked Questions: What-If Scenario Simulation for Steel Plants

The What-If Engine connects to Level 2 process control systems, MES platforms, LIMS databases, and energy management systems via pre-built connectors for OSIsoft PI, Siemens, ABB, and 40+ industrial platforms. A minimum of 12 months of historical operating data is recommended for model calibration, though the engine begins producing meaningful simulations immediately after digital twin configuration in week 1.
Yes. The engine simulates 50+ variables simultaneously across production, energy, quality, cost, and delivery dimensions — capturing complex interactions between variables that conventional planning tools cannot model. Every scenario projection includes multi-dimensional impact with confidence intervals based on historical validation accuracy for each variable type.
The engine ingests real-time energy market pricing data via REST API connections to ISO/RTO market data feeds — PJM, MISO, ERCOT, CAISO, NYISO, and SPP in the United States. Price signals are incorporated directly into the simulation model, allowing the engine to generate automated energy price response scenarios when market prices cross user-configurable thresholds.
No. The What-If Engine is designed for use by plant heads, strategy teams, and operations planners with no data science or programming background. Scenario definition is handled through an intuitive parameter adjustment interface. Role-based training is delivered during week 3 of deployment, and users achieve independent operation within 90 minutes of hands-on training.
iFactory What-If Engine deployments typically achieve full cost recovery within 4 to 8 months of go-live, with documented measurable savings of $420,000 on average within the first 60 days. The fastest payback cases occur when grade-change optimization or energy price response simulation identifies a high-value opportunity in the first week of live use. A no-cost ROI modeling session using your plant's specific production economics is available.
Test Every Strategic Decision Against Your Plant's Live Digital Twin. Deploy in 4 Weeks. ROI in 60 Days.
iFactory's What-If Engine gives plant heads and strategy teams the power to simulate grade changes, energy price responses, demand response events, and production schedule adjustments against a live digital twin of your actual plant — producing quantitative multi-dimensional projections in seconds, not days. Fully deployed in 4 weeks with no custom development required.
92% Scenario Accuracy
Live Digital Twin
50+ Variables Simulated
Real-Time Energy Market Data
$2.8M Avg. Annual Savings

Conclusion: The Cost of Strategic Uncertainty Is Higher Than You Think

Every strategic decision in a steel plant is a bet on an unknown outcome — a grade change that may take longer than expected, an energy price response that may save less than projected, a demand response event that may cost more in lost production than the payment is worth, or a production schedule change that may create bottlenecks that nobody anticipated. The cost of these decisions is not the cost of getting them wrong — it is the cost of not knowing which ones will succeed before committing to them. That uncertainty cost is invisible in standard accounting reports because it never appears as a line item. It is embedded in every grade transition that produced more off-spec material than necessary, every energy price signal that was missed because the team could not evaluate the trade-off quickly enough, and every demand response event that was declined because the risk could not be quantified.

iFactory's What-If Engine eliminates strategic uncertainty by giving plant heads and strategy teams the ability to simulate any operational change against a live digital twin of their actual plant — producing quantitative multi-dimensional projections in seconds that previously required days of cross-functional effort. The result is faster decisions, better outcomes, and a strategic planning process that operates with the same speed and precision as the plant it supports. The digital twin is ready for your data. The simulation models are calibrated for your equipment. The only missing piece is the decision to deploy it. Book your live demo today.

Your Plant's Next Strategic Decision Is Too Important for Spreadsheets. Simulate It First on Your Live Digital Twin.
Pre-built what-if simulation engine for grade changes, energy price response, demand response, and production schedule optimization — purpose-built for steel manufacturing and deployed on your plant's live data in 4 weeks. No custom development required. No data science team needed. Just strategic decision support powered by your actual plant data.
Grade Change Simulation
Energy Price Response
Demand Response Modeling
Production Schedule Optimization
4-Week Deployment

Share This Story, Choose Your Platform!