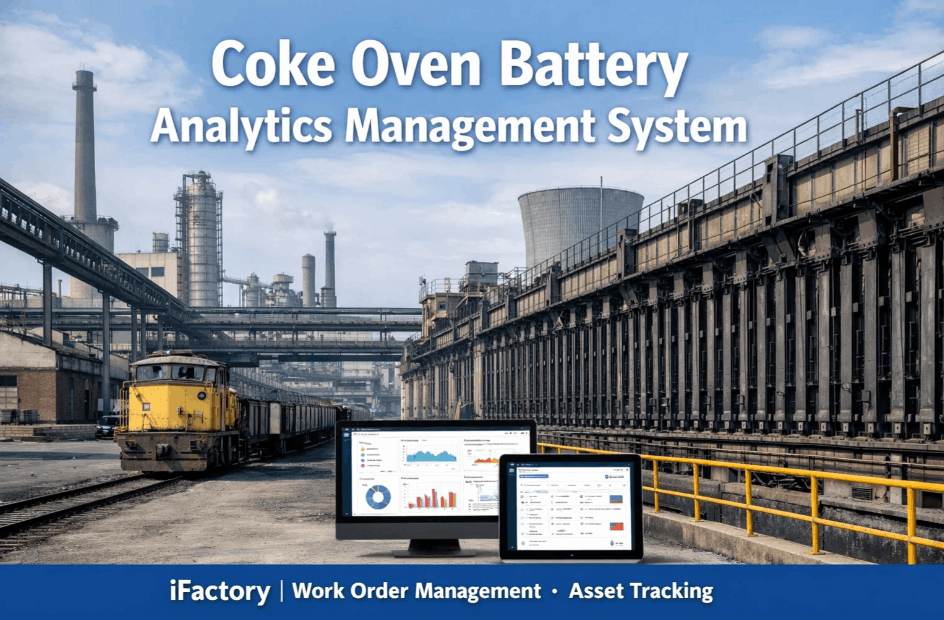
Coke oven battery management has transitioned from a labor-intensive "observational" craft into a high-precision, data-driven discipline. In 2026, the global push for steel decarbonization and energy efficiency has made Coke Oven Battery Analytics the primary lever for extending asset life and reducing emissions. With a single battery representing a $500M+ capital investment, identifying heating wall thermal drifts or oven door seal failures just minutes early can prevent catastrophic structural damage and multi-million dollar repair cycles. Book a Demo to see how iFactory's manufacturing intelligence platform converts raw thermal telemetry and gas pressure data into a Strategic Control Tower for your coke-making operations.
1. Heating Wall & Refractory Health Analytics
The heating wall is the thermal heart of the coke battery, and its degradation is the single largest threat to asset longevity. iFactory's Refractory Tracking Hub utilizes high-resolution infrared thermography and integrated wall-pressure sensors to identify erosion patterns before they lead to structural wall-bowing or "Sticker" ovens. By tracking the thermal signature of every heating flue, site managers can optimize gas-to-air ratios and eliminate the localized hot spots that accelerate refractory spalling.
Traditional battery management relies on manual temperature readings taken once per shift—a "snapshot" approach that misses transient thermal spikes. iFactory moves you to Continuous Thermal Profiling, where every oven's carbonization curve is monitored in 15-minute intervals. Schedule a thermal audit to baseline your battery's current refractory health and stop the erosion cycle.
Ceramic Welding & Hot-Repair Strategy
When erosion occurs, the method of repair determines the quality of the seal and the remaining life of the silica brick. iFactory's Maintenance Analytics differentiates between areas requiring simple patching and those needing high-precision Ceramic Welding. By correlating wall temperatures with historical erosion maps, our system guides maintenance crews to the exact coordinates where ceramic powder fusion will be most effective.
This proactive approach prevents the "patch-over-patch" failure cycle that often leads to sticker ovens. iFactory logs the exact tonnage of repair material used per oven, allowing you to calculate the true cost of maintenance versus the ROI of a complete re-line. Track your refractory spend with our integrated maintenance ledger.
The Coke-Making Pushing & Charging Lifecycle
Effective battery management requires the perfect synchronization of the charging, carbonization, and pushing phases. iFactory's Lifecycle Analytics creates a digital twin of every "oven-cycle," tracking the exact energy consumed and pressure exerted from charge to push. Book a Demo to see how we automate this vertical lifecycle tracking.
Coal Charging & Bulk Density Control
Monitor charging car weight variance and coal moisture levels. Excessive moisture leads to high gas volume and increased pressure on the ascension pipes. iFactory tracks every 'Charge' against the 'Planned' weight, optimizing the coal-cake density for maximum CSR.
Carbonization & Flue-Level Heating
The 16-20 hour "soak" period. iFactory charts the thermal ramp-up of each oven individually, identifying "Under-Heated" zones that lead to green coke or "Over-Heated" zones that cause premature refractory failure. Real-time OCAPs trigger if flue temperatures drift outside the 15°C safety window.
Pushing Force & "Sticker" Prevention
Measure the force required by the pusher machine with millisecond precision. Increasing pushing force is the earliest indicator of wall erosion. iFactory automatically flags ovens where pushing force exceeds the 5-cycle rolling average, preventing catastrophic wall damage.
Quenching & Final Coke Quality Integration
Correlate quenching duration and water volume with final CSR and CRI. This ensures that ironmaking operations receive a consistent structural material. Connect your quality lab data to start your quality-to-yield optimization.
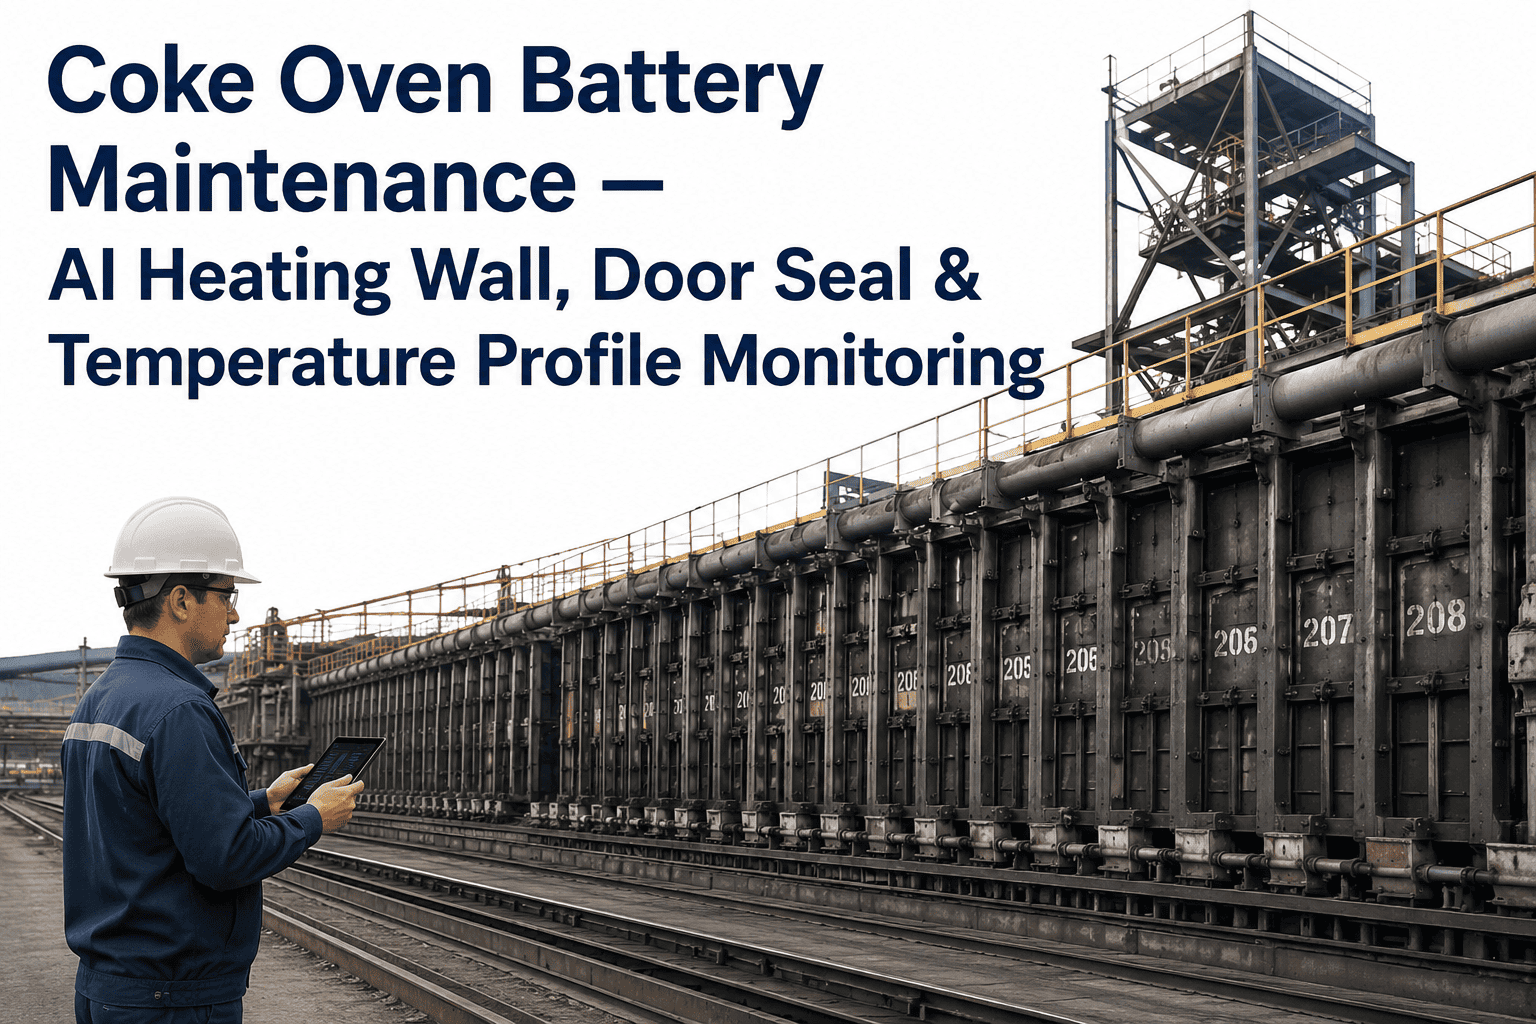
2. Door System Integrity & Emission Analytics
Coke oven door leaks are the primary source of fugitive emissions. iFactory's Door Analytics Module monitors latch pressure, seal cleanliness, and visual leak severity using AI-vision integration. We move your maintenance team from reactive patching to predictive component care.
| Component Group | Key Analytics Metric | Risk Threshold | AI-Driven Action |
|---|---|---|---|
| Oven Door Seal | Visual Leak Score (AI Vision) | Level 3 Leak Duration > 5m | Auto-schedule seal replacement; flag for NESHAP report |
| Door Latch System | Hydraulic Latch Pressure | Deviation > 10% from baseline | Predictive maintenance on latch spring tension |
| Heating Wall Refractory | Surface Temp (IR) | > 250°C at frame interface | Identify thermal bridge and schedule hot-spot patching |
| Ascension Pipe Cap | Gas Pressure Pulse | Pressure Drop < 15 Pa | Verify cap seal integrity and liquor spray flow |
| Standpipe Liquor Spray | Nozzle Delta-P | Delta-P > 0.5 bar increase | Trigger automated nozzle cleaning to prevent tar blockage |
Digital Twin for Thermal Equilibrium
Every battery has a unique thermal signature governed by its age, refractory health, and heating system design. iFactory's Digital Twin models the heat-transfer coefficients across the entire battery, calculating the precise energy required to reach the "Golden Carbonization Curve." This prevents "Cold Centers" (incomplete carbonization) which cause green coke emissions and high pushing forces.
By optimizing the thermal equilibrium, iFactory reduces the variance in coke quality between the pusher side and the coke side. This consistency is the primary lever for lowering the Coke Rate in the Blast Furnace, leading to massive downstream savings. Model your battery's thermal twin today.
Coal Blend & Chemical Synergy Analytics
The success of the carbonization process begins in the coal yard. iFactory's Coal Blend Analytics links the chemical properties of your coal mix (CSR, CRI, and Dilatation) directly to your battery's structural health. High-expansion coals can exert excessive wall pressure during the plastic phase, leading to permanent silica brick displacement. Our system models this Internal Gas Pressure (IGP) in real-time.
By correlating upstream blend data with downstream pushing force, iFactory helps you optimize your coal procurement strategy. Book a Demo to see how we bridge the gap between the coal yard and the battery.
By-Product Chemical Yield & Scrubber Efficiency
Coke Oven Gas (COG) valorization extends beyond fuel; it is about chemical purity. iFactory's By-Product Analytics monitors the efficiency of primary coolers, tar decanters, and ammonia scrubbers. By tracking the ammonia and H2S levels in the gas stream, we optimize the chemical dosage and water-flow rates to maximize by-product quality while meeting environmental discharge limits.
For plants producing Ammonium Sulfate or BTX, every 0.1% increase in recovery efficiency adds millions to the bottom line. iFactory's Scrubber Control Loop automates these adjustments, ensuring that your byproduct plant is always operating at the peak of its chemical yield curve. Optimize your chemical yield here.
ESG & The Net-Zero Steel Pathway
Coke making is under intense pressure to decarbonize. iFactory supports your ESG Strategy by providing precise data on carbon intensity per ton of coke. We enable the transition to low-carbon operations by optimizing gas collection to minimize flaring and maximizing the recovery of hydrogen-rich gas for external power or heating applications.
Our platform is "Future-Ready," supporting the integration of carbon capture sensors and hydrogen-ready gas main infrastructure. We help you move from being a high-emission asset to a key participant in the green energy transition. Track your ESG roadmap with iFactory.
The iFactory Coke Plant Digital Maturity Matrix
Identify your current state and map your path to a fully optimized, zero-emission Control Tower.
The Strategic Roadmap to Battery Life Extension
Phase 1: Instrumentation & Data Linkage
Deploy high-temp IR sensors on heating walls and integrate machine PLCs. Establish an IoT gateway for centralized telemetry. Output: Real-time visibility.
Phase 2: Thermal & Pressure Baseling
Establish "Golden Curve" carbonization profiles and automated emission leak logging. Output: Digital compliance tower.
Phase 3: AI-Driven Predictive Modeling
Enable the sticker-prevention engine and AI vision for door seals. Output: 40% reduction in unplanned maintenance.
Phase 4: Byproduct & Energy Valorization
Optimize gas-main pressure and maximize hydrogen recovery. Output: Measurable reduction in Scope 1 emissions.
Phase 5: Autonomous Control Integration
Implement closed-loop heating automation and pushing schedule optimization. Output: 10+ year life extension.
"The transition to iFactory's Coke Battery Control Tower has been the most significant operational shift in my career. We stopped 'chasing' leaks and started predicting them. Our battery life projection has extended by a decade."
Frequently Asked Questions
How does AI identify coke oven refractory erosion?
We correlate infrared thermal scanning data with pushing-force metrics. Thinned refractory walls show up as localized hot spots, while the resulting wall-bowing increases frictional resistance during the push.
Why is Gas Collection Main pressure so critical?
Maintaining a positive pressure (80-120 Pa) is required to move gas to the byproduct plant, but if it spikes, it forces gas through door seals (emissions). iFactory uses high-speed sensors to adjust suction instantly.
Can analytics reduce coke oven emissions for NESHAP reporting?
Yes. iFactory provides a digital "Compliance Tower" that logs every visible leak incident and its duration, generating automated reports that meet EPA and NESHAP standards.
What is the "sticker" oven warning system?
Our warning system tracks the rolling 5-cycle pushing force for every oven. If the force increases by 15% or carbonization temp fails to reach target, the system flags the oven as a "Risk."
How does coal moisture affect your heating wall analytics?
High moisture requires more energy to evaporate. iFactory's thermal models adjust the gas-to-air ratio for every oven based on its specific moisture, preventing "cold ovens."
What is the ROI of a Coke Oven Analytics platform?
ROI is achieved through a 10-15% reduction in fuel gas usage, the extension of asset life by 5-10 years, and the reduction in environmental fines and labor.
Does iFactory support ceramic welding and patching logs?
Yes. We include a Refractory Maintenance Ledger where every patch is logged by oven and wall coordinate, creating a 'Health Map' of the battery.
Can we integrate our existing Pusher Machine data?
Yes. iFactory is platform-agnostic. We pull data from on-board machine PLCs via industrial Wi-Fi, correlating physical performance with the battery's thermal data.
What is the difference between silica brick expansion and structural bowing?
Silica bricks have a predictable thermal expansion curve. Structural bowing, however, is a result of permanent silica brick displacement due to internal gas pressure. iFactory differentiates these by correlating age-based expansion with real-time pressure spikes.
How does standpipe maintenance affect gas yield?
A leaking standpipe cap or a blocked liquor spray nozzle can lead to 5-10% gas loss. iFactory's standpipe analytics monitors the 'pull' on every oven to ensure maximum gas collection main yield.